 Arctic SDI catalogue
Recreational Vessel Traffic Model for British Columbia
Description:
Data on recreational boating are needed for marine spatial planning initiatives in British Columbia (BC). Vessel traffic data are typically obtained by analyzing automatic identification system (AIS) vessel tracking data, but recreational vessels are often omitted or underrepresented in AIS data because they are not required to carry AIS tracking devices. Transport Canada’s National Aerial Surveillance Program (NASP) conducted aerial surveys to collect information on recreational vessels along several sections of the BC coast between 2018 and 2022.
Recreational vessel sightings were modeled against predictor variables (e.g., distance to shore, water depth, distance to, and density of marinas) to predict the number of recreational vessels along coastal waters of BC.
The files included here are:
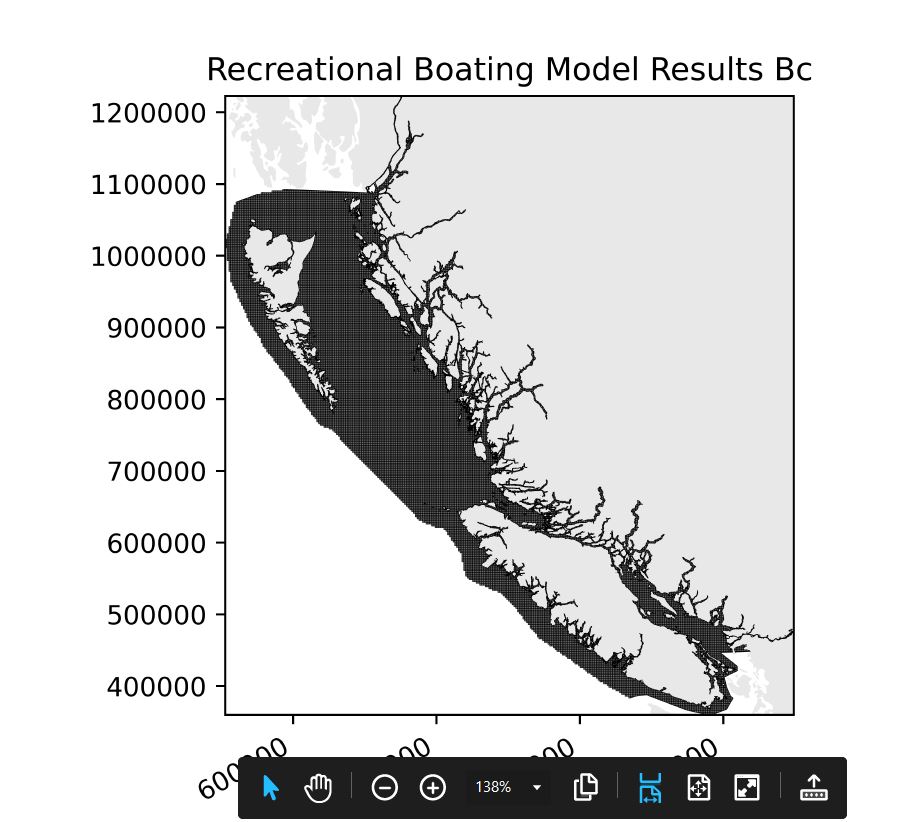
--A Geodatabase (‘Recreational_Boating_Data_Model’), which includes: (1) recreational vessel sightings data collected by NASP in BC and used in the recreational vessel traffic model (‘Recreational_Vessels_PointData_BC’); (2) aerial survey effort (or number of aerial surveys) raster dataset (‘surveyeffort’); and (3) a vector grid dataset (2.5 km resolution) containing the predicted number of recreational vessels per cell and predictor variables (‘Recreational_Boating_Model_Results_BC).
--Scripts folder which includes R Markdown file with R code to run the modelling analysis (‘Recreational_Boating_Model_R_Script’) and data used to run the code.
Methods:
Data on recreational vessels were collected by NASP during planned aerial surveys along pre-determined routes along the BC coast from 2018 to 2022. Data on non-AIS recreational vessels were collected using video cameras onboard the aircraft, and data on AIS recreational vessels using an AIS receiver also onboard the aircraft. Recreational boating predictors explored were: water depth, distance to shore, distance to marinas, density of marinas, latitude, and longitude. Recreational vessel traffic models were fitted using Generalized Linear Models (GLM) R packages and libraries used here include: AED (Roman Lustrik, 2021) and MASS (Venables, W. N., Ripley, 2002), pscl package (Zeileis, Kleiber, and Jackman, 2008) for zeroinfl() and hurdle() function. Final model was selected based on the Akaike’s information criterion (AIC) and the Bayes’ information criterion (BIC). An R Markdown file with code use to run this analysis is included in the data package in a folder called Script.
Spatial Predictive Model: The selected model, ZINB, consist of two parts: one with a binomial process that predicts the probability of encountering a recreational vessel, and a second part that predicts the number of recreational vessels via a count model. The closer to shore and to marinas, and the higher the density of marinas, the higher the predicted number of recreational vessels. The probability of encountering recreational vessels is driven by water depth and distance to shore. For more information on methodology, consult metadata pdf available with the Open Data record.
References:
Serra-Sogas, N. et al. 2021. Using aerial surveys to fill gaps in AIS vessel traffic data to inform threat assessments, vessel management and planning. Marine Policy 133: 104765. https://doi.org/10.1016/j.marpol.2021.104765
Data Sources:
Recreational vessel sightings and survey effort: Data collected by NASP and analyzed by Norma Serra to extract vessel information and survey effort (more information on how this data was analyzed see SerraSogas et al, 2021).
Bathymetry data for the whole BC coast and only waters within the Canadian EEZ was provided by DFO – Science (Selina Agbayani). The data layer was presented as a raster file of 100 meters resolution. Coastline dataset used to estimate distance to shore and to clip grid was provided by DFO – Science (Selina Agbayani), created by David Williams and Yuriko Hashimoto (DFO – Oceans).
Marinas dataset was provided by DFO – Science (Selina Agbayani), created by Josie Iacarella (DFO – Science). This dataset includes large and medium size marinas and fishing lodges. The data can be downloaded from here: Floating Structures in the Pacific Northwest - Open Government Portal (https://open.canada.ca/data/en/dataset/049770ef-6cb3-44ee-afc8-5d77d6200a12)
Uncertainties:
Model results are based on recreational vessels sighted by NASP and their related predictor variables and not always might reflect real-world vessel distributions. Any biases caused by the opportunistic nature of the NASP surveys were minimized by using survey effort as an offset variable.
Simple
- Date ( RI_367 )
- 2023-07-07
- Date ( RI_366 )
- 2023-05-10
- Date ( RI_368 )
- 2024-09-27
- Status
- completed; complété RI_593
- Maintenance and update frequency
- asNeeded; auBesoin RI_540
- Keywords ( RI_525 )
-
- British Columbia
- Keywords ( RI_528 )
-
- recreational boating
- marine
- model output
- Government of Canada Core Subject Thesaurus Thésaurus des sujets de base du gouvernement du Canada ( RI_528 )
-
- Vessels
- Outdoor recreation
- Classification
- unclassified; nonClassifié RI_484
- Use limitation
- Open Government Licence - Canada (http://open.canada.ca/en/open-government-licence-canada)
- Access constraints
- license; licence RI_606
- Use constraints
- license; licence RI_606
- Spatial representation type
- vector; vecteur RI_635
- Metadata language
- eng; CAN
- Character set
- utf8; utf8 RI_458
- Topic category
-
- Oceans
- Begin date
- 2015-01-06
- End date
- 2022-08-31
))
- Supplemental Information
-
RECREATIONAL VESSEL TRAFFIC DATA
Data on recreational vessels were collected by NASP during planned aerial surveys along pre-determined routes along the BC coast from 2018 to 2022. Data on non-AIS recreational vessels were collected using video cameras onboard the aircraft, and data on AIS recreational vessels using an AIS receiver also onboard the aircraft. Recreational vessels were classified as pleasure crafts or sailboats. The date (day, month and year), class (AIS or non-AIS) and region were vessels were sighted are included as attributes for each sighting.
We included a data layer depicting the spatial distribution of NASP surveys because it is needed to adequately understand the distribution of the recreational boating sighting data in BC. Aerial surveys, although they were conducted in a systematic matter, they were not homogenously distributed across the study area with some regions receiving more surveys than others.
Survey effort was estimated by first converting flightpath from XML files to a polyline using scripts written in Python. The portion of the flightpath representing the survey was determined using the position of the aircraft at the beginning and at the end of the survey and available in the video analyzed. For surveys conducted outside the Salish Sea, the swath width reported by NASP crew on the survey form was used to build a buffer around the survey portion of the flightpath. The NASP estimation of the swath width was based mainly on the width of the channels they surveyed. For example, for surveys within the Douglas Channel, NASP estimated swath widths to be 5 km, which is the actual width of the channel. For surveys conducted in the Salish Sea, the swath width used was estimated based on distance sampling methodology and explained in Serra-Sogas, et al, 2021. For other surveys, the swath was based on the width of channels or narrow passages where surveys took place. Buffered survey tracks were converted to raster (1 km resolution) and combined using Cell Statistics tool in ArcMap. The field “SURVEYCOUNT” or “VALUE” contains the sum of surveys per cell.
MODEL VARIABLES
All model variables were compiled using a 2.5 km cell vector grid occupying only BC Territorial waters (extending 12 nautical miles seaward of the UNCLOS baseline). The number of recreational vessels per cell and mean survey effort were extracted per cell. Recreational boating predictors explored were: water depth, distance to shore, distance to marinas, density of marinas, latitude, and longitude.
Scatterplots were used to explore relationships between predictors and response variables to determine if a relationship exists between predictor a response variables and to assess presence of nonlinearity (Zuur et al., 2010). A correlation coefficients with and p-values were estimate using the Hmisc package in R (Jr, 2021), and the corrplot package (Taiyun Wei, 2017) in R (R Development Core Team, 2020) to display the results. Also, variance-inflation factors (VIF) were estimated to measure the impact of collinearity among variables in the regression model; that is, the effect of incorporating redundant information and inflating the error term.
High values of recreational vessel counts were identified via boxplots. Cells with more than 10 recreational vessels counts were identified as outliers and removed before modelling analysis.
NASP survey effort was included as an offset variable. Because the effort employed to sight recreational vessels was not homogeneous across the study area, recreational vessel counts had to be standardized and interpreted as a rate of occurrence or number of recreational vessels per unit of effort. Rates can be analyzed as count data in regression models by moving the denominator (i.e., unit of effort) to the right-hand side of the regression model as log(effort) with a fixed coefficient equal to one (Agresti, 2003; McCullagh, 2019). Including NASP survey effort as an offset variable also meant that we assume that the likelihood of detecting a recreational vessel only depends on the presence of the aircraft been in the area if the vessel is in fact in the area, and no other factors such as weather conditions affect the probability of detection.
MODEL ANALYSIS
Recreational vessel traffic models were fitted using Generalized Linear Models (GLM) with Negative Binomial (NB) and Zero-Inflated Negative Binomial distributions (ZINB) and effort as an offset variable. R packages and libraries used here include: AED (Roman Lustrik, 2021) and MASS (Venables, W. N., Ripley, 2002), pscl package (Zeileis, Kleiber, & Jackman, 2008) for zeroinfl() and hurdle() function.
Automated backward elimination approach with likelihood-ratio test (Zuur et al., 2009) was used to select model predictors from the initial list of potential predictor variables. This approach consists of dropping one term in turn and estimating the difference between the deviance of the nested model and the full model. A non-significant χ2 statistic (p > 0.05) indicates that there is no difference between the full and nested model and hence the dropped term can be removed from the model. This procedure was applied to a full NB model and automated using the function drop1() from the AED package in R (Roman Lustrik, 2021). Variables for the ZINB model selected by dropping one variable at a time and models compared using Akaike’s information criterion (AIC) and all coefficients were significant (i.e., p > 0.05).
Final model was selected based on the Akaike’s information criterion (AIC) and the Bayes’ information criterion (BIC). Also, recreational vessel counts were plotted against predicted counts to assess each model performance and the ability to discriminate between positive and zero counts. To validate the performance of a selected model, model residuals were plotted against the fitted values and predictor variables.
After model selection and calibration, the ZINB was selected to predict the number of recreational vessels present per unit of effort in each cell for the entire study area (i.e., BC’s Territorial Sea). For this, effort was set to 1. We used the predict() function from the pscl package in R (Zeileis et al., 2008). An R Markdown file with code use to run this analysis is included in the data package in a folder called Script.
SPATIAL PREDICTIVE MODEL
The selected model, ZINB, consist of two parts: one with a binomial process and that predicts the probability of encountering a recreational vessel, and a second part that predicts the number of recreational vessels via a count model. The closer to shore and to marinas, and the higher the density of marinas, the higher the predicted number of recreational vessels. The probability of encountering recreational vessels is driven by water depth and distance to shore.
- Reference system identifier
- https://epsg.io / EPSG:4326 /
- Distribution format
-
-
FGDB/GDB
(
unknown
)
-
FGDB/GDB
(
unknown
)
- OnLine resource
-
Recreational Vessel Traffic Model for British Columbia
(
HTTPS
)
Dataset;FGDB/GDB;eng
- OnLine resource
-
Recreational Vessel Traffic Model for British Columbia
(
ESRI REST: Map Server
)
Web Service;ESRI REST;eng
- OnLine resource
-
Recreational Vessel Traffic Model for British Columbia
(
ESRI REST: Map Server
)
Web Service;ESRI REST;fra
- OnLine resource
-
Data Dictionary
(
HTTPS
)
Supporting Document;PDF;eng,fra
- OnLine resource
-
Recreational Vessel Traffic Model for British Columbia -- GIS Hub metadata
(
HTTPS
)
Supporting Document;PDF;eng
- OnLine resource
-
Recreational Vessel Traffic Model for British Columbia -- GISHub metadata
(
HTTPS
)
Supporting Document;PDF;fra
- OnLine resource
-
Model RecBoat Variables grid
(
HTTPS
)
Dataset;CSV;eng
- OnLine resource
-
TerritorialSea RecBoat Variables Grid
(
HTTPS
)
Dataset;CSV;eng
- File identifier
- fed5f00f-7b17-4ac2-95d6-f1a73858dac0 XML
- Metadata language
- eng; CAN
- Character set
- utf8; utf8 RI_458
- Hierarchy level
- dataset; jeuDonnées RI_622
- Date stamp
- 2025-02-05T12:43:52.618Z
- Metadata standard name
- North American Profile of ISO 19115:2003 - Geographic information - Metadata
- Metadata standard version
- CAN/CGSB-171.100-2009
https://www.gis-hub.ca/dataset/recreational-vessel-traffic-model-for-british-columbia
Overviews
Spatial extent
Provided by
