 Arctic SDI catalogue
Eau douce
Type of resources
Available actions
Provided by
Representation types
Update frequencies
status
-

This product provides the ratio of surface freshwater intake to water yield for August 2013, with the exception of drainage regions 7, 8, 16, 17 and 18, which use the ratio of August intake to the long-term minimum monthly water yield. Surface freshwater intake aggregates data from the Survey of Drinking Water Plants, 2013 and the Industrial Water Use Survey, 2013 with estimates of agricultural water use for 2013 based on the Agricultural Water Use Survey and the Alberta Irrigation Information report. Data for water use by the oil and gas industry and households not supplied by a public water provider are also excluded.
-

This product provides the variability index for selected drainage regions in Canada. Variability is measured using a coefficient of variation (CV) to compare all months over a 42-year time period and is a measure of the dispersion or variation in the monthly yield values from 1971 to 2013 (and 1971 to 2012 for drainage region 1). It is defined as the ratio of the standard deviation to the mean or the standard deviation divided by the mean, with higher CVs indicating more variability in monthly water yields. The monthly variability was not calculated for drainage regions 5, 7, 8, 16, 17, 18, or the Labrador portion of 25.
-
The Canada Nature Fund for Aquatic Species at Risk (CNFASAR) is a contribution program that focuses on providing funding for recovery and threat mitigation activities in nine priority places and to address two marine threats to aquatic species at risk. The Priority Places and Marine Threats layer supports CNFASAR by delineating the location of the places and threats. The Canada Nature Fund for Aquatic Species at Risk (CNFASAR) supports applicants in the design and delivery of stewardship projects. These projects support the recovery and protection of aquatic species at risk. DFO has identified 2 priority marine threats and 9 priority places as the focus for projects funded by CNFASAR, these areas are included in this dataset.
-
The Aquatic Invasive Species Surveillance Database is a compilation of fish community and habitat data from DFO’s Aquatic Invasive Species and Invasive Carp Program early detection surveillance efforts in Canadian waters of the Great Lakes basin. Data includes: sampling site location, date, fish species and counts, and associated habitat information. Annual project-specific details including purpose/objectives and study methodology are often reported in the DFO Canadian manuscript report of fisheries and aquatic sciences series.
-

PURPOSE: Chlorophyll a is a photosynthetic pigment common to aquatic algae, and its measurement can provide an estimate of free-floating algae abundance in an aquatic system. For more than 40 years, the Fisheries and Oceans Canada - Great Lakes Laboratory for Fisheries and Aquatic Sciences (DFO-GLLFAS) office in Sault Ste. Marie Ontario has collected water samples for chlorophyll a spectrophotometric analysis, producing data in the form of mg/m3. The collection of chlorophyll a data was generally conducted to assist in characterizing the aquatic systems level of primary productivity, since that can influence fish abundance. This was a supplementary measure of the quality of fish habitat in these systems for a variety of fish-related projects of relevance to DFO’s mandate. Consistency of data collection was dependent on the duration of each project and funding available. DESCRIPTION: The initial study collected chlorophyll a data from the five lakes in the Turkey Lakes Watershed (TLW – Upper and Lower Batchawana Lakes, Wishart Lake, Little Turkey Lake and Turkey Lake) as well as Quinn Lake which is located outside of the TLW (see Smokorowski et al. 2006) in partnership with Environment and Climate Change Canada (ECCC) and Natural Resources Canada (NRCAN), as part of Canada’s Acid Rain Initiative. The TLW study was established in 1979 to evaluate the impacts of acid rain on terrestrial and aquatic ecosystems. This dataset encompasses chlorophyll a data collected from five lakes in the TLW and Quinn Lake (data also collected by the Canadian Wildlife Service and Environment and Climate Change Canada) from 1983 - 2010 with some gaps of varying duration (Webster et al., 2021). Note that an experimental habitat removal took place in some TLW lakes and Quinn Lake in 1999 and 2000. Specifically, in autumn of 1999, 50% of the coarse woody material was removed from the shorelines of Little Turkey Lake and Quinn Lake, and in autumn of 2000, 50% of the course woody material was removed from Wishart Lake shoreline (details available in Smokorowski et al., 2006). Methods Summary: Sampling was only conducted during the open water season and the frequency and extent of sampling frequency in each waterbody varied and was project- and funding-dependent. There are no chlorophyll a data for the years 1986, 1989 – 1990, 1996 – 1997, 2006-2007 and 2009. Sampling was accomplished by rinsing on site an appropriately-cleaned 1 L, brown-opaque polyethylene bottles at least three times. For hand draw samples, the bottle was immersed sub-surface (less than 0.5 meters) to collect the sample. Composite tube samples were collected using an integrated water sampling tube that collected epilimnion water from the entire water column to a depth of 5 meters. Up to five - 1 L (1000 mL) samples were collected per station and returned to the lab on ice. Each 1 L sample was filtered using glass fiber filters (Whatman GF/C, 42.5 mm) within one day of sampling, and then frozen prior to standard chlorophyll a analysis (American Public Health Association [APHA] 1985). From 1983-1998, Chlorophyll a concentrations (mg/L) was calculated based on APHA 1985; from 1998 to present the calculation was based on APHA (1998). The sample dataset information includes the georeferenced sampling locations, the raw data for chlorophyll a calculations, and the calculated chlorophyll a concentrations using both the APHA (1985) and APHA (1998) methods. This dataset was published in partnership with the Canadian Institute of Ecology and Evolution - Living Data Project, which was funded by a CREATE grant from the Natural Science and Engineering Research Council of Canada. We would like to recognize Caroline Dallstream for her effort in publishing this dataset. SAMPLING METHODS: Methods Summary: Sampling was only conducted during the open water season and the frequency and extent of sampling frequency in each waterbody varied and was project- and funding-dependent. There are no chlorophyll a data for the years 1986, 1989 – 1990, 1996 – 1997, 2006-2007 and 2009. See Sampling was accomplished by rinsing on site an appropriately-cleaned 1 L, brown-opaque polyethylene bottles at least three times. For hand draw samples, the bottle was immersed sub-surface (less than 0.5 meters) to collect the sample. Composite tube samples were collected using an integrated water sampling tube that collected epilimnion water from the entire water column to a depth of 5 meters. Up to five - 1 L (1000 mL) samples were collected per station and returned to the lab on ice. Each 1 L sample was filtered using glass fiber filters (Whatman GF/C, 42.5 mm) within one day of sampling, and then frozen prior to standard chlorophyll a analysis (American Public Health Association [APHA] 1985). From 1983-1998, Chlorophyll a concentrations (mg/L) was calculated based on APHA 1985; from 1998 to present the calculation was based on APHA (1998). The sample dataset information includes the georeferenced sampling locations, the raw data for chlorophyll a calculations, and the calculated chlorophyll a concentrations using both the APHA (1985) and APHA (1998) methods. USE LIMITATION: To ensure scientific integrity and appropriate use of the data, we would encourage you to contact the data custodian.
-

This product provides the median of monthly maximum turbidity values (in nephelometric turbidity units) for drinking water facilities by drainage region. Turbidity refers to the relative cloudiness of water, caused by suspended particles in water. The Survey of Drinking Water Plants collected this monthly maximum turbidity data for surface water sources from facilities reporting turbidity data for at least 10 months in 2013. These facilities served 24 million people and produced 4,091 million cubic metres of potable water from surface water sources in 2013. Source water turbidity was monitored continuously at 42% of these drinking water plants in 2013, daily at 34% of plants and less frequently at the remaining plants.
-

The Canadian Environmental Sustainability Indicators (CESI) program provides data and information to track Canada's performance on key environmental sustainability issues. The Water quantity in Canadian rivers indicator provides a national summary of the annual water quantity status in rivers across Canada from 2009 to 2023 and by monitoring station in 2023. The indicator also offers trends that provide an assessment of whether there have been significant observed changes over time in water quantity, of very-high and very-low flows, at monitoring stations across Canada for a 50-year period from 1974 to 2023. Information is provided to Canadians in a number of formats including: static and interactive maps, charts and graphs, HTML and CSV data tables and downloadable reports. See the supplementary documentation for the data sources and details on how the data were collected and how the indicator was calculated. Canadian Environmental Sustainability Indicators: https://www.canada.ca/environmental-indicators
-
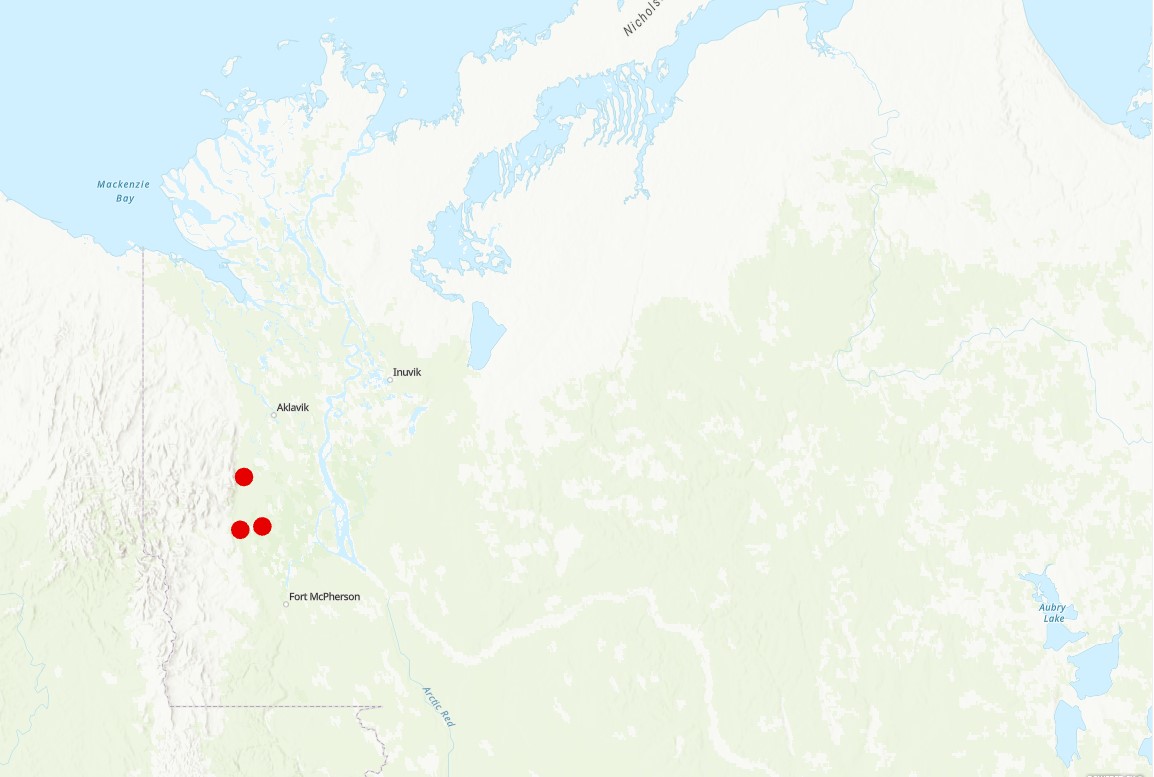
Situated in the Gwich’in settlement Area (GSA), the Rat River is inhabited by anadromous Dolly Varden (Salvelinus malma malma) that are harvested by both Gwich’in and Inuvialuit beneficiaries. The harvest of Dolly Varden from the Rat River occurs during the summer at feeding areas along the coast (by the Inuvialuit) and during upstream migration in the Mackenzie Delta (by both Gwich’in and Inuvialuit). Dolly Varden stocks are co-managed under an Integrated Fisheries Management Plan (IFMP) whose signatories include Fisheries and Oceans Canada (DFO), Gwich'in Renewable Resources Board, Fisheries Joint Management Committee, and Parks Canada Agency. The Rat River Working Group, the co-management body that makes recommendations for harvest levels for Dolly Varden stocks in the GSA, has supported research activities that facilitate implementation of the IFMP, including studies to monitor harvest levels and assess population status. Population studies (e.g., abundance estimates, biological and genetic sampling) and coastal harvest monitoring activities allow for a comprehensive assessment of this stock. The data are used to inform co-management partners on the status of Dolly Varden from the Rat River.
-

Water temperature and water level are significant environmental factors affecting ecology of anadromous fish. Large-scale freshwater monitoring networks remain sparse, yet environmental protocols rely heavily on water temperature and water levels to assist decision making on river closures. Our river monitoring project in Newfoundland and Labrador provides river water temperature and river water level for salmon rivers across the province. 72 temperature loggers are deployed across 24 river systems in Newfoundland and Labrador. Temperature loggers are deployed in approximately 30 cm of water and remain in river year-round. Loggers consist of Onset level loggers, tidbit loggers, and pendants or Innovasea minilogs. Some loggers are deployed in duplicate at locations to provide data redundancy in event of equipment loss or failure. Equipment is monitored throughout the season to ensure proper placement in water columns, with downloads taking place during monitoring trips.
-
This dataset includes water chemistry data collected from five of the six lakes as part of the Northwestern Ontario Size Series project in 1987 and 1990 including species of nitrogen and phosphorus, carbon, chlorophyll a, conductivity, soluble reactive silica, chloride, sulphate, conductivity, sodium, potassium, magnesium, calcium, pH, alkalinity and organic acids