 Arctic SDI catalogue
RI_542
Type of resources
Available actions
Topics
Keywords
Contact for the resource
Provided by
Formats
Representation types
Update frequencies
status
Scale
Resolution
-

Nekton assemblages in Zostera marina beds and adjacent bare soft-sediments were sampled on the south and eastern shore of Nova Scotia. Sampling gear used were visual snorkel transects and a benthic beam trawl. Fish were identified and size either measured (trawl) or estimated in situ (snorkel transects). Surveys were conducted in mid-July to August in summer of 2013 and 2014 across multiple sampling sites. Multiple replicate transects were conducted at each site. Raw abundances from observations were transformed into young of year (YOY) equivalent abundance, and then into density of each species calibrated to account for the sampling equipment and day/night differences. Cite this data as: Wong, M. C. Data of: Fish and large decapods in eelgrass (Zostera marina) beds on the Atlantic coast of Nova Scotia, Canada. Published: April 2020. Coastal Ecosystems Science Division, Fisheries and Oceans Canada, Dartmouth, N.S. https://open.canada.ca/data/en/dataset/dbc56f11-4a97-45e7-99f4-71966b51630c
-

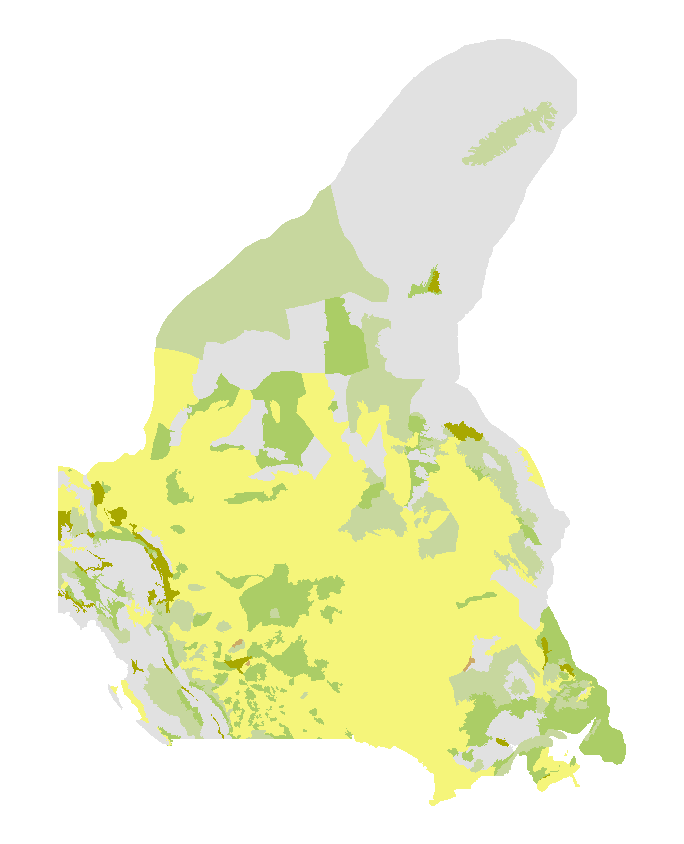
The National Ecological Framework for Canada's "Surficial Geology by Ecoregion” dataset contains tables that provide surficial geology information with the ecoregion framework polygons. It provides codes that characterize surficial geology (unconsolidated geologic materials) and their English and French-language descriptions as well as information about the area and percentage of the polygon that the material occupies.
-
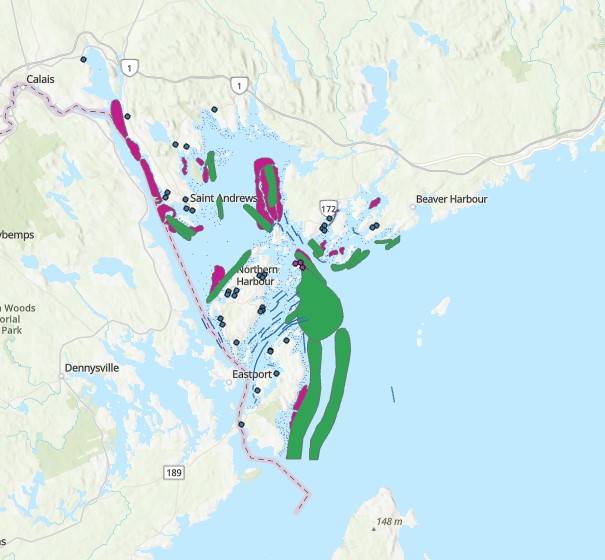
This data record contains a digitized map reproduced from the original Passamaquoddy Marine Resource Pilot Study - 1982 Fisheries. The original map was produced by the Maritime Resource Management Service, using its GEO-BASED SYSTEM: an automated geographic information system used to create data bases and to manipulate and plot information for numerous natural resource applications. The original map is a product of the GEO-BASED SYSTEM and a conventional phot mechanical process. The fisheries information was extracted from a marine data base gathered by A.C.R.I.C. on behalf of the federal Department of Fisheries and Oceans, Parks Canada adn the New Brunswick Department of Fisheries, encompassing the Passamaquoddy region of the Bay of Fundy. Cite this data as: Maritime Resource Management Service 1982. Passamaquoddy Fisheries Marine Pilot Study -1982. Atlantic Coastal Resource Information Centre, Amherst, NS. Published: June 2026. Coastal Ecosystems Science Division, Maritimes Region, Fisheries and Oceans Canada, Dartmouth NS.
-

Spiny dogfish (Squlaus acanthias), is a species found in Atlantic Canadian waters which is encountered mostly in commercial fisheries. Pop-up Satellite Archival Tags (PSAT) from Wildlife Computers were applied to spiny dogfish from 2008 to 2009 to collect data on depth (pressure), temperature and ambient light level (for position estimation). Deployments were conducted in Canada on commercial fishing vessels from August to October. Wildlife Computers PSAT Mk10 (N=6) were used and 3 of 6 tags reported. One tag was found washed up on shore and was returned. The spiny dogfish tagged ranged in size from 80 cm to 96 cm Fork Length (curved); all 6 were female. Time at liberty ranged from 75 – 234 days and the 43 tags that reported remained on the sharks for the programmed duration. Raw data transmitted from the PSAT’s after release was processed through Wildlife Computers software (GPE3) to get summary files, assuming a maximum swimming speed of 2m/s, NOAA OI SST V2 High Resolution data set for SST reference and ETOPO1-Bedrock dataset for bathymetry reference. The maximum likelihood position estimates are available in .csv and .kmz format and depth and temperature profiles are also in .csv format. Other tag outputs as well as metadata from the deployments can be obtained upon request from: warren.joyce@dfo-mpo.gc.ca or heather.bowlby@dfo-mpo.gc.ca.
-

Municipal Parks are public lands set aside for recreation purposes or to protect natural and cultural environments. We are no longer updating this data. It is best suited for historical research and analysis.
-

Towfish (sidescan and video) and echo sounder surveys were utilized to examine bottom type and macrophyte cover within the area of two coastal marine finfish aquaculture sites, one in New Brunswick (Welch Cove) and one in Nova Scotia (Jordan Bay). Both towfish and echo sounder data could be used independently of one another. However, the towfish data were very useful for ground truthing echo sounder based classifications. All survey data were placed into a GIS which could be used to answer management questions such as the placement of cages at sites, benthic impacts and baseline conditions to determine long term changes. Cite this data as: Vandermeulen H. Data of: Exploratory Video-Sidescan and Echosounder Survey of Jordan Bay. Published: March 2019. Coastal Ecosystems Science Division, Fisheries and Oceans Canada, Dartmouth, N.S. https://open.canada.ca/data/en/dataset/752d277f-8b3e-40c7-b99d-cfa67e69d975
-
The National Ecological Framework for Canada's "Land Cover by Ecodistrict” dataset provides land cover information within the ecodistrict framework polygon. It provides landcover codes and their English and French language description as well as information about the percentage of the polygon that the component occupies.
-

Data set covers metrics and metadata related to wild collected copepods Calanus spp. (C. hyperboreus, C. glacialis, C. finmarchicus) and Metridia longa: - body size in prosome length [PL] - dry weight [DW] - lipid content (oil sac area [OSA] and oil sac volume [OSV]) Spatial coverage: North Atlantic sampling sites - Scotian Shelf (SS) - Gulf of Saint Lawrence (GSL) - Gulf of Maine-Georges Bank-Nantucket Shoals (GoM) - Newfoundland shelf (NFL) Cite this data as: Helenius LK, Head EJH, Jekielek P, Orphanides CD, Pepin P, Plourde S, Ringuette M, Walsh HJ, Runge JA, Johnson CL. Calanus spp. size and lipid content metrics in North Atlantic, 1977-2019. Published September 2022. Ocean Ecosystem Science Division, Fisheries and Oceans Canada, Dartmouth, N.S. https://open.canada.ca/data/en/dataset/72e6d3a1-06e7-4f41-acec-e0f1474b555b
-
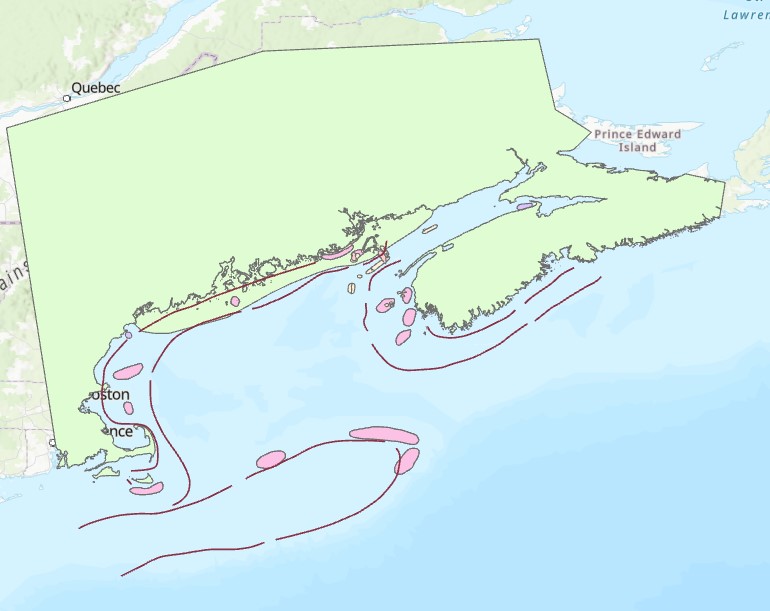
This data record contains four digitized maps recreated from an original report entitled An Ecological Sketch of Some Fundy Fisheries published by the Conservation Council of New Brunswick. The selected maps summaries information obtained from active and retired fishermen, combined with a survey of the scientific and historical information. They illustrate knowledge on spawning, migration, and nursery grounds for herring and other fisheries for Grand Manan, Bay of Fundy, and Gulf of Maine. Cite this data as: Coon, D. 1999. An Ecological Sketch of Some Fundy Fisheries. Conservation Council of New Brunswick, Fredericton, NB. 32 pp. Published: June 2026. Coastal Ecosystems Science Division, Maritimes Region, Fisheries and Oceans Canada, Dartmouth NS https://open.canada.ca/data/en/dataset/d09eee14-4786-4787-a596-9ddec1ad9342
-

The National Ecological Framework for Canada's "Surficial Geology by Ecozone” dataset contains tables that provide surficial geology information with the ecozone framework polygons. It provides codes that characterize surficial geology (unconsolidated geologic materials) and their English and French-language descriptions as well as information about the area and percentage of the polygon that the material occupies.