 Arctic SDI catalogue
Territories - Northwest Territories (NT)
Type of resources
Available actions
Topics
Keywords
Contact for the resource
Provided by
Formats
Representation types
Update frequencies
status
-
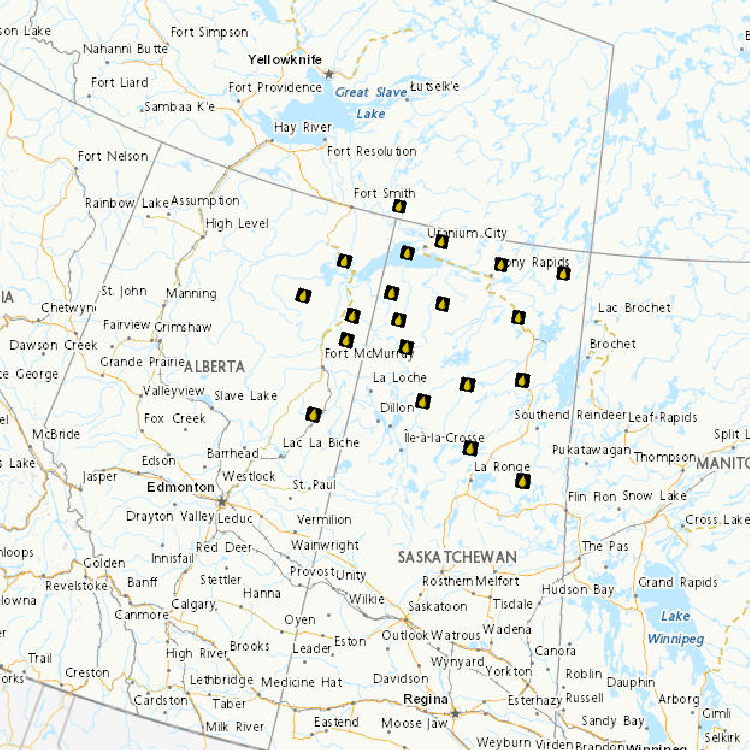
Acid-Sensitive Lakes Nine hundred and thirty-three lakes located in Saskatchewan, Alberta and the Northwest Territories were sampled to establish current acidification status. Of the 933 lakes, 244 (or 26%) are considered acid sensitive, almost always because of naturally low calcium and magnesium (or "base cation") concentrations. The most acid-sensitive lakes (i.e., those with extremely low base cation concentrations) are located on the Canadian Shield in both Alberta and Saskatchewan and east of the oils sands development area. Fifty-one of the 244 acid-sensitive lakes were sampled twice annually (spring and fall) to identify chemical changes through trend analyses. Results revealed that 55% of these lakes had concentrations of some metals in excess of Canadian Council of Ministers of the Environment guidelines. Of the 291 samples taken in the 51 lakes, iron concentrations were greater than guidelines in 36% (105 samples), aluminum in 33% (97 samples), lead in 0.3% (1 sample) and copper in 0.3% (1 sample). The metals in these lakes occur naturally and are expected to be found in a wide range of concentrations given the geology and physiography of the Canadian Shield. It remains to establish the relationship between acid sensitivity, geology and high metal concentrations.
-
Assess the importance of atmospheric deposition of contaminants as a contributor to ecological impacts of oil sands development and identify sources. • Use snowpack measurements sampled across a gridwork to develop maps of winter-time atmospheric contaminant loadings for the region ~100 km from the major upgrading facilities • Assess long-term trends in winter-time atmospheric deposition • Determine the potential impact of wintertime snowpack mercury loads on tributary river water mercury concentrations (Spring Freshet) using Geographic Information System and hydrological modelling approaches • Compare snowpack loadings to those obtained from precipitation monitoring and compare spatial patterns to PAC air measurements obtained from passive sampling network All data are subjects of a publication containing method details, full QA/QC, interpretations and conclusions. Citations: A. Dastoor, A. Ryjkov, G. Kos, J. Zhang, J.L. Kirk, M. Parsons, A. Steffen. 2021. Impact of Athabasca oil sands operations on mercury levels in air and deposition. Atmospheric Chemistry and Physics 21, 12783-12807. L. Chibwe, D.C.G. Muir, Y. Gopalapillai, D. Shang, F. Yang, J.L. Kirk, C. Manzano, B. Atkinson, X. Wang, C. Teixeira. 2021. Long-term spatial and temporal trends, and source apportionment of polycyclic aromatic compounds in the Athabasca Oil Sands Region. Environmental Pollution 268A, 115351. J. Culp, I. Droppo, P. di Cenzo, A. Alexander-Trusiak, D. Baird, S. Beltaos, G. Bickerton, B. Bonsal, R. Brua, P. Chambers, Y. Dibike, N. Glozier, J.L. Kirk, L. Levesque, M. McMaster, D.C.G. Muir, J. Parrott, D. Peters, K. Pippy, J. Roy. 2021. Ecological effects and causal synthesis of oil sands activity impacts on river ecosystems: water synthesis review. Environmental Reviews 29. Doi: https://doi.org/10.1139/er-2020-0082. Y. Gopalapillai, J. L. Kirk, M.S. Landis, D.C.G. Muir, C.A. Cooke, C.A., A. Gleason, A. Ho, E. Kelly, D. Schindler, X. Wang, G. Lawson. 2019. Source analysis of pollutant elements in winter air deposition in the Athabasca oil sands region: A Temporal and Spatial Study. ACS Earth and Space Chemistry 38, 1656-1668. W. Wasiuta, J.L. Kirk, P.A. Chambers, A.C. Alexander, F.R. Wyatt, R.C. Rooney, C.A. Cooke. 2019. Accumulating mercury and methylmercury burdens in watersheds impacted by oil sands pollution. Environmental Science & Technology 53, 12856-12864. C. Manzano, D. Muir, J. L. Kirk, C. Teixeira, M. Siu, X. Wang, J.P. Charland, D. Schindler, E. Kelly. 2016. Temporal variation in the deposition of polycyclic aromatic compounds in snow in the Athabasca Oil Sands area of Alberta. Environmental Monitoring and Assessment 188, 542. and J.L. Kirk, D. Muir, A. Gleason, X, Wang, R. Frank, I. Lehnherr, F. Wrona. 2014. Atmospheric deposition of mercury and methyl mercury to landscapes and waterbodies of the Athabasca oil sands region. Environmental Science & Technology 48, 73747383.
-
Multi-model ensembles for a suite of variables based on projections from Coupled Model Intercomparison Project Phase 6 (CMIP6) global climate models (GCMs) are available for 1850-2100 on a common 1x1 degree global grid. Climate projections vary across GCMs due to differences in the representation and approximation of earth systems and processes, and natural variability and uncertainty regarding future climate drivers. Thus, there is no single best climate model. Rather, using results from an ensemble of models (e.g., taking the average) is best practice, as an ensemble takes model uncertainty into account and provides more reliable climate projections. Provided on Canadian Climate Data and Scenarios (CCDS) are four types of products based on the CMIP6 multi-model ensembles: time series datasets and plots, maps and associated datasets, tabular datasets, and global gridded datasets. Monthly, seasonal, and annual ensembles are available for up to six Shared Socioeconomic Pathways (SSPs) (SSP1-1.9, SSP1-2.6, SSP2-4.5, SSP3-7.0, SSP4-6.0, and SSP5-8.5), four future periods (near-term (2021-2040), mid-term (2041-2060 and 2061-2080), end of century (2081-2100)), and up to five percentiles (5th, 25th, 50th (median), 75th, and 95th) of the CMIP6 ensemble distribution. The number of models in each ensemble differs according to model availability for each SSP and variable, see the model list resource for details on the models included in each ensemble. The majority of products show projected changes expressed as anomalies according to a historical reference period of 1995-2014. The products provided include global, national, and provincial/territorial datasets and graphics. For more information on the CMIP6 multi-model ensembles, see the technical documentation resource.
-
Arctic Program for Regional and International Shorebird Monitoring (Arctic PRISM) Tier 1 survey data
The Program for Regional and International Monitoring (PRISM) was designed by biologists and researchers from the Canadian and United States Governments (Canadian Wildlife Service, U.S. Geological Survey and U.S. Fish and Wildlife Service) to address concerns about shorebird population declines first noted on migration surveys. To set population targets and understand the conservation and management concerns needed to conserve and recover shorebird populations we needed to first know how many shorebirds are actually present. Previous to Arctic PRISM, population size estimates for non-harvested species came from expert opinion supported by migration counts, where birds are dispersed widely and length of stay issues made converting counts to population size difficult, or from localized or aerial surveys on the non-breeding grounds where again, only a subset of the widely-dispersed, and continuously moving on a large-scale, birds could be surveyed. Next, we needed to know population trends, and their severity. To address these crucial information gaps, PRISM consists of four survey components: (1) Arctic breeding, (2) Migration, (3) Neotropical and (4) Tropical surveys. Although all four survey components have been initiated, the Arctic breeding survey component -- Arctic PRISM -- is the furthest into the design and implementation. The goals of the broader PRISM are to: 1. Estimate population size. 2. Monitor trends in population size. 3. Monitor shorebirds at stopover locations. 4. Determine distribution, abundance, and habitats utilized throughout the year. 5. Assist local managers in meeting shorebird conservation goals. Arctic PRISM is designed to address all of the broader PRISM goals except Goal 3. Arctic PRISM is comprised of three Tiers. Tier 1 is North American arctic-wide surveys conducted at a large number of sites to get statistically rigorous (unbiased), survey-based, species-specific population estimates for Arctic-breeding shorebirds (PRISM Goal 1). These surveys are referred to as the ‘rapid surveys’ as the methodology is to visit a plot (relatively) quickly and infrequently and cover a large survey study area (PRISM Goal 4). The Tier 1 surveys are conducted in Rounds to calculate population trends (PRISM Goal 2) and changes in distribution over time (PRISM Goal 4). There is a U.S. Fish and Wildlife Service and US Geological Survey mirror to these surveys covering the Alaskan portion of the North American arctic. Tier 2 is ‘intensive surveys’ at a smaller number of non-random sites located in areas with known concentrations of shorebirds. The repeated, in-depth data collected at these long-term study sites provides annual information on the breeding biology of shorebirds that cannot be captured during the Tier 1 surveys, and provides a shorter-term assessment of site-specific population trends (PRISM Goal 2). At these sites are also where we monitor shorebird demographics and investigate potential causes of population declines. Tier 3 uses the Northwest Territories-Nunavut Bird Checklist Program (now with eBird) to non-systematically track changes in shorebird abundance and distribution across the Canadian Arctic (PRISM Goal 4). All three Tiers of Arctic PRISM are being used to inform conservation management (PRISM Goal 5) through use of the data in environmental assessment, species at risk (assessment, critical habitat), and protected areas (designation, monitoring) processes. While Arctic PRISM was originally designed with shorebirds in mind, early in the implementation we discovered the methodology would result in population size and trend estimates for nearly all of the non-colonial arctic-breeding birds. This dataset is contains the bird and habitat data collected as part of Arctic PRISM using the rapid survey methodology (and adjacent methodologies: non-systematic area search methodology and spaghetti transects methodology; primarily as part of Arctic PRISM Tier1) in the Canadian arctic (Yukon, Northwest Territories, Nunavut, Nunavik) from 1994 to the annotated data release cut-off. TIER1: RAPID SURVEY, NON-SYSTEMATIC AREA SEARCH AND SPAGHETTI TRANSECT METHODOLOGY We divided the Canadian arctic into strata comprised of region, subregion and GIS-derived habitat type. Within each stratum, a random sample of all available plots was selected to be surveyed (rapid surveys (methodology) of rapid plots (plot type). Plots were typically 300m x 400m or 400m x 400min size. Plots were surveyed during courtship through early incubation by observers walking systematically through the plot quickly on foot and recording all species present, and also completing an assessment of the habitat from a ground perspective. Similar survey methodologies (‘non-systematic area search’ (methodology) and ‘spaghetti transect’ (methodology)) were conducted in a less systematic method than the standard rapid survey (methodology) on plots of various sizes, typically reconnaissance plots (plot type) to help inform future rapid surveys (methodology) of rapid plots (plot type). Rapid surveys (methodology) were also done on intensive plots (plot type). These intensive plots (plot type) are non-randomly selected where birds are known to be breeding, and to capture a variety of species. Intensive surveys (method) of intensive plots (plot type), and other associated methodologies related to Arctic PRISM Tier 2, are not included in this dataset. For the detailed methodology used in Arctic PRISM, see Smith et al. 2025 or Bart and Johnston (eds) 2012. Smith, Paul A., Jonathan Bart, Victoria H. Johnston, Yves Aubry, Stephen C. Brown, Charles M. Francis, R. I. Guy Morrison, Lisa D. Pirie, and Jennie Rausch. 2025. Abundance and distribution of birds from comprehensive surveys of the Canadian Arctic, 1994–2018. Ornithological Applications, v. 127(4), 1-18. https://doi.org/10.1093/ornithapp/duaf050 Bart, Jonathan and Victoria H. Johnston (editors). 2012. Arctic shorebirds in North America: a decade of monitoring. Studies in Avian Biology Monograph Series No. 44, University of California Press, Berkeley, CA. 302pp. https://www.ucpress.edu/books/arctic-shorebirds-in-north-america/ These data were exported from the Arctic PRISM database on 2026-02-13. More details are available in the metadata document for download. CWS-North DatasetID: 007_1