 Arctic SDI catalogue
environment
Type of resources
Available actions
Topics
Keywords
Contact for the resource
Provided by
Years
Formats
Representation types
Update frequencies
status
Scale
Resolution
-

Corine Land Cover (CLC) 2012 and CLC change 2006-2012 are two of the datasets produced within the frame of the Initial Operations of the Copernicus programme (the European Earth monitoring programme previously known as GMES) on land monitoring.Corine Land Cover (CLC) provides consistent information on land cover and land cover changes across Europe. This inventory was initiated in 1985 (reference year 1990) and established a time series of land cover information with updates in 2000, 2006 and 2012 being the last one. CLC products are based on photointerpretation of satellite images by national teams of participating countries - the EEA member and cooperating countries – following a standard methodology and nomenclature with the following base parameters: 44 classes in the hierarchical three level Corine nomenclature; minimum mapping unit (MMU) for status layers is 25 hectares; minimum width of linear elements is 100 metres; minimum mapping unit (MMU) for Land Cover Changes (LCC) for the change layers is 5 hectares. The resulting national land cover inventories are further integrated into a seamless land cover map of Europe. Land cover and land use (LCLU) information is important not only for land change research, but also more broadly for the monitoring of environmental change, policy support, the creation of environmental indicators and reporting. CLC datasets provide important datasets supporting the implementation of key priority areas of the Environment Action Programmes of the European Union as protecting ecosystems, halting the loss of biological diversity, tracking the impacts of climate change, assessing developments in agriculture and implementing the EU Water Framework Directive, among others.More about the Corine Land Cover (CLC) and Copernicus land monitoring data in general can be found at http://land.copernicus.eu/.
-

The Corine Land Cover datasets CLC2000, CLC2006and CLC change 2000-2006areproduced within the frame of the GMES land monitoringproject.Corine Land Cover (CLC) provides consistent information on land cover and land cover changes across Europe. This inventory was initiated in 1985 (reference year 1990) and established a time series of land cover information with updates in 2000 and 2006.CLC products are based on photointerpretation of satellite images by national teams of participating countries - the EEA member and cooperating countries – following a standard methodology and nomenclature with the following base parameters: 44 classes in the hierarchical three level Corine nomenclature; minimum mapping unit (MMU) for status layers is 25 hectares; minimum width of linear elements is 100 metres; minimum mapping unit (MMU) for Land Cover Changes (LCC) for the change layers is 5 hectares. The resulting national land cover inventories are further integrated into a seamless land cover map of Europe.Land cover and land use (LCLU) information is important not only for land change research, but also more broadly for the monitoring of environmental change, policy support, the creation of environmental indicators and reporting. CLC datasets provide important datasets supporting the implementation of key priority areas of the Environment Action Programmes of the European Union as protecting ecosystems, halting the loss of biological diversity, tracking the impacts of climate change, assessing developments in agriculture and implementing the EU Water Framework Directive, among others.More about the Corine Land Cover (CLC) and Copernicus land monitoring data in general can be found at http://land.copernicus.eu/.
-
Land Cover (LC) is one of 12 themes in the European Location Project (ELF). The purpose of ELF is to create harmonised cross-border, cross-theme, and cross-resolution pan-European reference data from national contributions. The goal is to provide INSPIRE-compliant data for Europe. A description of ELF (European Location Project) is here: http://www.elfproject.eu/content/overview. Encoding: INSPIRE version 4
-

ELF Protected Sites (PS) is one of 12 themes in the European Location Project (ELF). The purpose of ELF is to create harmonised cross-border, cross-theme and cross-resolution pan-European reference data from national contributions. The goal is to provide INSPIRE-compliant data for Europe. A description of the ELF (European Location Project) is here: http://www.elfproject.eu/content/overview. Encoding: INSPIRE version 4
-
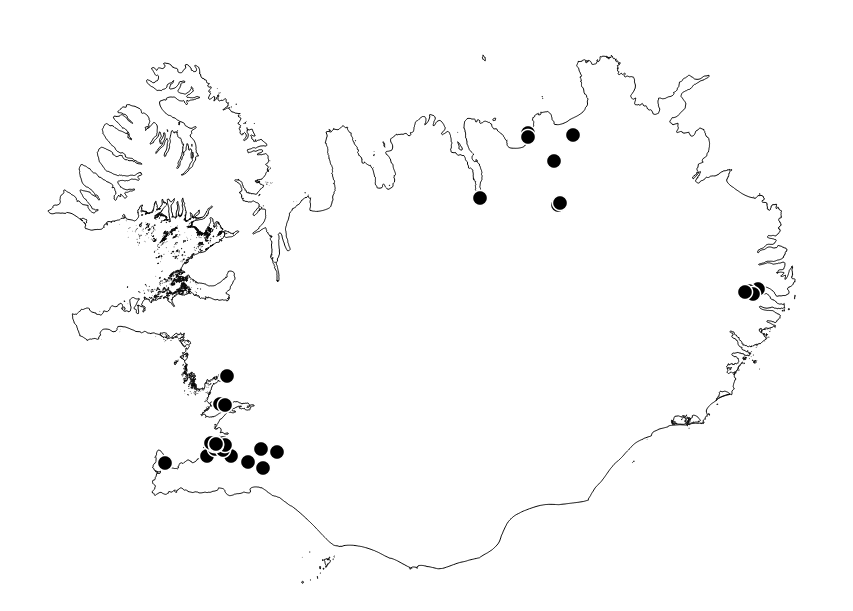
Staðsetningar loftmælistöðva á Íslandi. Umhverfisstofnun skilar árlega loftgæðaskýrslum til Evrópsku umhverfisstofnunarinnar (EEA) og uppfylla þau gögn INSPIRE-tilskipanir varðandi flokkun stöðva. Rekstraraðilar geta breytt gögnum stöðva.
-
Gagnasett sem sýnir yfirlitsupplýsingar um helstu svæði þar sem landgræðsla er stunduð og Land og skógur kemur að á einn eða annan hátt. Undanskilin eru þó svæði í verkefninu Bændur græða landið.
-

The Corine Land Cover datasets CLC2000, CLC2006 and CLC change 2000-2006 areproduced within the frame of the GMES land monitoring project. Corine Land Cover (CLC) provides consistent information on land cover and land cover changes across Europe. This inventory was initiated in 1985 (reference year 1990) and established a time series of land cover information with updates in 2000 and 2006.CLC products are based on photointerpretation of satellite images by national teams of participating countries - the EEA member and cooperating countries – following a standard methodology and nomenclature with the following base parameters: 44 classes in the hierarchical three level Corine nomenclature; minimum mapping unit (MMU) for status layers is 25 hectares; minimum width of linear elements is 100 metres; minimum mapping unit (MMU) for Land Cover Changes (LCC) for the change layers is 5 hectares. The resulting national land cover inventories are further integrated into a seamless land cover map of Europe.Land cover and land use (LCLU) information is important not only for land change research, but also more broadly for the monitoring of environmental change, policy support, the creation of environmental indicators and reporting. CLC datasets provide important datasets supporting the implementation of key priority areas of the Environment Action Programmes of the European Union as protecting ecosystems, halting the loss of biological diversity, tracking the impacts of climate change, assessing developments in agriculture and implementing the EU Water Framework Directive, among others.More about the Corine Land Cover (CLC) and Copernicus land monitoring data in general can be found at http://land.copernicus.eu/.
-

The Corine Land Cover datasets CLC2000, CLC2006and CLC change 2000-2006 are produced within the frame of the GMES land monitoringproject.Corine Land Cover (CLC) provides consistent information on land cover and land cover changes across Europe. This inventory was initiated in 1985 (reference year 1990) and established a time series of land cover information with updates in 2000 and 2006.CLC products are based on photointerpretation of satellite images by national teams of participating countries - the EEA member and cooperating countries – following a standard methodology and nomenclature with the following base parameters: 44 classes in the hierarchical three level Corine nomenclature; minimum mapping unit (MMU) for status layers is 25 hectares; minimum width of linear elements is 100 metres; minimum mapping unit (MMU) for Land Cover Changes (LCC) for the change layers is 5 hectares. The resulting national land cover inventories are further integrated into a seamless land cover map of Europe.Land cover and land use (LCLU) information is important not only for land change research, but also more broadly for the monitoring of environmental change, policy support, the creation of environmental indicators and reporting. CLC datasets provide important datasets supporting the implementation of key priority areas of the Environment Action Programmes of the European Union as protecting ecosystems, halting the loss of biological diversity, tracking the impacts of climate change, assessing developments in agriculture and implementing the EU Water Framework Directive, among others.More about the Corine Land Cover (CLC) and Copernicus land monitoring data in general can be found at http://land.copernicus.eu/.
-

Long-term tenure map (managed forest code 11) used in the Forest Management in Canada, 2020 story map. Long-term tenure map (managed forest code 11) with lands having more than five years volume- or area-based tenure or effectively having the equivalent, such as consistently recurrent commercial forest tenure with associated forest management activity. The Long-term tenure map is used in the Story Map of Forest Management in Canada, 2020 (Aménagement des forêts au Canada, 2020) and includes the following tiled layer:Tile Layer of Long-Term Tenure Managed Forest Code 11: 2020
-

The mountain pine beetle (Dendroctonus ponderosae Hopkins, MPB) is native to western Canada. It attacks all pine including lodgepole, limber, whitebark and jack pine. Over the past 40 years the range of mountain pine beetle has expanded, possibly due to changes in the area of climatically suitable habitat. Known Limitations: The areas surveyed each year can be different and therefore year over year comparisons may be difficult. the surveyors do not do ground truthing for all disturbances identified, therefore it is not guaranteed that all of the disturbances are caused by MPB. the surveyors do not necessarily map tree patches less than three red trees and therefore the dataset may not include all MPB killed trees. 'grey' attacked trees are not captured. the surveyors attempt to distinguish between 'new' faders and 'old' faders but the accuracy of this distinction is not guaranteed and therefore the data may reflect several years and several generations of MPB attack. Beetle year is August 15 of current year - August 14 of following year. This dataset contains data from 2011 to the most current data received. Data from 2010 and earlier is available as a separate dataset.