 Arctic SDI catalogue
Department of Marine Systems at Tallinn University of Technology
Type of resources
Available actions
Topics
Keywords
Contact for the resource
Provided by
Years
Formats
Resolution
-
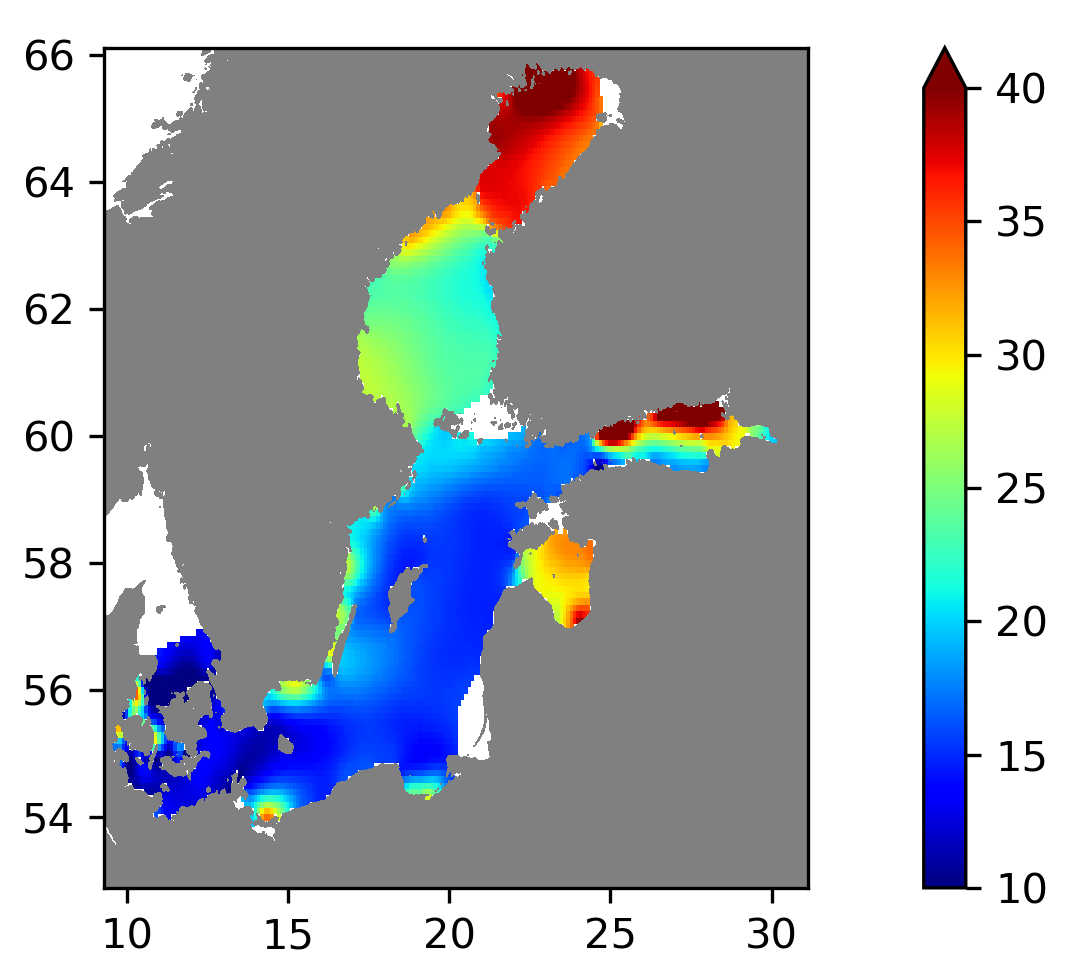
Running 6-year analysis of Water body silicate in the Baltic Sea. Four seasons (March-May, June-August, September-November, December-February). Every year of the time dimension corresponds to a 6-year centred average. Periods span between 1965-2021. Analyses for depths (m) (HELCOM standard depths): 0, 5, 10, 15, 20, 30, 40, 50, 60, 70, 80, 90, 100, 125, 150, 175, 200, 225, 250, 275, 300. Data Sources: observational data from SeaDataNet/EMODnet Chemistry Data Network. Description of DIVA analysis: Geostatistical data analysis by DIVAnd (Data-Interpolating Variational Analysis in n dimensions) tool. GEBCO_08 Grid (30 arc-seconds) topography is used for the contouring preparation. Files contain analysed fields, error fields and combined field with the deepest value for each grid point selected. Also pre-masked fields using relative error threshold 0.3 and 0.5 are included. In the analyses the horizontal correlation length is fixed to 80 km and decreasing towards the coastline, the vertical correlation length is varying with depth. Signal to noise ratio is fixed to 1.0. Background fields were created using data for the given time period and season. Log transformation was used in the analyses. No detrending, advection constraints or weighting are applied. Unit is umol/l.
-
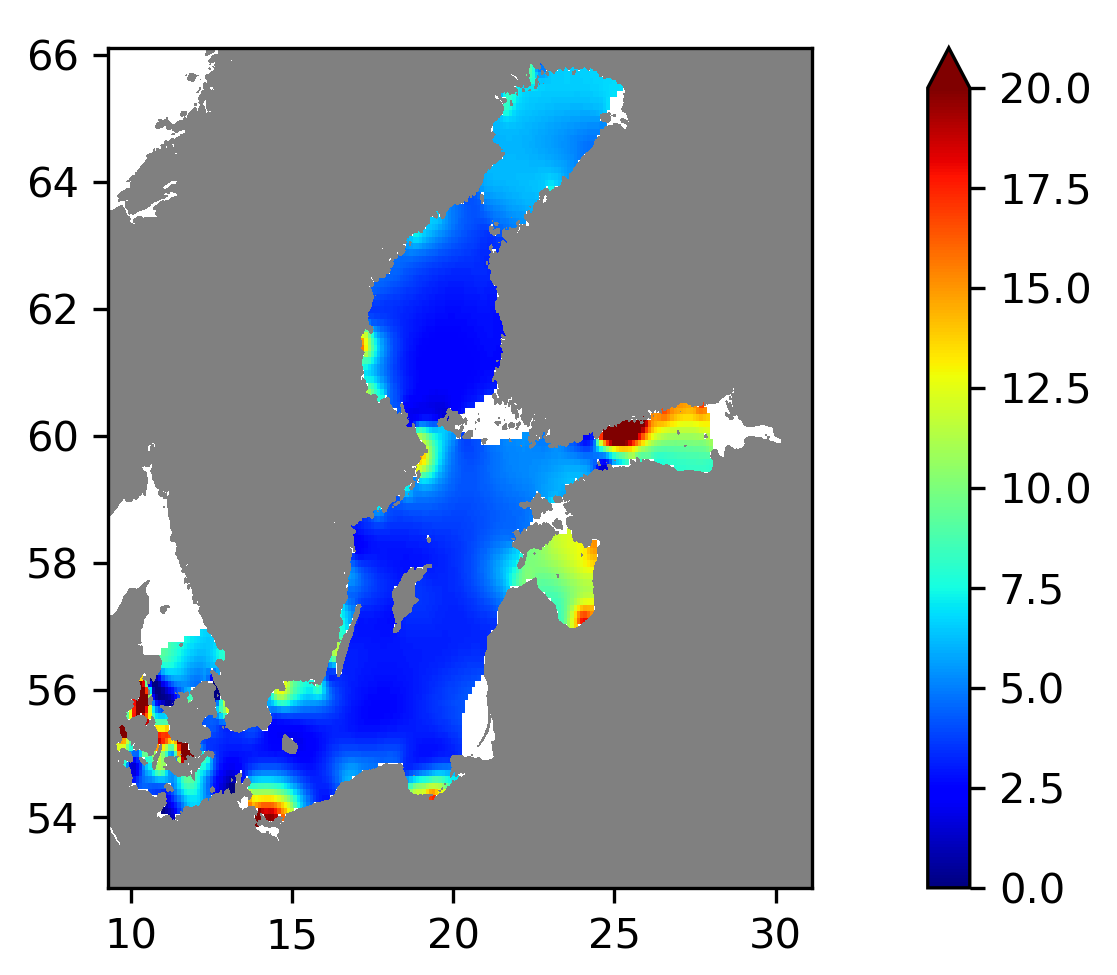
Running 6-year analysis of Water body dissolved inorganic nitrogen in the Baltic Sea. Four seasons (March-May, June-August, September-November, December-February). Every year of the time dimension corresponds to a 6-year centred average. Periods span between 1975-2021. Analyses for depths (m) (HELCOM standard depths): 0, 5, 10, 15, 20, 30, 40, 50, 60, 70, 80, 90, 100, 125, 150, 175, 200, 225, 250, 275, 300. Data Sources: observational data from SeaDataNet/EMODnet Chemistry Data Network. Description of DIVA analysis: Geostatistical data analysis by DIVAnd (Data-Interpolating Variational Analysis in n dimensions) tool. GEBCO_08 Grid (30 arc-seconds) topography is used for the contouring preparation. Files contain analysed fields, error fields and combined field with the deepest value for each grid point selected. Also pre-masked fields using relative error threshold 0.3 and 0.5 are included. In the analyses the horizontal correlation length is fixed to 80 km and decreasing towards the coastline, the vertical correlation length is varying with depth. Signal to noise ratio is fixed to 1.0. Background fields were created using data for the given time period and season. Log transformation was used in the analyses. No detrending, advection constraints or weighting are applied. Unit is umol/l.
-
Moving 6-year analysis of Water body dissolved inorganic nitrogen (DIN) in the Baltic Sea. Four seasons (March-May, June-August, September-November, December-February). Every year of the time dimension corresponds to a 6-year centred average. Periods span between 1980-1985 and 2013-2018. Analyses for depths (m) (HELCOM standard depths): 0, 5, 10, 15, 20, 30, 40, 50, 60, 70, 80, 90, 100, 125, 150, 175, 200, 225, 250, 275, 300. Data Sources: observational data from SeaDataNet/EMODnet Chemistry Data Network. Description of DIVA analysis: Geostatistical data analysis by DIVA (Data-Interpolating Variational Analysis) tool. GEBCO Grid (30 arc-seconds) topography is used for the contouring preparation. Files contain analysed fields, error fields and combined field with the deepest value for each grid point selected. Also pre-masked fields using relative error threshold 0.3 and 0.5 are included. In the analyses the Correlation length in the horizontal direction were fixed to 80 km and in the vertical direction to 25 m. Signal to noise ratio were fixed to 1.0. Background fields were created using data for the given time period and season. Log transformation was used in the analyses. No detrending, advection constraints or weighting are applied. Unit is umol/l.
-
Moving 6-year analysis of Water body phosphate in the Baltic Sea. Four seasons (March-May, June-August, September-November, December-February). Every year of the time dimension corresponds to a 6-year centred average. Periods span between 1980-1985 and 2013-2018. Analyses for depths (m) (HELCOM standard depths): 0, 5, 10, 15, 20, 30, 40, 50, 60, 70, 80, 90, 100, 125, 150, 175, 200, 225, 250, 275, 300. Data Sources: observational data from SeaDataNet/EMODnet Chemistry Data Network. Description of DIVA analysis: Geostatistical data analysis by DIVA (Data-Interpolating Variational Analysis) tool. GEBCO Grid (30 arc-seconds) topography is used for the contouring preparation. Files contain analysed fields, error fields and combined field with the deepest value for each grid point selected. Also pre-masked fields using relative error threshold 0.3 and 0.5 are included. In the analyses the Correlation length in the horizontal direction were fixed to 80 km and in the vertical direction to 25 m. Signal to noise ratio were fixed to 1.0. Background fields were created using data for the given time period and season. Log transformation was used in the analyses. No detrending, advection constraints or weighting are applied. Unit is umol/l.
-
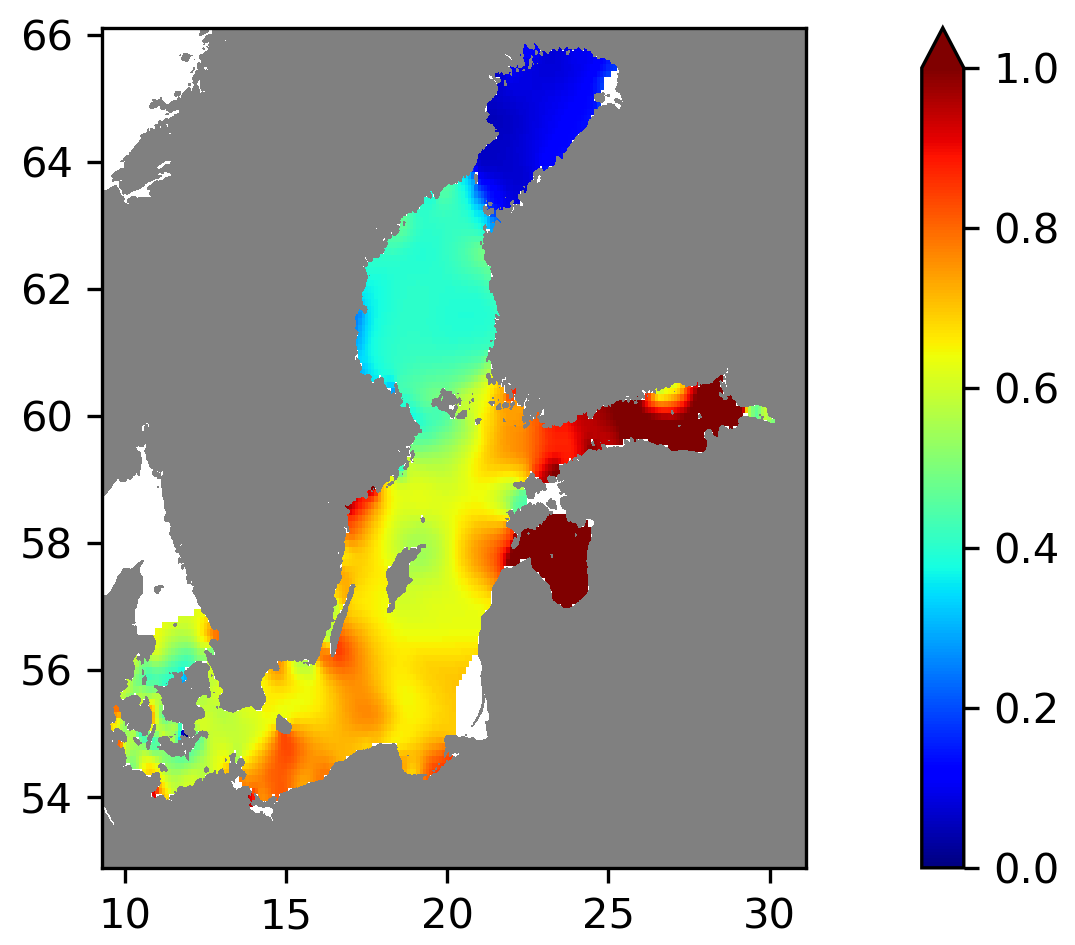
Running 6-year analysis of Water body phosphate in the Baltic Sea. Four seasons (March-May, June-August, September-November, December-February). Every year of the time dimension corresponds to a 6-year centred average. Periods span between 1975-2021. Analyses for depths (m) (HELCOM standard depths): 0, 5, 10, 15, 20, 30, 40, 50, 60, 70, 80, 90, 100, 125, 150, 175, 200, 225, 250, 275, 300. Data Sources: observational data from SeaDataNet/EMODnet Chemistry Data Network. Description of DIVA analysis: Geostatistical data analysis by DIVAnd (Data-Interpolating Variational Analysis in n dimensions) tool. GEBCO_08 Grid (30 arc-seconds) topography is used for the contouring preparation. Files contain analysed fields, error fields and combined field with the deepest value for each grid point selected. Also pre-masked fields using relative error threshold 0.3 and 0.5 are included. In the analyses the horizontal correlation length is fixed to 80 km and decreasing towards the coastline, the vertical correlation length is varying with depth. Signal to noise ratio is fixed to 1.0. Background fields were created using data for the given time period and season. Log transformation was used in the analyses. No detrending, advection constraints or weighting are applied. Unit is umol/l.
-

Running 6-year analysis of Water body silicate in the Baltic Sea. Four seasons (March-May, June-August, September-November, December-February). Every year of the time dimension corresponds to a 6-year centred average. Periods span between 1966-2023. Analyses for depths (m) (HELCOM standard depths): 0, 5, 10, 15, 20, 30, 40, 50, 60, 70, 80, 90, 100, 125, 150, 175, 200, 225, 250, 275, 300. Data Sources: observational data from SeaDataNet/EMODnet Chemistry Data Network. Description of DIVA analysis: Geostatistical data analysis by DIVAnd (Data-Interpolating Variational Analysis in n dimensions) tool. GEBCO_08 Grid (30 arc-seconds) topography is used for the contouring preparation. Files contain analysed fields, error fields and combined field with the deepest value for each grid point selected. Also pre-masked fields using relative error threshold 0.3 and 0.5 are included. In the analyses the horizontal correlation length is fixed to 80 km and decreasing towards the coastline, the vertical correlation length is varying with depth. Signal to noise ratio is fixed to 1.0. Background fields were created using data for the given time period and season. Log transformation was used in the analyses. No detrending, advection constraints or weighting are applied. Unit is umol/l.
-
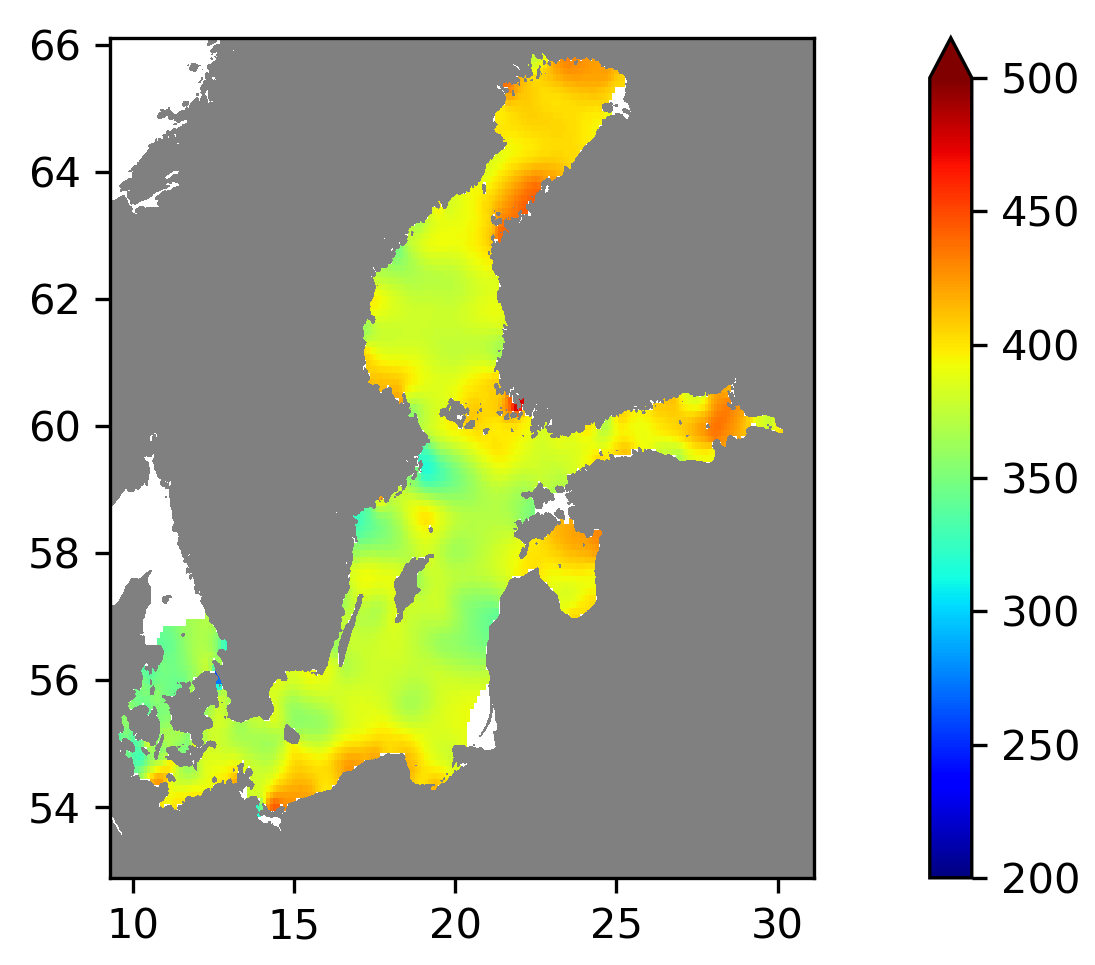
Running 6-year analysis of Water body dissolved oxygen concentration in the Baltic Sea. Four seasons (March-May, June-August, September-November, December-February). Every year of the time dimension corresponds to a 6-year centred average. Periods span between 1960-2021. Analyses for depths (m) (HELCOM standard depths): 0, 5, 10, 15, 20, 30, 40, 50, 60, 70, 80, 90, 100, 125, 150, 175, 200, 225, 250, 275, 300. Data Sources: observational data from SeaDataNet/EMODnet Chemistry Data Network. Description of DIVA analysis: Geostatistical data analysis by DIVAnd (Data-Interpolating Variational Analysis in n dimensions) tool. GEBCO_08 Grid (30 arc-seconds) topography is used for the contouring preparation. Files contain analysed fields, error fields and combined field with the deepest value for each grid point selected. Also pre-masked fields using relative error threshold 0.3 and 0.5 are included. In the analyses the horizontal correlation length is fixed to 80 km and decreasing towards the coastline, the vertical correlation length is varying with depth. Signal to noise ratio is fixed to 1.0. Background fields were created using data for the given time period and season. Log transformation was used in the analyses. No detrending, advection constraints or weighting are applied. Unit is umol/l.
-

Running 6-year analysis of Water body dissolved inorganic nitrogen in the Baltic Sea. Four seasons (March-May, June-August, September-November, December-February). Every year of the time dimension corresponds to a 6-year centred average. Periods span between 1975-2023. Analyses for depths (m) (HELCOM standard depths): 0, 5, 10, 15, 20, 30, 40, 50, 60, 70, 80, 90, 100, 125, 150, 175, 200, 225, 250, 275, 300. Data Sources: observational data from SeaDataNet/EMODnet Chemistry Data Network. Description of DIVA analysis: Geostatistical data analysis by DIVAnd (Data-Interpolating Variational Analysis in n dimensions) tool. GEBCO_08 Grid (30 arc-seconds) topography is used for the contouring preparation. Files contain analysed fields, error fields and combined field with the deepest value for each grid point selected. Also pre-masked fields using relative error threshold 0.3 and 0.5 are included. In the analyses the horizontal correlation length is fixed to 80 km and decreasing towards the coastline, the vertical correlation length is varying with depth. Signal to noise ratio is fixed to 1.0. Background fields were created using data for the given time period and season. Log transformation was used in the analyses. No detrending, advection constraints or weighting are applied. Unit is umol/l.
-

Running 6-year analysis of Water body dissolved oxygen concentration in the Baltic Sea. Four seasons (March-May, June-August, September-November, December-February). Every year of the time dimension corresponds to a 6-year centred average. Periods span between 1950-2023. Analyses for depths (m) (HELCOM standard depths): 0, 5, 10, 15, 20, 30, 40, 50, 60, 70, 80, 90, 100, 125, 150, 175, 200, 225, 250, 275, 300. Data Sources: observational data from SeaDataNet/EMODnet Chemistry Data Network. Description of DIVA analysis: Geostatistical data analysis by DIVAnd (Data-Interpolating Variational Analysis in n dimensions) tool. GEBCO_08 Grid (30 arc-seconds) topography is used for the contouring preparation. Files contain analysed fields, error fields and combined field with the deepest value for each grid point selected. Also pre-masked fields using relative error threshold 0.3 and 0.5 are included. In the analyses the horizontal correlation length is fixed to 80 km and decreasing towards the coastline, the vertical correlation length is varying with depth. Signal to noise ratio is fixed to 1.0. Background fields were created using data for the given time period and season. Log transformation was used in the analyses. No detrending, advection constraints or weighting are applied. Unit is umol/l.
-
Moving 6-year analysis of Water body silicate in the Baltic Sea. Four seasons (March-May, June-August, September-November, December-February). Every year of the time dimension corresponds to a 6-year centred average. Periods span between 1980-1985 and 2013-2018. Analyses for depths (m) (HELCOM standard depths): 0, 5, 10, 15, 20, 30, 40, 50, 60, 70, 80, 90, 100, 125, 150, 175, 200, 225, 250, 275, 300. Data Sources: observational data from SeaDataNet/EMODnet Chemistry Data Network. Description of DIVA analysis: Geostatistical data analysis by DIVA (Data-Interpolating Variational Analysis) tool. GEBCO Grid (30 arc-seconds) topography is used for the contouring preparation. Files contain analysed fields, error fields and combined field with the deepest value for each grid point selected. Also pre-masked fields using relative error threshold 0.3 and 0.5 are included. In the analyses the Correlation length in the horizontal direction were fixed to 80 km and in the vertical direction to 25 m. Signal to noise ratio were fixed to 1.0. Background fields were created using data for the given time period and season. Log transformation was used in the analyses. No detrending, advection constraints or weighting are applied. Unit is umol/l.