 Arctic SDI catalogue
2023
Type of resources
Available actions
Topics
Keywords
Contact for the resource
Provided by
Years
Formats
Representation types
Update frequencies
Service types
Scale
Resolution
-
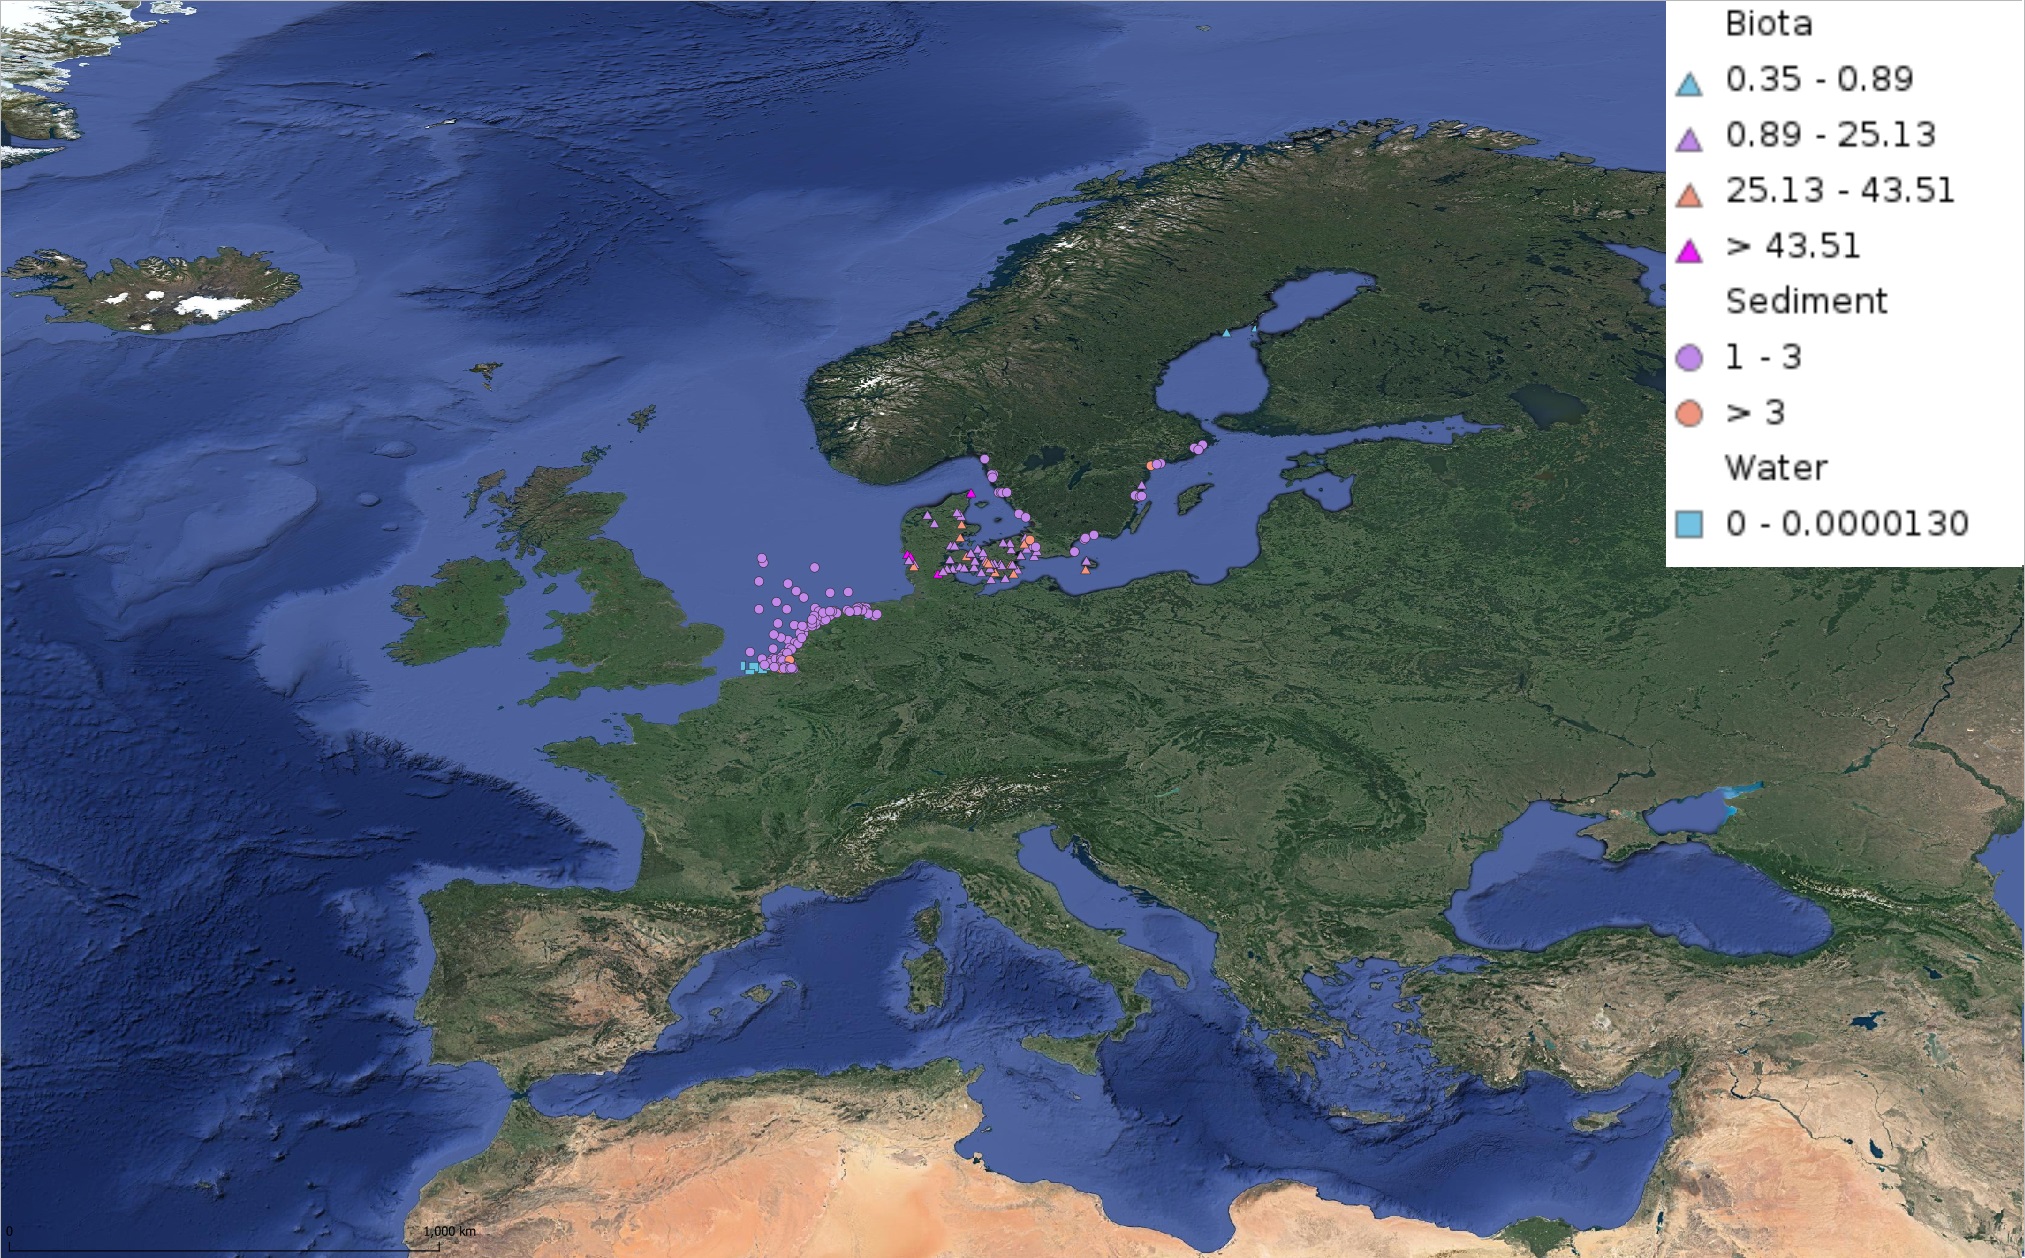
This product displays for Triphenyltin, median values of the last 6 available years that have been measured per matrix and are present in EMODnet regional contaminants aggregated datasets, v2022. The median values ranges are derived from the following percentiles: 0-25%, 25-75%, 75-90%, >90%. Only "good data" are used, namely data with Quality Flag=1, 2, 6, Q (SeaDataNet Quality Flag schema). For water, only surface values are used (0-15 m), for sediment and biota data at all depths are used.
-
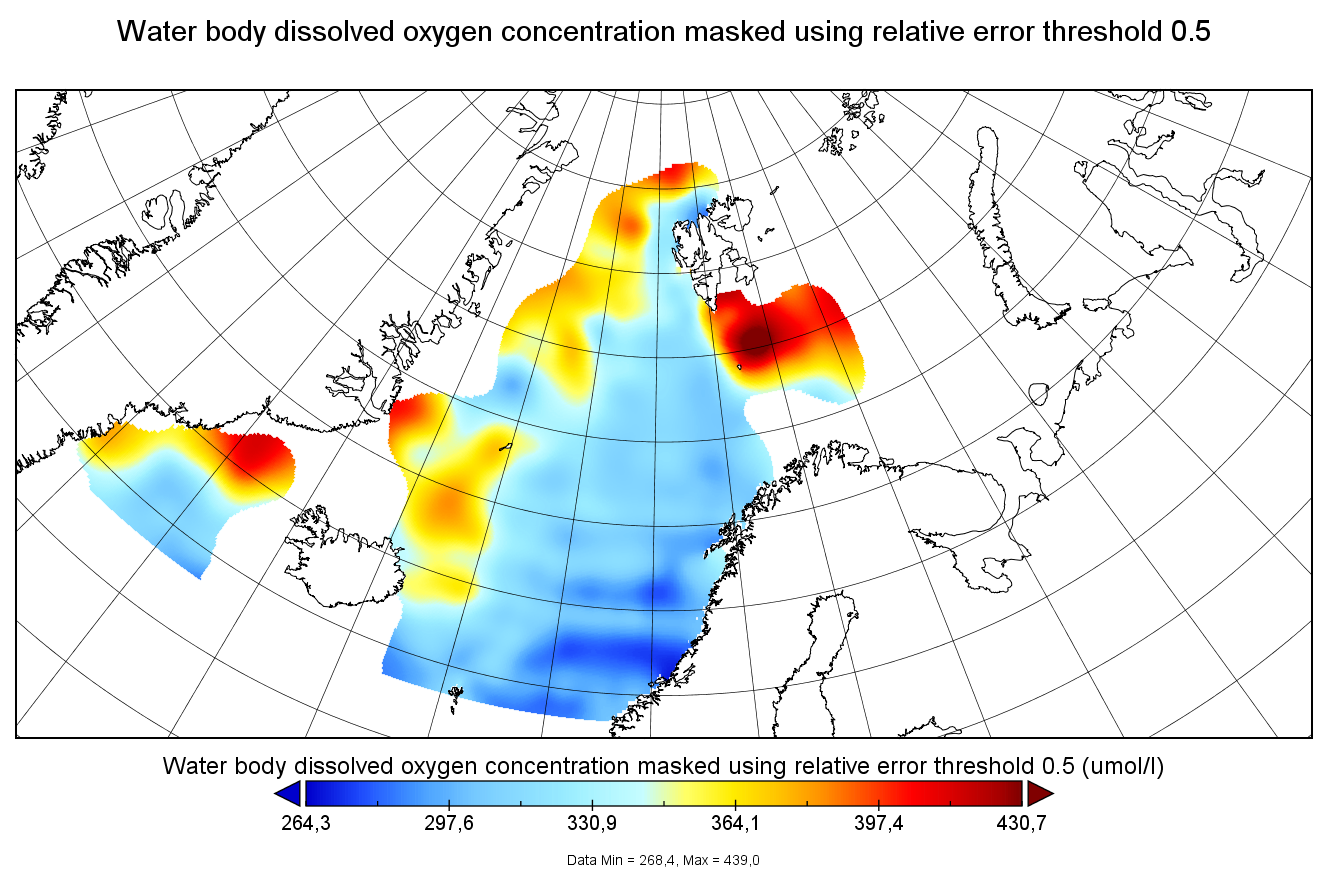
Moving 6-year analysis of dissolved oxygen concentration in the Arctic Ocean, for each season in the period 1965-2022. Every year of the time dimension corresponds to the 6-year centered average for each season. Winter: December-February, Spring: March-May, Summer: June-August, Autumn: September-November. Depth range (IODE standard depths): 0, 5, 10, 20, 30, 40, 50, 75, 100, 125, 150, 200, 250, 300, 400, ..., 1500, 1750, 2000, 2500m. Units: umol/l. Description of DIVA analysis: The computation was done with DIVAnd (Data-Interpolating Variational Analysis in n dimensions), version 2.7.9, using GEBCO 30sec topography for the spatial connectivity of water masses. The horizontal resolution of the produced DIVAnd maps grids is 0.1 degrees. Signal-to-noise ratio was fixed to 3.0, horizontal correlation length varying from 45 km near the coast to 150 km, and vertical correlation length varying between 25 and 1000 m. Logarithmic transformation is applied to the data prior to the analysis. Background field: analysis with signal-to-noise ratio = 10, horizontal correlation length 60-200 km, and vertical correlation length 25-1000 m.
-
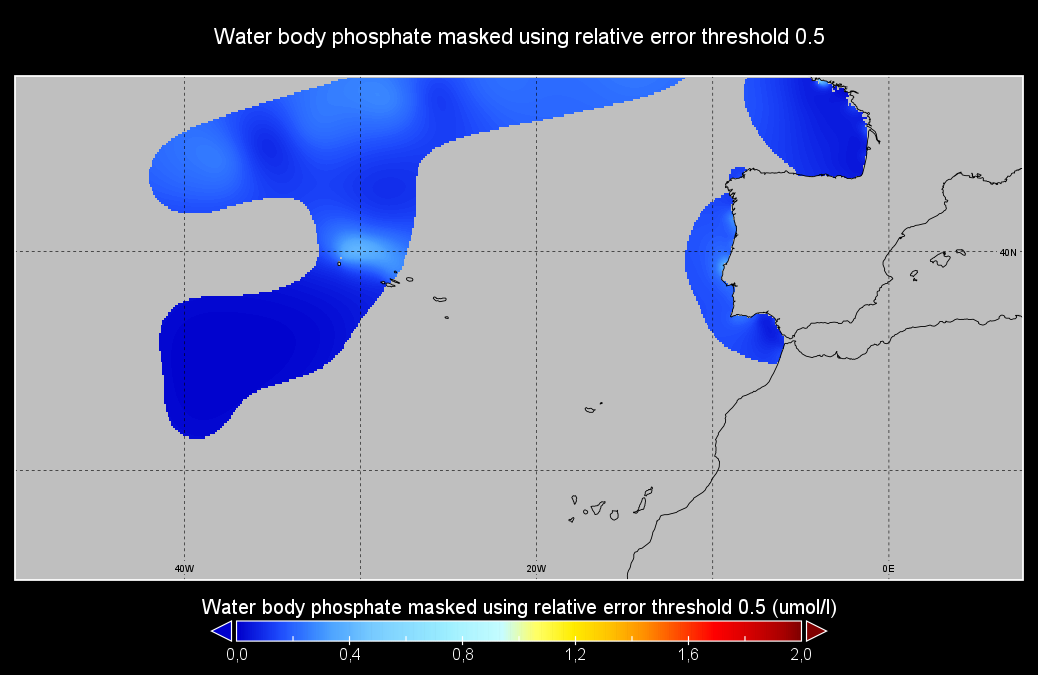
Moving 6-year analysis of Water body phosphate in the NorthEast Atlantic for each season: - winter: January-March, - spring: April-June, - summer: July-September, - autumn: October-December. Every year of the time dimension corresponds to the 6-year centred average of each season. 6-year periods span from 1950/1955 until 2016/2021. Observation data span from 1950 to 2021. Depth levels (IODE standard depths): [0.0, 5.0, 10.0, 20.0, 30.0, 40.0, 50.0, 75.0, 100.0, 125.0, 150.0, 200.0, 250.0, 300.0, 400.0, 500.0, 600.0, 700.0, 800.0, 900.0, 1000.0, 1100.0, 1200.0, 1300.0, 1400.0, 1500.0, 1750.0, 2000.0]. Data sources: observational data from SeaDataNet/EMODNet Chemistry Data Network. Descrption of DIVAnd analysis: the computation was done with DIVAnd (Data-Interpolating Variational Analysis in n dimensions), version 2.7.4, using GEBCO 30 sec topography for the spatial connectivity of water masses. The horizontal resolution of the produced DIVAnd maps is 0.1 degrees. Horizontal correlation length varies from 250km in open sea regions to 50km at the coast. Vertical correlation length is defined as twice the vertical resolution. Signal-to-noise ratio was fixed to 1 for vertical profiles and 0.1 for time series to account for the redundancy in the time series observations. A logarithmic transformation (DIVAnd.Anam.loglin) was applied to the data prior to the analysis to avoid unrealistic negative values. Background field: a vertically-filtered profile of the seasonal data mean value (including all years) is substracted from the data. Detrending of data: no, advection constraint applied: no. Units: umol/l.
-
Happywhale.com is a resource to help you know whales as individuals, and to benefit conservation science with rich data about individual whales. Supplemental information: Sightings and images were submitted to Happywhale by contributors. A portion of the Happywhale data were transferred to OBIS-SEAMAP upon the agreement between Happywhale and OBIS-SEAMAP. There may be duplicate records among Happywhale datasets and other OBIS-SEAMAP datasets. The precision of date/time vary per record. Some records have date accuracy up to year only. This dataset includes sightings and photos from the following 1 contributors in alphabetic order: Hondius
-
Happywhale.com is a resource to help you know whales as individuals, and to benefit conservation science with rich data about individual whales. Original provider: HappywhaleDataset credits: Happywhale and contributors Supplemental information: Sightings and images were submitted to Happywhale by contributors. A portion of the Happywhale data were transferred to OBIS-SEAMAP upon the agreement between Happywhale and OBIS-SEAMAP. There may be duplicate records among Happywhale datasets and other OBIS-SEAMAP datasets. The precision of date/time vary per record. Some records have date accuracy up to year only. This dataset includes sightings and photos from the following 14 contributors in alphabetic order: Adelie Xiaohang Li; Andrew Thompson; Annette Bombosch; Chris Lewis; Heidi Krajewsky; Hondius; Lauren Farmer; Marilia Olio; MS Otto Sverdrup; MS Spitsbergen; Nick Savic; Patrick Mitchell; Ronny Hogstrom; Tobias Brehm
-
Moving 6-year analysis and visualization of Water body phosphate in the North Sea. Four seasons (December-February, March-May, June-August, September-November). Data Sources: observational data from SeaDataNet/EMODnet Chemistry Data Network. Description of DIVA analysis: Geostatistical data analysis by DIVAnd (Data-Interpolating Variational Analysis) tool, version 2.7.9. results were subjected to the minfield option in DIVAnd to avoid negative/underestimated values in the interpolated results; error threshold masks L1 (0.3) and L2 (0.5) are included as well as the unmasked field. The depth dimension allows visualizing the gridded field at various depths.
-
Happywhale.com is a resource to help you know whales as individuals, and to benefit conservation science with rich data about individual whales. Original provider: Happywhale Dataset credits: Happywhale and contributors Supplemental information: Sightings and images were submitted to Happywhale by contributors. A portion of the Happywhale data were transferred to OBIS-SEAMAP upon the agreement between Happywhale and OBIS-SEAMAP. There may be duplicate records among Happywhale datasets and other OBIS-SEAMAP datasets. The precision of date/time vary per record. Some records have date accuracy up to year only. This dataset includes sightings and photos from the following 19 contributors in alphabetic order: ANGEL SOLE; Babsi Neubarth; Carola Heiner-Braun; Chiari Massimiliano; Dave Teunissen; David Desaulnier; Eric Clark; Esther van der Stappen; Jeremy Thomas; Joanna Clegg; Lynn Murray; MACHI YOSHIDA; Mark Veeken; Michel Lau; MS Fram; MV Hondius; Patricia Bally Triebold; Simon Merz; Wendy Upton
-
Happywhale.com is a resource to help you know whales as individuals, and to benefit conservation science with rich data about individual whales. Original provider: Happywhale Dataset credits: Happywhale and contributors Supplemental information: Sightings and images were submitted to Happywhale by contributors. A portion of the Happywhale data were transferred to OBIS-SEAMAP upon the agreement between Happywhale and OBIS-SEAMAP. There may be duplicate records among Happywhale datasets and other OBIS-SEAMAP datasets. The precision of date/time vary per record. Some records have date accuracy up to year only. This dataset includes sightings and photos from the following 1 contributors in alphabetic order: Tobias Brehm
-
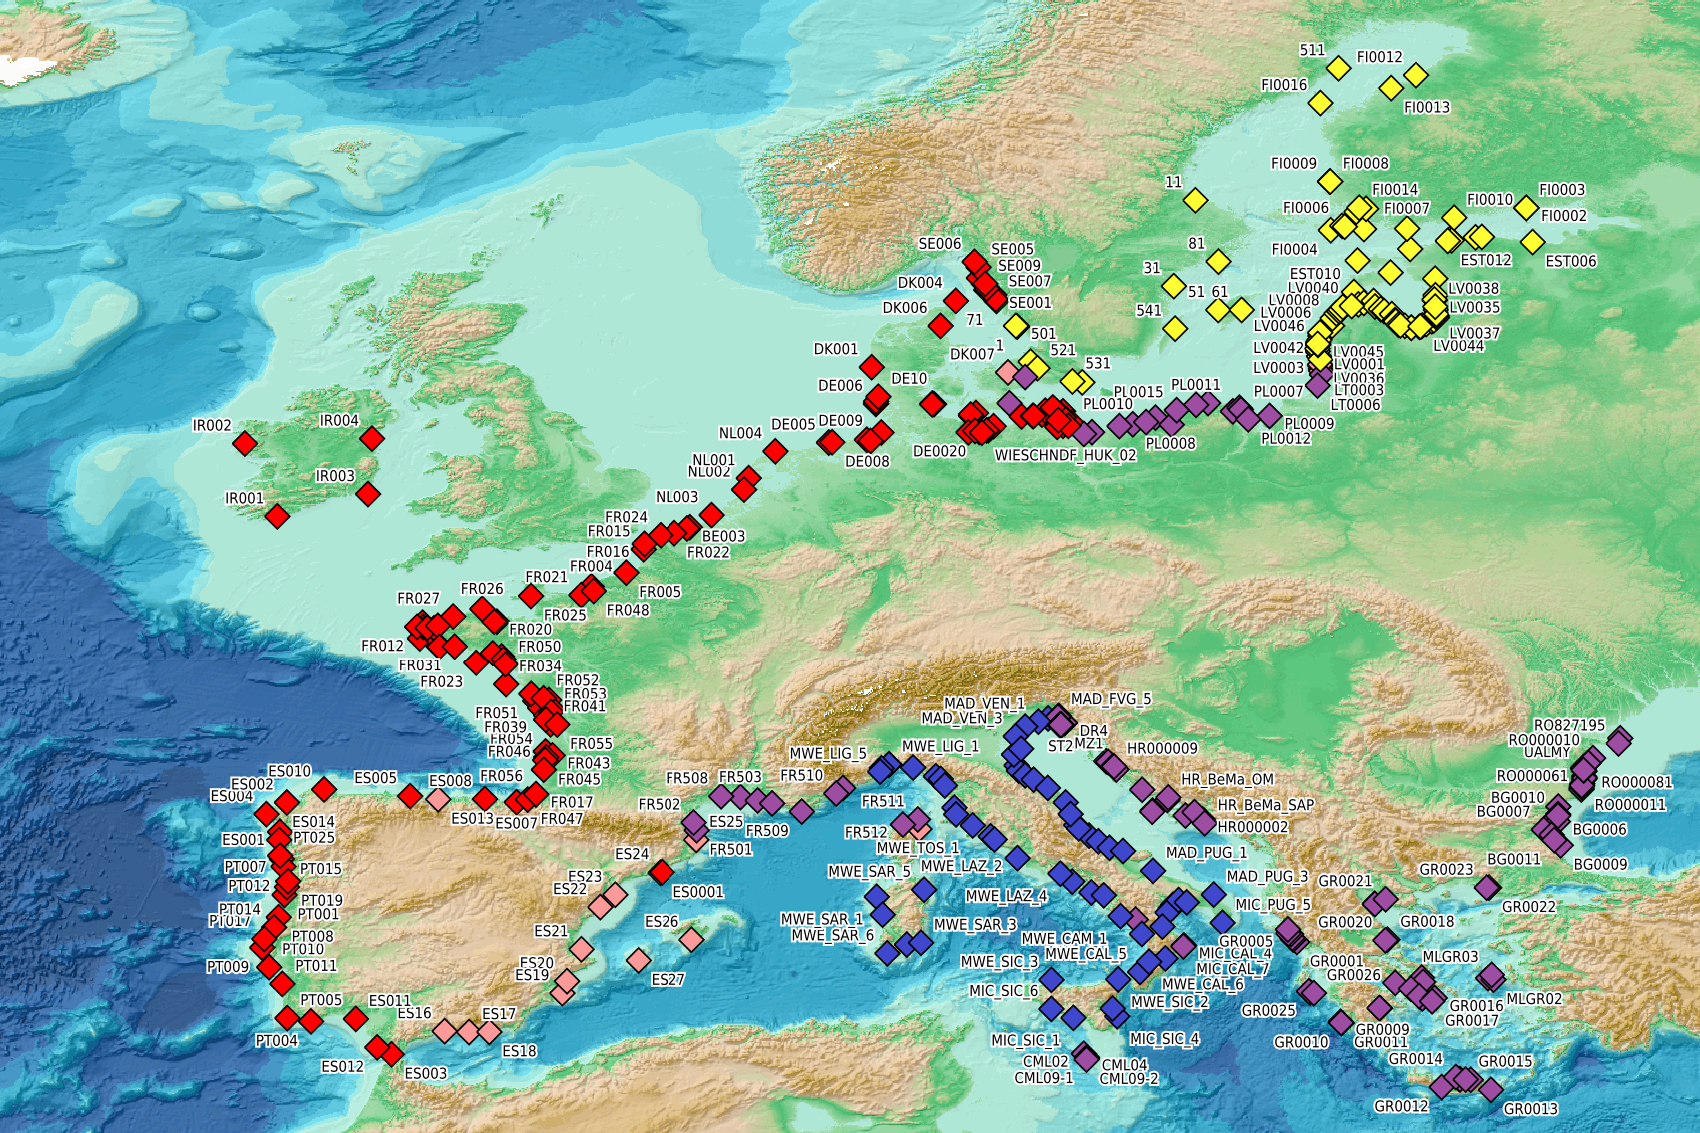
This visualization product displays beaches locations where the Marine Strategy Framework Directive (MSFD) monitoring protocol has been applied to collate data on macrolitter (> 2.5 cm). Reference lists associated with these protocols have been indicated with different colors in the map. EMODnet Chemistry included the collection of marine litter in its 3rd phase. Since the beginning of 2018, data of beach litter have been gathered and processed in the EMODnet Chemistry Marine Litter Database (MLDB). The harmonization of all the data has been the most challenging task considering the heterogeneity of the data sources, sampling protocols and reference lists used on a European scale. Preliminary processing were necessary to harmonize all the data: - Exclusion of OSPAR 1000 protocol: in order to follow the approach of OSPAR that it is not including these data anymore in the monitoring; - Selection of MSFD surveys only (exclusion of other monitoring, cleaning and research operations); - Exclusion of beaches without coordinates; - Some categories & some litter types like organic litter, small fragments (paraffin and wax; items > 2.5cm) and pollutants have been removed. The list of selected items is attached to this metadata. This list was created using EU Marine Beach Litter Baselines and EU Threshold Value for Macro Litter on Coastlines from JRC (these two documents are attached to this metadata). More information is available in the attached documents. Warning: the absence of data on the map doesn't necessarily mean that they don't exist, but that no information has been entered in the Marine Litter Database for this area.
-
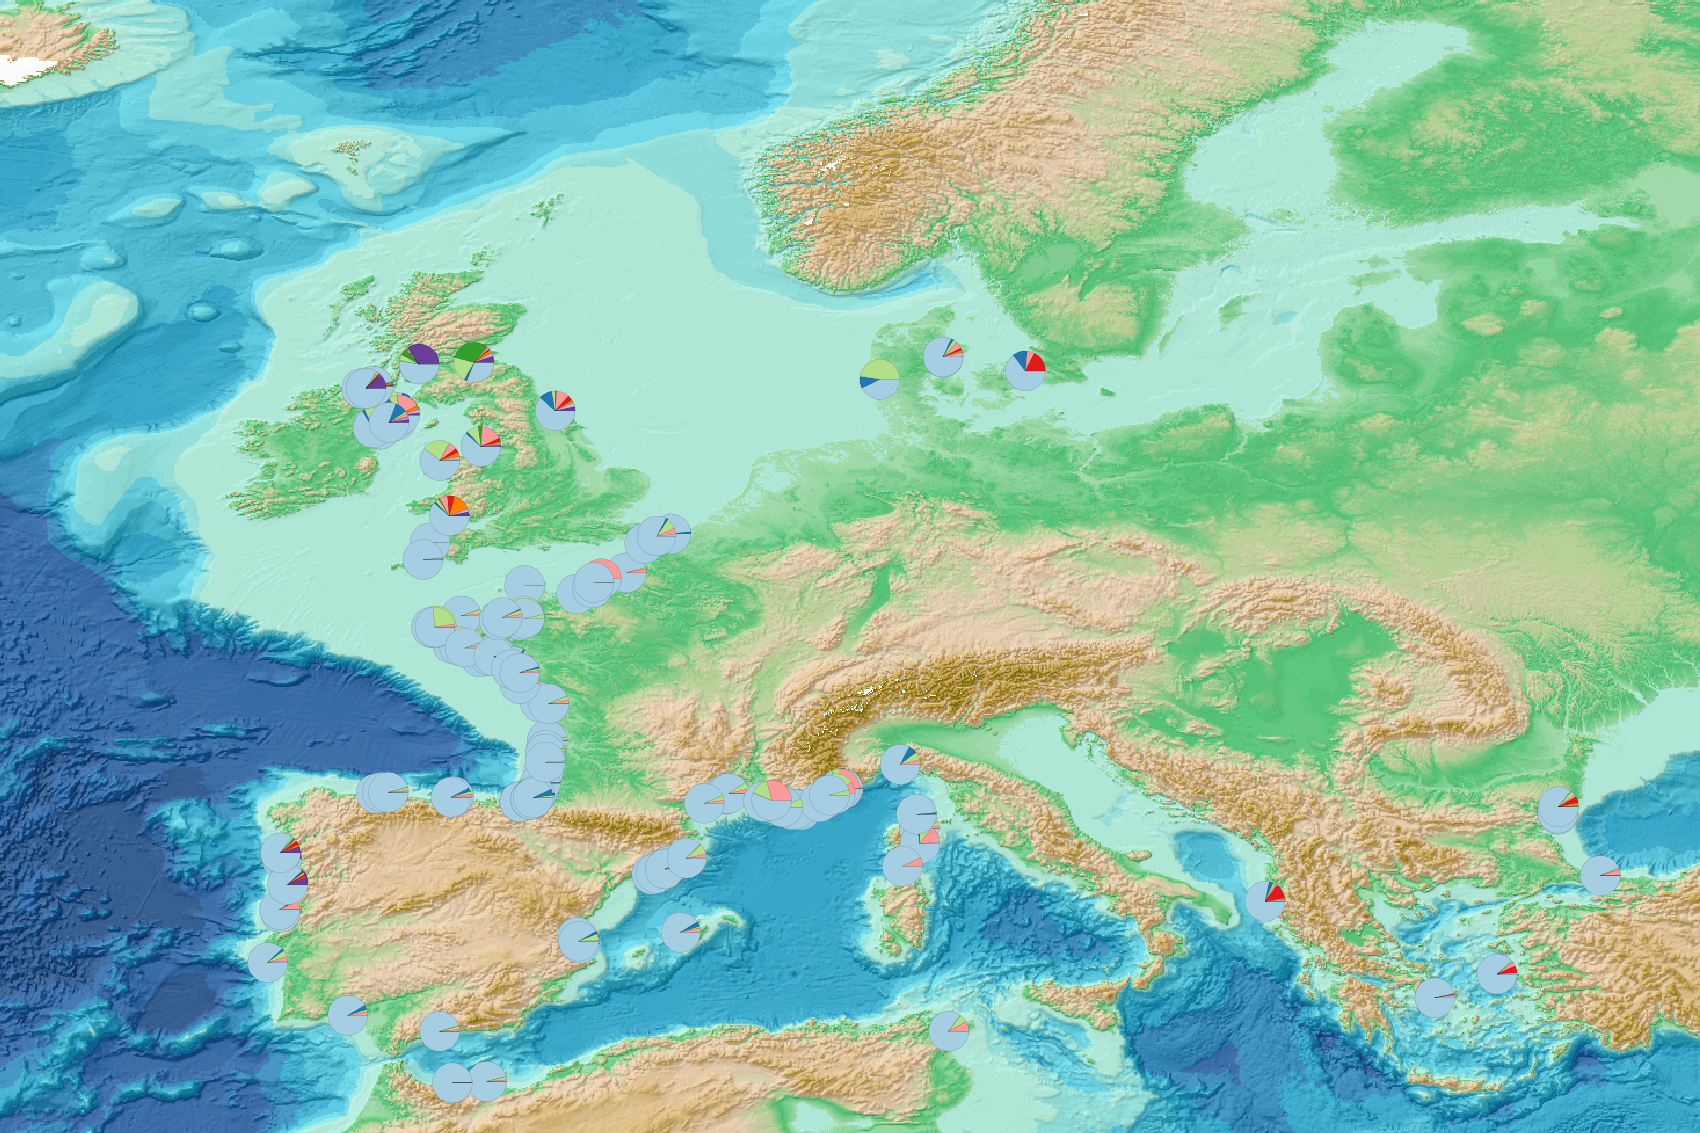
This visualization product displays marine macro-litter (> 2.5cm) material categories percentage per beach per year from non-MSFD monitoring surveys, research & cleaning operations. EMODnet Chemistry included the collection of marine litter in its 3rd phase. Since the beginning of 2018, data of beach litter have been gathered and processed in the EMODnet Chemistry Marine Litter Database (MLDB). The harmonization of all the data has been the most challenging task considering the heterogeneity of the data sources, sampling protocols and reference lists used on a European scale. Preliminary processing were necessary to harmonize all the data: - Exclusion of OSPAR 1000 protocol: in order to follow the approach of OSPAR that it is not including these data anymore in the monitoring; - Selection of surveys from non-MSFD monitoring, cleaning and research operations; - Exclusion of beaches without coordinates; - Exclusion of surveys without associated length; - Some litter types like organic litter, small fragments (paraffin and wax; items > 2.5cm) and pollutants have been removed. The list of selected items is attached to this metadata. This list was created using EU Marine Beach Litter Baselines and EU Threshold Value for Macro Litter on Coastlines from JRC (these two documents are attached to this metadata); - Exclusion of the "feaces" category: it concerns more exactly the items of dog excrements in bags of the OSPAR (item code: 121) and ITA (item code: IT59) reference lists; - Normalization of survey lengths to 100m & 1 survey / year: in some case, the survey length was not 100m, so in order to be able to compare the abundance of litter from different beaches a normalization is applied using this formula: Number of items (normalized by 100 m) = Number of litter per items x (100 / survey length) Then, this normalized number of items is summed to obtain the total normalized number of litter for each survey. To calculate percentages for each material category, formula applied is: Material (%) = (∑number of items (normalized at 100 m) of each material category)*100 / (∑number of items (normalized at 100 m) of all categories) The material categories differ between reference lists (OSPAR, TSG_ML, UNEP, UNEP_MARLIN). In order to apply a common procedure for all the surveys, the material categories have been harmonized. More information is available in the attached documents. Warning: the absence of data on the map doesn't necessarily mean that they don't exist, but that no information has been entered in the Marine Litter Database for this area.