 Arctic SDI catalogue

Type of resources
Available actions
Topics
Keywords
Contact for the resource
Provided by
Years
Formats
Service types
Scale
Resolution
-
<p>Happywhale.com is a resource to help you know whales as individuals, and to benefit conservation science with rich data about individual whales.-nbsp;</p>
-

The "EMODnet Digital Bathymetry (DTM)- 2020" is a multilayer bathymetric product for Europe’s sea basins covering: • the Greater North Sea, including the Kattegat and stretches of water such as Fair Isle, Cromarty, Forth, Forties,Dover, Wight, and Portland • the English Channel and Celtic Seas • Western Mediterranean, the Ionian Sea and the Central Mediterranean Sea • Iberian Coast and Bay of Biscay (Atlantic Ocean) • Adriatic Sea (Mediterranean) • Aegean - Levantine Sea (Mediterranean). • Madeira and Azores (Macaronesia) • Baltic Sea • Black Sea • Norwegian and Icelandic Seas • Canary Islands (Macaronesia) • Arctic region and Barentz Sea The DTM is based upon more than 16360 bathymetric survey data sets and Composite DTMs that have been gathered from 49 data providers from 24 countries riparian to European seas. Also Satellite Derived Bathymetry data products have been included derived from Landsat 8 and Sentinel satellite images. Areas not covered by observations are completed by integrating GEBCO 2020 and IBCAO V4. The source reference layer in the portal viewing service gives metadata of the data sets used with their data providers; the metadata also acknowledges the data originators. The incorporated survey data sets itself can be discovered and requested for access through the Common Data Index (CDI) data discovery and access service that in December 2020 contained > 30.000 survey data sets from European data providers for global waters. This discovery service makes use of SeaDataNet standards and services and have been integrated in the EMODnet portal (https://emodnet.ec.europa.eu/en/bathymetry#bathymetry-services ). The Composite DTMs are described using the Sextant Catalogue Service that makes also use of SeaDataNet standards and services. Their metadata can be retrieved through interrogating the Source Reference map in the Central Map Viewing service (https://emodnet.ec.europa.eu/geoviewer/ ). In addition, the EMODnet Map Viewer gives users wide functionality for viewing and downloading the EMODnet digital bathymetry such as: • water depth (refering to the Lowest Astronomical Tide Datum - LAT) in gridded form on a DTM grid of 1/16 * 1/16 arc minute of longitude and latitude (ca 115 * 115 meters). • option to view depth parameters of individual DTM cells and references to source data • option to download DTM in 58 tiles in different formats: ESRI ASCII, XYZ, EMODnet CSV, NetCDF (CF), GeoTiff and SD • option to visualize the DTM in 3D in the browser without plug-in • layer with a number of high resolution DTMs for coastal regions • layer with wrecks from the UKHO Wrecks database. The EMODnet DTM is also available by means of OGC web services (WMS, WFS, WCS, WMTS), which are specified at the EMODnet Bathymetry portal. The original datasets themselves are not distributed but described in the metadata services, giving clear information about the background survey data used for the DTM, their access restrictions, originators and distributors and facilitating requests by users to originator.
-
The "EMODnet Digital Bathymetry (DTM)- 2024" is a multilayer bathymetric product for Europe’s sea basins covering: • the Greater North Sea, including the Kattegat and stretches of water such as Fair Isle, Cromarty, Forth, Forties,Dover, Wight, and Portland • the English Channel and Celtic Seas • Western Mediterranean, the Ionian Sea and the Central Mediterranean Sea • Iberian Coast and Bay of Biscay (Atlantic Ocean) • Adriatic Sea (Mediterranean) • Aegean - Levantine Sea (Mediterranean). • Madeira and Azores (Macaronesia) • Baltic Sea • Black Sea • Norwegian and Icelandic Seas • Canary Islands (Macaronesia) • Arctic region and Barentz Sea The DTM is based upon 22032 bathymetric survey data sets and Composite DTMs that have been gathered from 66 data providers from 28 countries riparian to European seas and beyond. Also Satellite Derived Bathymetry data products have been included fro Landsat 8 and Sentinel satellite images. Areas not covered by observations are completed by integrating GEBCO 2024 and IBCAO V4. The source reference layer in the portal viewing service gives metadata of the data sets used with their data providers; the metadata also acknowledges the data originators. The incorporated survey data sets itself can be discovered and requested for access through the Common Data Index (CDI) data discovery and access service that contains > 41.000survey data sets from European data providers for global waters. The Composite DTMs can be discovered through the Sextant Catalogue service. Both discovery services make use of SeaDataNet standards and services and have been integrated in the EMODnet portal (https://emodnet.ec.europa.eu/en/bathymetry#bathymetry-services ). In addition, the EMODnet Map Viewer (https://emodnet.ec.europa.eu/geoviewer/ ) gives users wide functionality for viewing and downloading the EMODnet digital bathymetry such as: • water depth (refering to the Lowest Astronomical Tide Datum - LAT) in gridded form on a DTM grid of 1/16 * 1/16 arc minute of longitude and latitude (ca 115 * 115 meters). • option to view depth parameters of individual DTM cells and references to source data • option to download DTM in 59 tiles in different formats: ESRI ASCII, XYZ, EMODnet CSV, NetCDF, GeoTiff and SD • option to visualize the DTM in 3D in the browser without plug-in • layer with a number of high resolution DTMs for coastal regions • layer with wrecks from the UKHO Wrecks database. The EMODnet DTM is also available by means of OGC web services (WMS, WFS, WCS, WMTS), which are specified at the EMODnet Bathymetry portal. The original datasets themselves are not distributed but described in the metadata services, giving clear information about the background survey data used for the DTM, their access restrictions, originators and distributors and facilitating requests by users to originator.
-
The "EMODnet Digital Bathymetry (DTM) - 2018" is a multilayer bathymetric product for Europe’s sea basins covering: • the Greater North Sea, including the Kattegat and stretches of water such as Fair Isle, Cromarty, Forth, Forties,Dover, Wight, and Portland • the English Channel and Celtic Seas • Western Mediterranean, the Ionian Sea and the Central Mediterranean Sea • Iberian Coast and Bay of Biscay (Atlantic Ocean) • Adriatic Sea (Mediterranean) • Aegean - Levantine Sea (Mediterranean). • Madeira and Azores (Macaronesia) • Baltic Sea • Black Sea • Norwegian and Icelandic Seas • Canary Islands (Macaronesia) • Arctic region and Barentz Sea The DTM is based upon more than 9400 bathymetric survey data sets and Composite DTMs that have been gathered from 49 data providers from 24 countries riparian to European seas. Also Satellite Derived Bathymetry data products have been included derived from Landsat 8 satellite images. The source reference layer in the portal viewing service gives metadata of the data sets used with their data providers; the metadata also acknowledges the data originators. The incorporated survey data sets itself can be discovered and requested for access through the Common Data Index (CDI) data discovery and access service that in September 2018 contained > 27.000 survey data sets from European data providers for global waters. This discovery service makes use of SeaDataNet standards and services and have been integrated in the EMODnet portal (https://emodnet.ec.europa.eu/en/bathymetry#bathymetry-services ). The Composite DTMs are described using the Sextant Catalogue Service that makes also use of SeaDataNet standards and services. Their metadata can be retrieved through interrogating the Source Reference map in the Central Map Viewing service (https://emodnet.ec.europa.eu/geoviewer/ ). In addition, the EMODnet Map Viewer gives users wide functionality for viewing and downloading the EMODnet digital bathymetry such as: • water depth (refering to the Lowest Astronomical Tide Datum - LAT) in gridded form on a DTM grid of 1/16 * 1/16 arc minute of longitude and latitude (ca 115 * 115 meters) • option to view depth parameters of individual DTM cells and references to source data • option to download DTM in 58 tiles in different formats: EMO, EMO (without GEBCO data), ESRI ASCII, ESRI ASCII Mean Sea Level, XYZ, NetCDF (CF), RGB GeoTiff and SD • option to visualize the DTM in 3D in the browser without plug-in • layer with a number of high resolution DTMs for coastal regions • layer with wrecks from the UKHO Wrecks database. The EMODnet DTM is also available by means of OGC web services (WMS, WFS, WCS, WMTS), which are specified at the EMODnet Bathymetry portal. The original datasets themselves are not distributed but described in the metadata services, giving clear information about the background survey data used for the DTM, their access restrictions, originators and distributors and facilitating requests by users to originator.
-
The "EMODnet Digital Bathymetry (DTM)- 2022" is a multilayer bathymetric product for Europe’s sea and over seas basins covering: • the Greater North Sea, including the Kattegat and stretches of water such as Fair Isle, Cromarty, Forth, Forties,Dover, Wight, and Portland • the English Channel and Celtic Seas • Western Mediterranean, the Ionian Sea and the Central Mediterranean Sea • Iberian Coast and Bay of Biscay (Atlantic Ocean) • Adriatic Sea (Mediterranean) • Aegean - Levantine Sea (Mediterranean). • Madeira and Azores (Macaronesia) • Baltic Sea • Black Sea • Norwegian and Icelandic Seas • Canary Islands (Macaronesia) • Arctic region and Barentz Sea • Caribbean Sea The DTM is based upon 21937 bathymetric survey data sets and Composite DTMs that have been gathered from 64 data providers from 28 countries riparian to European seas and beyond. Also Satellite Derived Bathymetry data products have been included fro Landsat 8 and Sentinel satellite images. Areas not covered by observations are completed by integrating GEBCO 2022 and IBCAO V4. The source reference layer in the portal viewing service gives metadata of the data sets used with their data providers; the metadata also acknowledges the data originators. The incorporated survey data sets itself can be discovered and requested for access through the Common Data Index (CDI) data discovery and access service that in December 2022 contained > 41.000survey data sets from European data providers for global waters. The Composite DTMs can be discovered through the Sextant Catalogue service. Both discovery services make use of SeaDataNet standards and services and have been integrated in the EMODnet portal (https://emodnet.ec.europa.eu/en/bathymetry#bathymetry-services ). In addition, the EMODnet Map Viewer (https://emodnet.ec.europa.eu/geoviewer/ ) gives users wide functionality for viewing and downloading the EMODnet digital bathymetry such as: • water depth (refering to the Lowest Astronomical Tide Datum - LAT) in gridded form on a DTM grid of 1/16 * 1/16 arc minute of longitude and latitude (ca 115 * 115 meters). • option to view depth parameters of individual DTM cells and references to source data • option to download DTM in 58 tiles in different formats: ESRI ASCII, XYZ, EMODnet CSV, NetCDF (CF), GeoTiff, TIFF and SD • option to visualize the DTM in 3D in the browser without plug-in • layer with a number of high resolution DTMs for coastal regions • layer with wrecks from the UKHO Wrecks database. The EMODnet DTM is also available by means of OGC web services (WMS, WFS, WCS, WMTS), which are specified at the EMODnet Bathymetry portal. The original datasets themselves are not distributed but described in the metadata services, giving clear information about the background survey data used for the DTM, their access restrictions, originators and distributors and facilitating requests by users to originator.
-

This visualization product displays the cigarette related items abundance of marine macro-litter (> 2.5cm) per beach per year from Marine Strategy Framework Directive (MSFD) monitoring surveys without UNEP-MARLIN data. EMODnet Chemistry included the collection of marine litter in its 3rd phase. Since the beginning of 2018, data of beach litter have been gathered and processed in the EMODnet Chemistry Marine Litter Database (MLDB). The harmonization of all the data has been the most challenging task considering the heterogeneity of the data sources, sampling protocols and reference lists used on a European scale. Preliminary processings were necessary to harmonize all the data: - Exclusion of OSPAR 1000 protocol: in order to follow the approach of OSPAR that it is not including these data anymore in the monitoring; - Selection of MSFD surveys only (exclusion of other monitoring, cleaning and research operations); - Exclusion of beaches without coordinates; - Selection of cigarette related items only. The list of selected items is attached to this metadata. This list was created using EU Marine Beach Litter Baselines, the European Threshold Value for Macro Litter on Coastlines and the Joint list of litter categories for marine macro-litter monitoring from JRC (these three documents are attached to this metadata); - Exclusion of surveys referring to the UNEP-MARLIN list: the UNEP-MARLIN protocol differs from the other types of monitoring in that cigarette butts are surveyed in a 10m square. To avoid comparing abundances from very different protocols, the choice has been made to distinguish in two maps the cigarette related items results associated with the UNEP-MARLIN list from the others; - Normalization of survey lengths to 100m & 1 survey / year: in some case, the survey length was not exactly 100m, so in order to be able to compare the abundance of litter from different beaches a normalization is applied using this formula: Number of cigarette related items of the survey (normalized by 100 m) = Number of cigarette related items of the survey x (100 / survey length) Then, this normalized number of cigarette related items is summed to obtain the total normalized number of cigarette related items for each survey. Finally, the median abundance of cigarette related items for each beach and year is calculated from these normalized abundances of cigarette related items per survey. Sometimes the survey length was null or equal to 0. Assuming that the MSFD protocol has been applied, the length has been set at 100m in these cases. Percentiles 50, 75, 95 & 99 have been calculated taking into account cigarette related items from MSFD monitoring data (excluding UNEP-MARLIN protocol) for all years. More information is available in the attached documents. Warning: the absence of data on the map does not necessarily mean that they do not exist, but that no information has been entered in the Marine Litter Database for this area.
-
The "EMODnet Digital Bathymetry (DTM)- 2024" is a multilayer bathymetric product for Europe’s sea basins covering: • the Greater North Sea, including the Kattegat and stretches of water such as Fair Isle, Cromarty, Forth, Forties,Dover, Wight, and Portland • the English Channel and Celtic Seas • Western Mediterranean, the Ionian Sea and the Central Mediterranean Sea • Iberian Coast and Bay of Biscay (Atlantic Ocean) • Adriatic Sea (Mediterranean) • Aegean - Levantine Sea (Mediterranean). • Madeira and Azores (Macaronesia) • Baltic Sea • Black Sea • Norwegian and Icelandic Seas • Canary Islands (Macaronesia) • Arctic region and Barentz Sea The DTM is based upon 22032 bathymetric survey data sets and Composite DTMs that have been gathered from 66 data providers from 28 countries riparian to European seas and beyond. Also Satellite Derived Bathymetry data products have been included fro Landsat 8 and Sentinel satellite images. Areas not covered by observations are completed by integrating GEBCO 2024 and IBCAO V4. The source reference layer in the portal viewing service gives metadata of the data sets used with their data providers; the metadata also acknowledges the data originators. The incorporated survey data sets itself can be discovered and requested for access through the Common Data Index (CDI) data discovery and access service that contains > 41.000survey data sets from European data providers for global waters. The Composite DTMs can be discovered through the Sextant Catalogue service. Both discovery services make use of SeaDataNet standards and services and have been integrated in the EMODnet portal (https://emodnet.ec.europa.eu/en/bathymetry#bathymetry-services ). In addition, the EMODnet Map Viewer (https://emodnet.ec.europa.eu/geoviewer/ ) gives users wide functionality for viewing and downloading the EMODnet digital bathymetry such as: • water depth (refering to the Lowest Astronomical Tide Datum - LAT) in gridded form on a DTM grid of 1/16 * 1/16 arc minute of longitude and latitude (ca 115 * 115 meters). • option to view depth parameters of individual DTM cells and references to source data • option to download DTM in 59 tiles in different formats: ESRI ASCII, XYZ, EMODnet CSV, NetCDF, GeoTiff and SD • option to visualize the DTM in 3D in the browser without plug-in • layer with a number of high resolution DTMs for coastal regions • layer with wrecks from the UKHO Wrecks database. The EMODnet DTM is also available by means of OGC web services (WMS, WFS, WCS, WMTS), which are specified at the EMODnet Bathymetry portal. The original datasets themselves are not distributed but described in the metadata services, giving clear information about the background survey data used for the DTM, their access restrictions, originators and distributors and facilitating requests by users to originator.
-
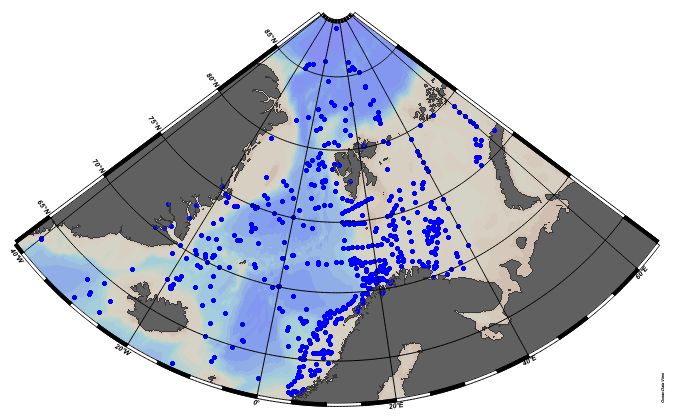
EMODnet Chemistry aims to provide access to marine chemistry datasets and derived data products concerning eutrophication, acidity and contaminants. The importance of the selected substances and other parameters relates to the Marine Strategy Framework Directive (MSFD). This aggregated dataset contains all unrestricted EMODnet Chemistry data on potential hazardous substances, despite the fact that some data might not be related to pollution (e.g. collected by deep corer). Temperature, salinity and additional parameters are included when available. It covers the Norwegian Sea, Barents Sea, Greenland Sea and Icelandic Waters. Data were harmonised and validated by the 'Institute of Marine Research - Norwegian Marine Data Centre (NMD)' in Norway. The dataset contains water and sediment profiles. The temporal coverage is 1974–2011 for water measurements and 1974–2021 for sediment measurements. Regional datasets concerning contaminants are automatically harvested and the resulting collections are harmonised and validated using ODV Software and following a common methodology for all sea regions ( https://doi.org/10.6092/8b52e8d7-dc92-4305-9337-7634a5cae3f4). Parameter names are based on P01 vocabulary, which relates to BODC Parameter Usage Vocabulary and is available at: https://vocab.nerc.ac.uk/search_nvs/P01/. The harmonised dataset can be downloaded as as an ODV spreadsheet, which is composed of a metadata header followed by tab separated values. This spreadsheet can be imported into ODV Software for visualisation (more information can be found at: https://www.seadatanet.org/Software/ODV). In addition, the same dataset is offered also as a txt file in a long/vertical format, in which each P01 measurement is a record line. Additionally, there are a series of columns that split P01 terms into subcomponents (substance, CAS number, matrix...).This transposed format is more adapted to worksheet applications (e.g. LibreOffice Calc).
-
The "EMODnet Digital Bathymetry (DTM)- 2024" is a multilayer bathymetric product for Europe’s sea and over seas basins covering: • the Greater North Sea, including the Kattegat and stretches of water such as Fair Isle, Cromarty, Forth, Forties,Dover, Wight, and Portland • the English Channel and Celtic Seas • Western Mediterranean, the Ionian Sea and the Central Mediterranean Sea • Iberian Coast and Bay of Biscay (Atlantic Ocean) • Adriatic Sea (Mediterranean) • Aegean - Levantine Sea (Mediterranean). • Madeira and Azores (Macaronesia) • Baltic Sea • Black Sea • Norwegian and Icelandic Seas • Canary Islands (Macaronesia) • Arctic region and Barentz Sea • Caribbean Sea The DTM is based upon 22032 bathymetric survey data sets and Composite DTMs that have been gathered from 66 data providers from 28 countries riparian to European seas and beyond. Also Satellite Derived Bathymetry data products have been included fro Landsat 8 and Sentinel satellite images. Areas not covered by observations are completed by integrating GEBCO 2024 and IBCAO V4. The source reference layer in the portal viewing service gives metadata of the data sets used with their data providers; the metadata also acknowledges the data originators. The incorporated survey data sets itself can be discovered and requested for access through the Common Data Index (CDI) data discovery and access service that contains > 41.000survey data sets from European data providers for global waters. The Composite DTMs can be discovered through the Sextant Catalogue service. Both discovery services make use of SeaDataNet standards and services and have been integrated in the EMODnet portal (https://emodnet.ec.europa.eu/en/bathymetry#bathymetry-services ). In addition, the EMODnet Map Viewer (https://emodnet.ec.europa.eu/geoviewer/ ) gives users wide functionality for viewing and downloading the EMODnet digital bathymetry such as: • water depth (refering to the Lowest Astronomical Tide Datum - LAT) in gridded form on a DTM grid of 1/16 * 1/16 arc minute of longitude and latitude (ca 115 * 115 meters). • option to view depth parameters of individual DTM cells and references to source data • option to download DTM in 59 tiles in different formats: ESRI ASCII, XYZ, EMODnet CSV, NetCDF (CF), GeoTiff and SD • option to visualize the DTM in 3D in the browser without plug-in • layer with a number of high resolution DTMs for coastal regions • layer with wrecks from the UKHO Wrecks database. The EMODnet DTM is also available by means of OGC web services (WMS, WFS, WCS, WMTS), which are specified at the EMODnet Bathymetry portal. The original datasets themselves are not distributed but described in the metadata services, giving clear information about the background survey data used for the DTM, their access restrictions, originators and distributors and facilitating requests by users to originator.
-
pyrene_counts_2024.jpg)
This product displays for Benzo(a)pyrene, positions with values counts that have been measured per matrix and are present in EMODnet regional contaminants aggregated datasets, v2024. The product displays positions for all available years.