 Arctic SDI catalogue
Energy resources
Type of resources
Available actions
Keywords
Contact for the resource
Provided by
-

Þetta gagnasett inniheldur nákvæma skráningu á tillögum að orkuvalkostum sem lagðar hafa verið fram af Orkustofnun sem hluti af áframhaldandi áætlun um orkuþróunarverkefni. Það nær yfir fjölda af valkostum um orkunýtingu, þar á meðal nýtingu á vindorku, jarðvarma og vatnsorku. Gögnunum hefur verið vandlega safnað saman úr skýrslum og ýmsum viðbótarupplýsingum sem ýmsir þróunaraðilar hafa gefið Orkustofnun aðgang að. Þar má finna mikilvægar upplýsingar eins og framkvæmdarsvæði, áhrifasvæði sem táknað er með fjarlægðarhringjum (e. buffer rings) auk sértækra gagna eins og vintúrbínustillingar fyrir hvern vindorkuvalkost. Hver færsla í gagnasettinu á sér á sér samsvörun við orkuvalkost og þar er að finna eigindir eins og Ramma ID númer, nafn, þróunaðili, áætluð orkuframleiðsla, orkugerð, skilvirkni, link á skýrslu, dagsetningu umsóknar, uppruni vektorteikninga og núverandi staða valkostarins. Lagið sem heldur meginupplýsingarnar endurspeglar uppbyggingu töfluganga sem kynntar eru að vefsíðu Orkustofnunar, þar sem tryggð er skýr og kerfisbundin framsetning á gögnum til að auðvelda ítarlegt mat sem og opinbera umræðu. Hluti gagnanna er nú aðgengilegur sem WMS þjónusta --------------------------------------------------------------------------------------------- English version This dataset encapsulates a detailed inventory of power plant proposals submitted to Orkustofnun as part of an ongoing energy development project. It encompasses an array of power plant options including wind, geothermal, and hydro energy facilities. The data is meticulously compiled from submitted reports and supplementary data provided by developers to Orkustofnun. It features essential attributes such as the construction area, impact zones represented by buffer rings, and specific details like wind turbine configurations for wind energy proposals. Each entry in the dataset corresponds to a power plant proposal and includes attributes like Ramma ID number, name, developer, estimated power, energy type, efficiency class, URL link to the report, date of application, source of vectorization, and the current status of the proposal (e.g., under consideration, submitted/defined). The main information layer mirrors the structured table presented on the Orkustofnun website, ensuring a coherent and systematic presentation of data for thorough evaluation and public discourse. The data will be soon available as WMS service.
-
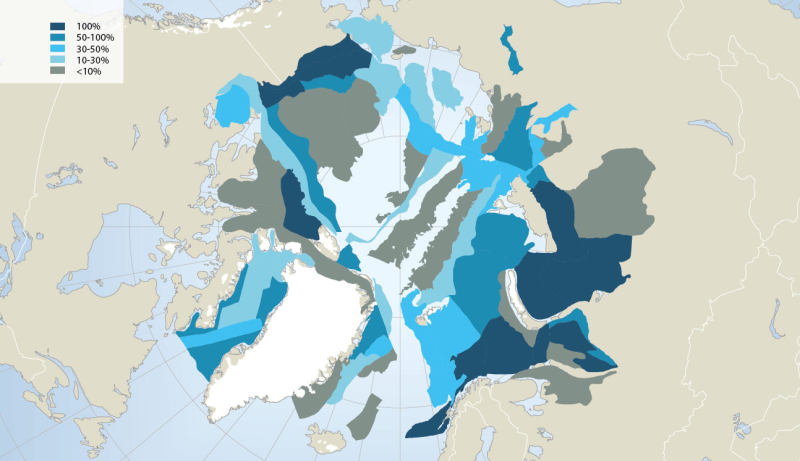
Extensive oil and gas activity has occurred in the Arctic, primarily land-based, with Russia extracting 80% of the oil and 99% of the gas to date (AMAP 2008). Furthermore, the Arctic still contains large petroleum hydrocarbon reserves and potentially holds one fifth of the world’s yet undiscovered resources, according to the US Geological Survey (USGS 2008) (Fig. 14.4). While much of the currently known Arctic oil and gas reserves are in Russia (75% of oil and 90% of gas; AMAP 2008), more than half of the estimated undiscovered Arctic oil reserves are in Alaska (offshore and onshore), the Amerasian Basin (offshore north of the Beaufort Sea) and in W and E Greenland (offshore). More than 70% of the Arctic undiscovered natural gas is estimated to be located in the W Siberian Basin (Yamal Peninsula and offshore in the Kara Sea), the E Barents Basin and in Alaska (offshore and onshore) (AMSA 2009). Associated with future exploration and development, each of these regions would require vastly expanded Arctic marine operations, and several regions such as offshore Greenland would require fully developed Arctic marine transport systems to carry hydrocarbons to global markets. In this context, regions of high interest for economic development face cumulative environmental pressure from anthropogenic activities such as hydrocarbon exploitation locally, together with global changes associated with climatic and oceanographic trends. Conservation of Arctic Flora and Fauna, CAFF 2013 - Akureyri . Arctic Biodiversity Assessment. Status and Trends in Arctic biodiversity. - Marine ecosystems (Chapter 14 - page 501). Figure adapted from the USGS
-

Íslenskur texti er í vinnslu. This raster dataset is a visibility analysis of several wind turbine projects across Iceland which are a part of the fifth phase of the master plan (Rammaáætlun http://www.ramma.is/). The area analysed is a 45 km buffer zone around each wind turbine project. The cutout areas in the 45 km buffer have no visibility due to visual obstruction. The red colour represents high visibility, fading into yellow, with the green colour representing low visibility of the wind turbines. Zones of theoretical visibility have been classified as near (0-2km), intermediate (2-15km) and remote zone (>15km) which are represented in the colour grading. It should be considered that atmospheric conditions, lighting, shading and more affect visibility and detectability. The perception of the wind projects in the green zone will be more fading in the landscape without direct detection, while in the red coloured zone the wind turbine is a prominent element in the landscape. For further information consider reading the respective chapter in the project report or check out further tools like the Ramma 3D map. As a digital elevation model the 10x10 m resolution ÍslandsDEM is used which sets the dataset pixel resolution to 10x10 m. An average viewer height of 1.75 m is assumed, while the wind turbine heights vary between 150 m and 200 m depending on project sites. The maximal height of the wind turbine is considered, meaning to the upper blade tip. See more information in the table on the side. The curvature of the earth is considered in the simulation and a default atmospheric refraction of 0.13 is assumed.