 Arctic SDI catalogue

Type of resources
Available actions
Topics
Keywords
Contact for the resource
Provided by
Years
Formats
Representation types
Update frequencies
Service types
Scale
-
This report attempts to review the abundance, status and distribution of natural wild goose populations in the northern hemisphere. The report comprises three parts that 1) summarise key findings from the study and the methodology and analysis applied; 2) contain the individual accounts for each of the 68 populations included in this report; and 3) provide the datasets compiled for this study which will be made accessible on the Arctic Biodiversity Data Service.
-
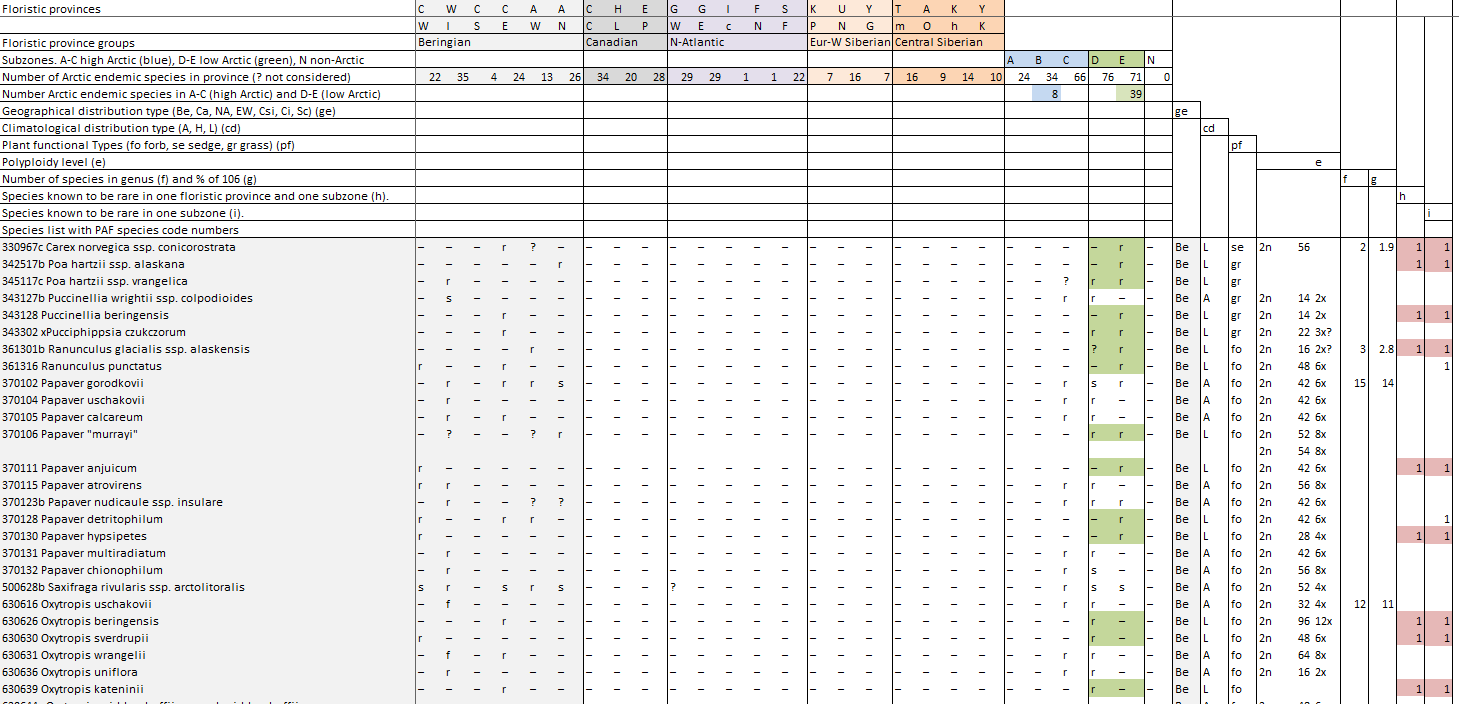
Appendix 9.2 The 106 Arctic endemic vascular plant species (with PAF code number) and their distribution in the Arctic floristic provinces and subzones (A-E) compiled from Elven (2007).
-
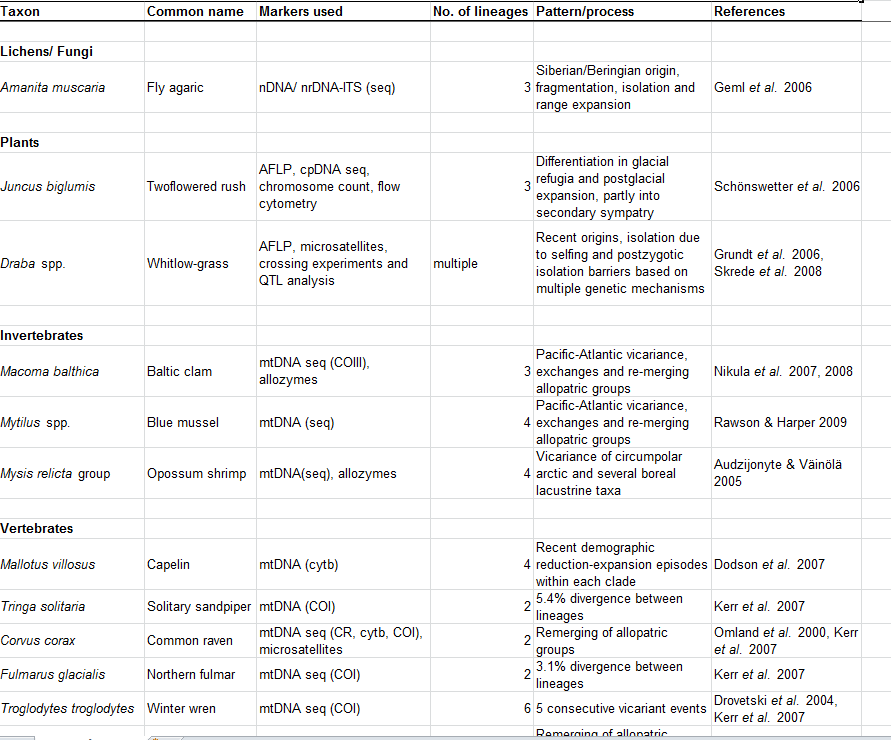
Appendix 17.2. Cryptic speciation in selected Arctic terrestrial and marine species.
-
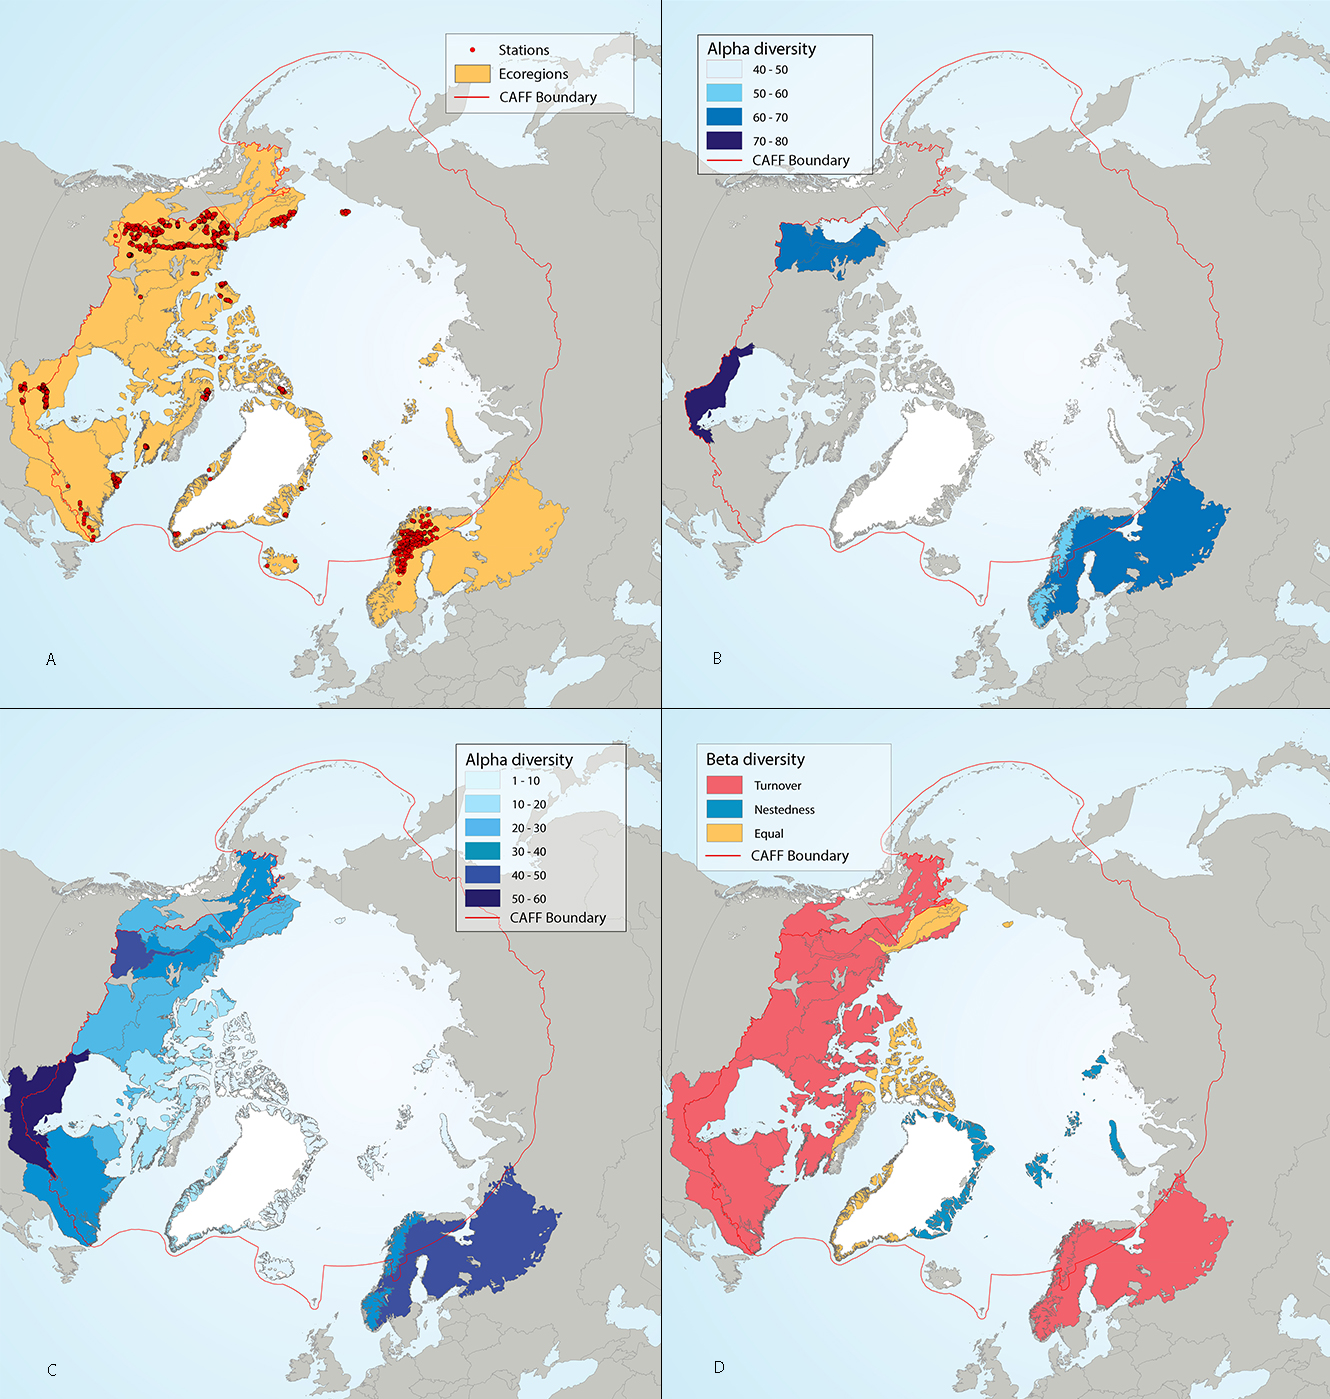
Results of circumpolar assessment of river benthic macroinvertebrates, indicating (a) the location of river benthic macroinvertebrate stations, underlain by circumpolar ecoregions; (b) ecoregions with many river benthic macroinvertebrate stations, colored on the basis of alpha diversity rarefied to 100 stations; (c) all ecoregions with river benthic macroinvertebrate stations, colored on the basis of alpha diversity rarefied to 10 stations; (d) ecoregions with at least two stations in a hydrobasin, colored on the basis of the dominant component of beta diversity (species turnover, nestedness, approximately equal contribution, or no diversity) when averaged across hydrobasins in each ecoregion. State of the Arctic Freshwater Biodiversity Report - Chapter 4 - Page 67 - Figure 4-30
-
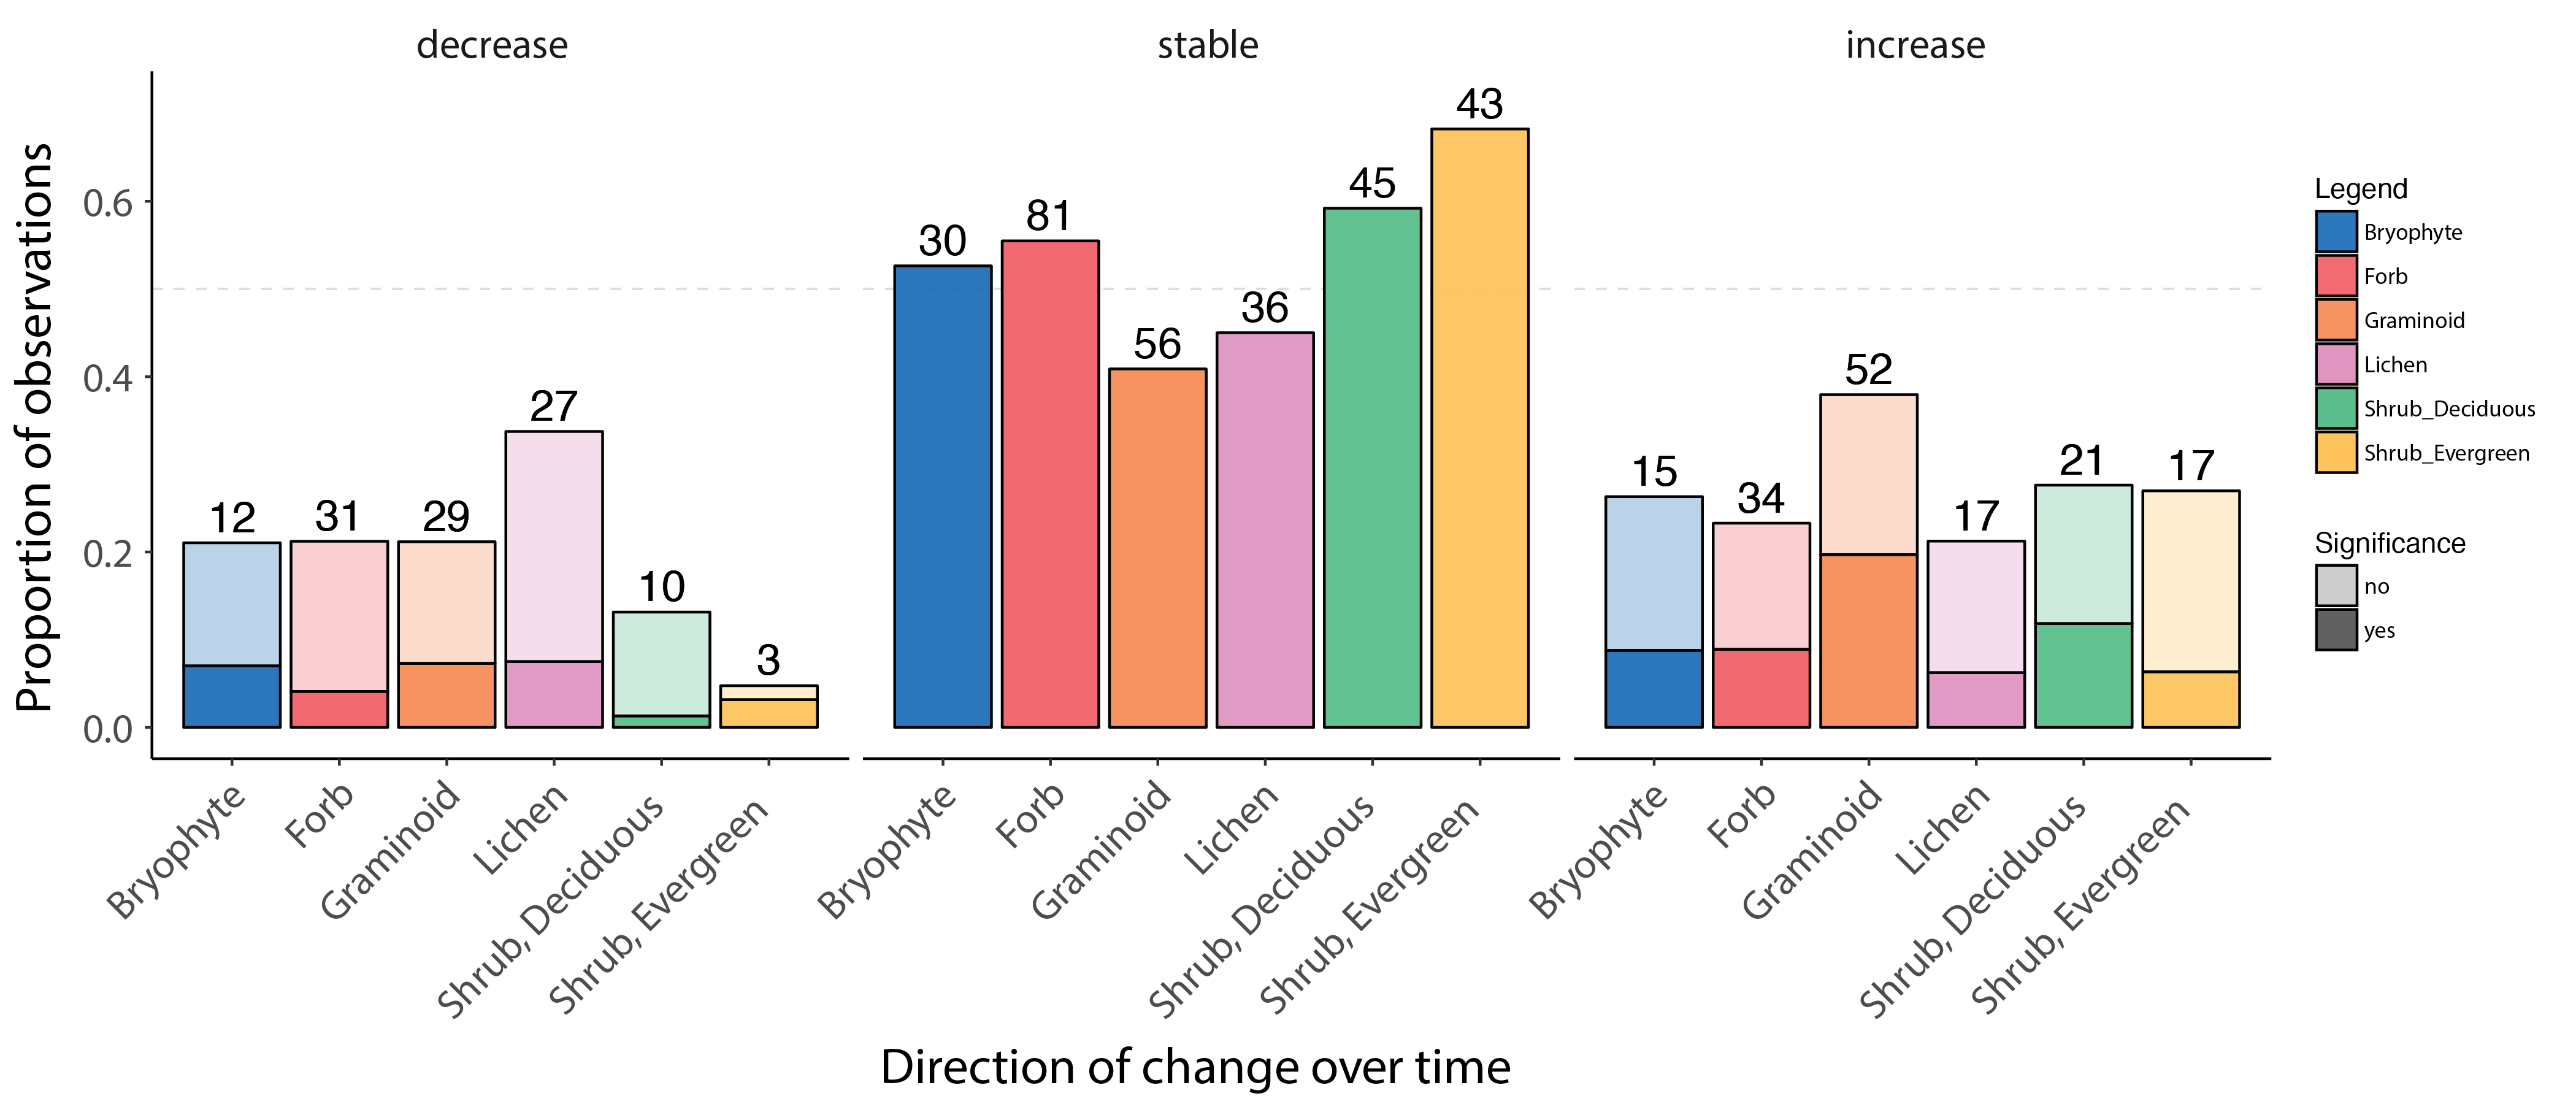
Change in forb, graminoid and shrub abundance by species or functional group over time based on local field studies across the Arctic, ranging from 5 to 43 years of duration. The bars show the proportion of observed decreasing, stable and increasing change in abundance, based on published studies. The darker portions of each bar represent a significant decrease, stable state, or increase, and lighter shading represents marginally significant change. The numbers above each bar indicate the number of observations in that group. Modified from Bjorkman et al. 2020. STATE OF THE ARCTIC TERRESTRIAL BIODIVERSITY REPORT - Chapter 3 - Page 31- Figure 3.2
-
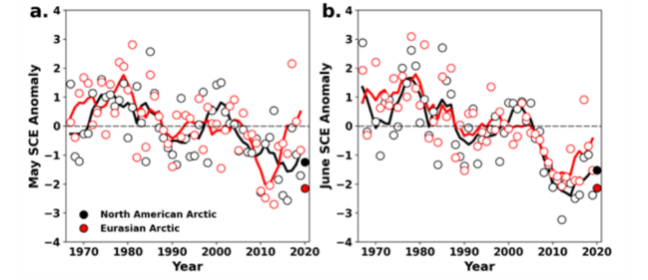
Monthly snow cover extent (SCE) for Arctic land areas (>60° N) for (a) May and (b) June 1967–2020, a 54-year record. Anomalies are relative to the 1981–2010 average and standardised (each observation was differenced from the mean and divided by the standard deviation, and thus unitless). Solid black and red lines depict 5-year running means for North America and Eurasia, respectively. Filled circles are used to highlight 2020 anomalies. (Mudryk et al. 2020). STATE OF THE ARCTIC TERRESTRIAL BIODIVERSITY REPORT - Chapter 2 - Page 23 - Figure 2.3
-
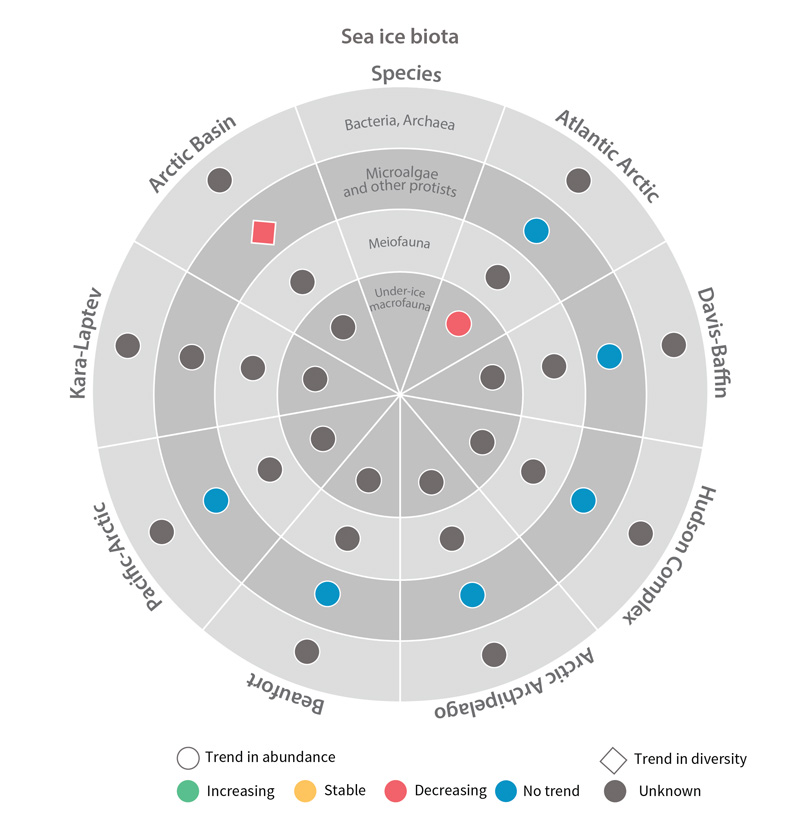
Trends in abundance or diversity of sea ice biota Focal Ecosystem Components across each Arctic Marine Area. STATE OF THE ARCTIC MARINE BIODIVERSITY REPORT - Chapter 4 - Page 177 - Figure 4.1
-
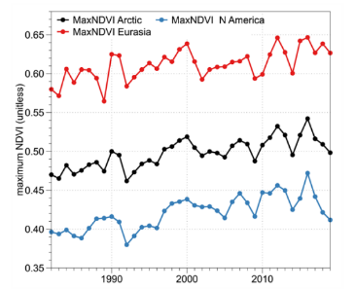
Circumpolar trends in primary productivity as indicated by the maximum Normalised Difference Vegetation Index, 1982–2017. (a) Brown shading indicates negative MaxNDVI trends, green shading indicates positive MaxNDVI trends. (b) Chart of trends for the circumpolar Arctic, Eurasia, and North America. Modified from Frost et al. 2020. STATE OF THE ARCTIC TERRESTRIAL BIODIVERSITY REPORT - Chapter 3 - Page 30 - Figure 3.1
-
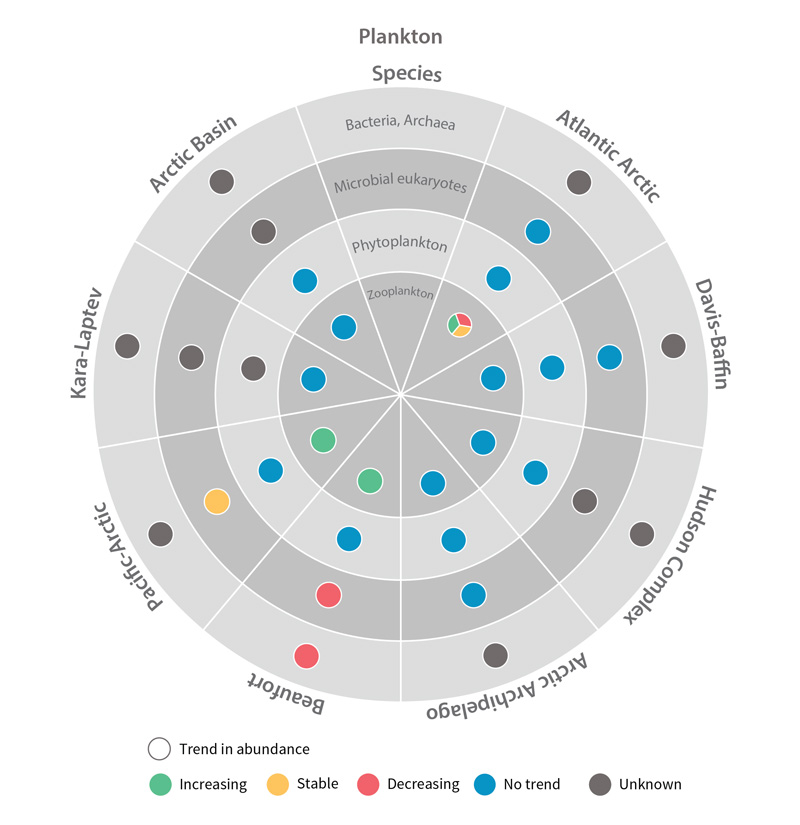
Trends in abundance of plankton Focal Ecosystem Components across each Arctic Marine Area. STATE OF THE ARCTIC MARINE BIODIVERSITY REPORT - Chapter 4 - Page 178 - Figure 4.2
-
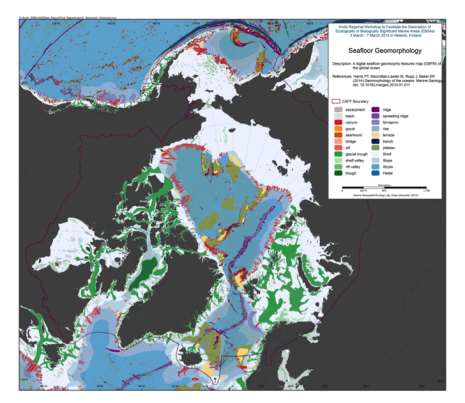
We present the first digital seafloor geomorphic features map (GSFM) of the global ocean. The GSFM includes 131,192 separate polygons in 29 geomorphic feature categories, used here to assess differences between passive and active continental margins as well as between 8 major ocean regions (the Arctic, Indian, North Atlantic, North Pacific, South Atlantic, South Pacific and the Southern Oceans and the Mediterranean and Black Seas). The GSFM provides quantitative assessments of differences between passive and active margins: continental shelf width of passive margins (88 km) is nearly three times that of active margins (31 km); the average width of active slopes (36 km) is less than the average width of passive margin slopes (46 km); active margin slopes contain an area of 3.4 million km2 where the gradient exceeds 5°, compared with 1.3 million km2 on passive margin slopes; the continental rise covers 27 million km2 adjacent to passive margins and less than 2.3 million km2 adjacent to active margins. Examples of specific applications of the GSFM are presented to show that: 1) larger rift valley segments are generally associated with slow-spreading rates and smaller rift valley segments are associated with fast spreading; 2) polar submarine canyons are twice the average size of non-polar canyons and abyssal polar regions exhibit lower seafloor roughness than non-polar regions, expressed as spatially extensive fan, rise and abyssal plain sediment deposits – all of which are attributed here to the effects of continental glaciations; and 3) recognition of seamounts as a separate category of feature from ridges results in a lower estimate of seamount number compared with estimates of previous workers. Reference: Harris PT, Macmillan-Lawler M, Rupp J, Baker EK Geomorphology of the oceans. Marine Geology.