 Arctic SDI catalogue
CAFF
Type of resources
Available actions
Topics
Keywords
Contact for the resource
Provided by
Years
Formats
Representation types
Update frequencies
Service types
Scale
-
Standardized metadata template, for identifying knowledge locations on Arctic Coastal Ecosystems applicable for different knowledge systems. This template was developed by the Nordic Coastal Group, composed of the Nordic representatives on CBMP Coastal. The template is intended to identify locations for Indigenous Knowledge, Scientific, Hunters Knowledge, Local Knowledge, and community-based monitoring. The template is composed of two files a Word document that provides the rationale and detailed description for the Excel sheet that allows for standardized data gathering
-

Results of circumpolar assessment of river diatoms, indicating (a) the location of river diatom stations, underlain by circumpolar ecoregions; (b) ecoregions with many river diatom stations, colored on the basis of alpha diversity rarefied to 40 stations; (c) all ecoregions with river diatom stations, colored on the basis of alpha diversity rarefied to 10 stations; (d) ecoregions with at least two stations in a hydrobasin, colored on the basis of the dominant component of beta diversity (species turnover, nestedness, approximately equal contribution, or no diversity) when averaged across hydrobasins in each ecoregion. State of the Arctic Freshwater Biodiversity Report - Chapter 4 - Page 36 - Figure 4-8
-

Summary of the taxa accounting for 85% of the river benthic macroinvertebrates collected in each of several highly-sampled geographic areas, with taxa grouped by order level or higher in pie charts placed spatially to indicate sampling area. Pie charts correspond to (1) Alaska, (2) western Canada, (3) southern Canada, south of Hudson Bay, (4) northern Labrador, (5) Baffin Island, (6) Ellesmere Island, (7) Greenland high Arctic, (8) Greenland low Arctic, (9) Iceland, (10) Svalbard, and (11) Fennoscandia. State of the Arctic Freshwater Biodiversity Report - Chapter 4 - Page 70 - Figure 4-34
-

Figure 3-5 Changes in alpha diversity (red line), predator body size (blue dashed line), and ecosystem metabolism (blue solid line) with a shift in glacial cover from high (left) to low (right). Redrawn from Milner et al. (2017). State of the Arctic Freshwater Biodiversity Report - Chapter 3 - Page 22 - Figure 3-5
-
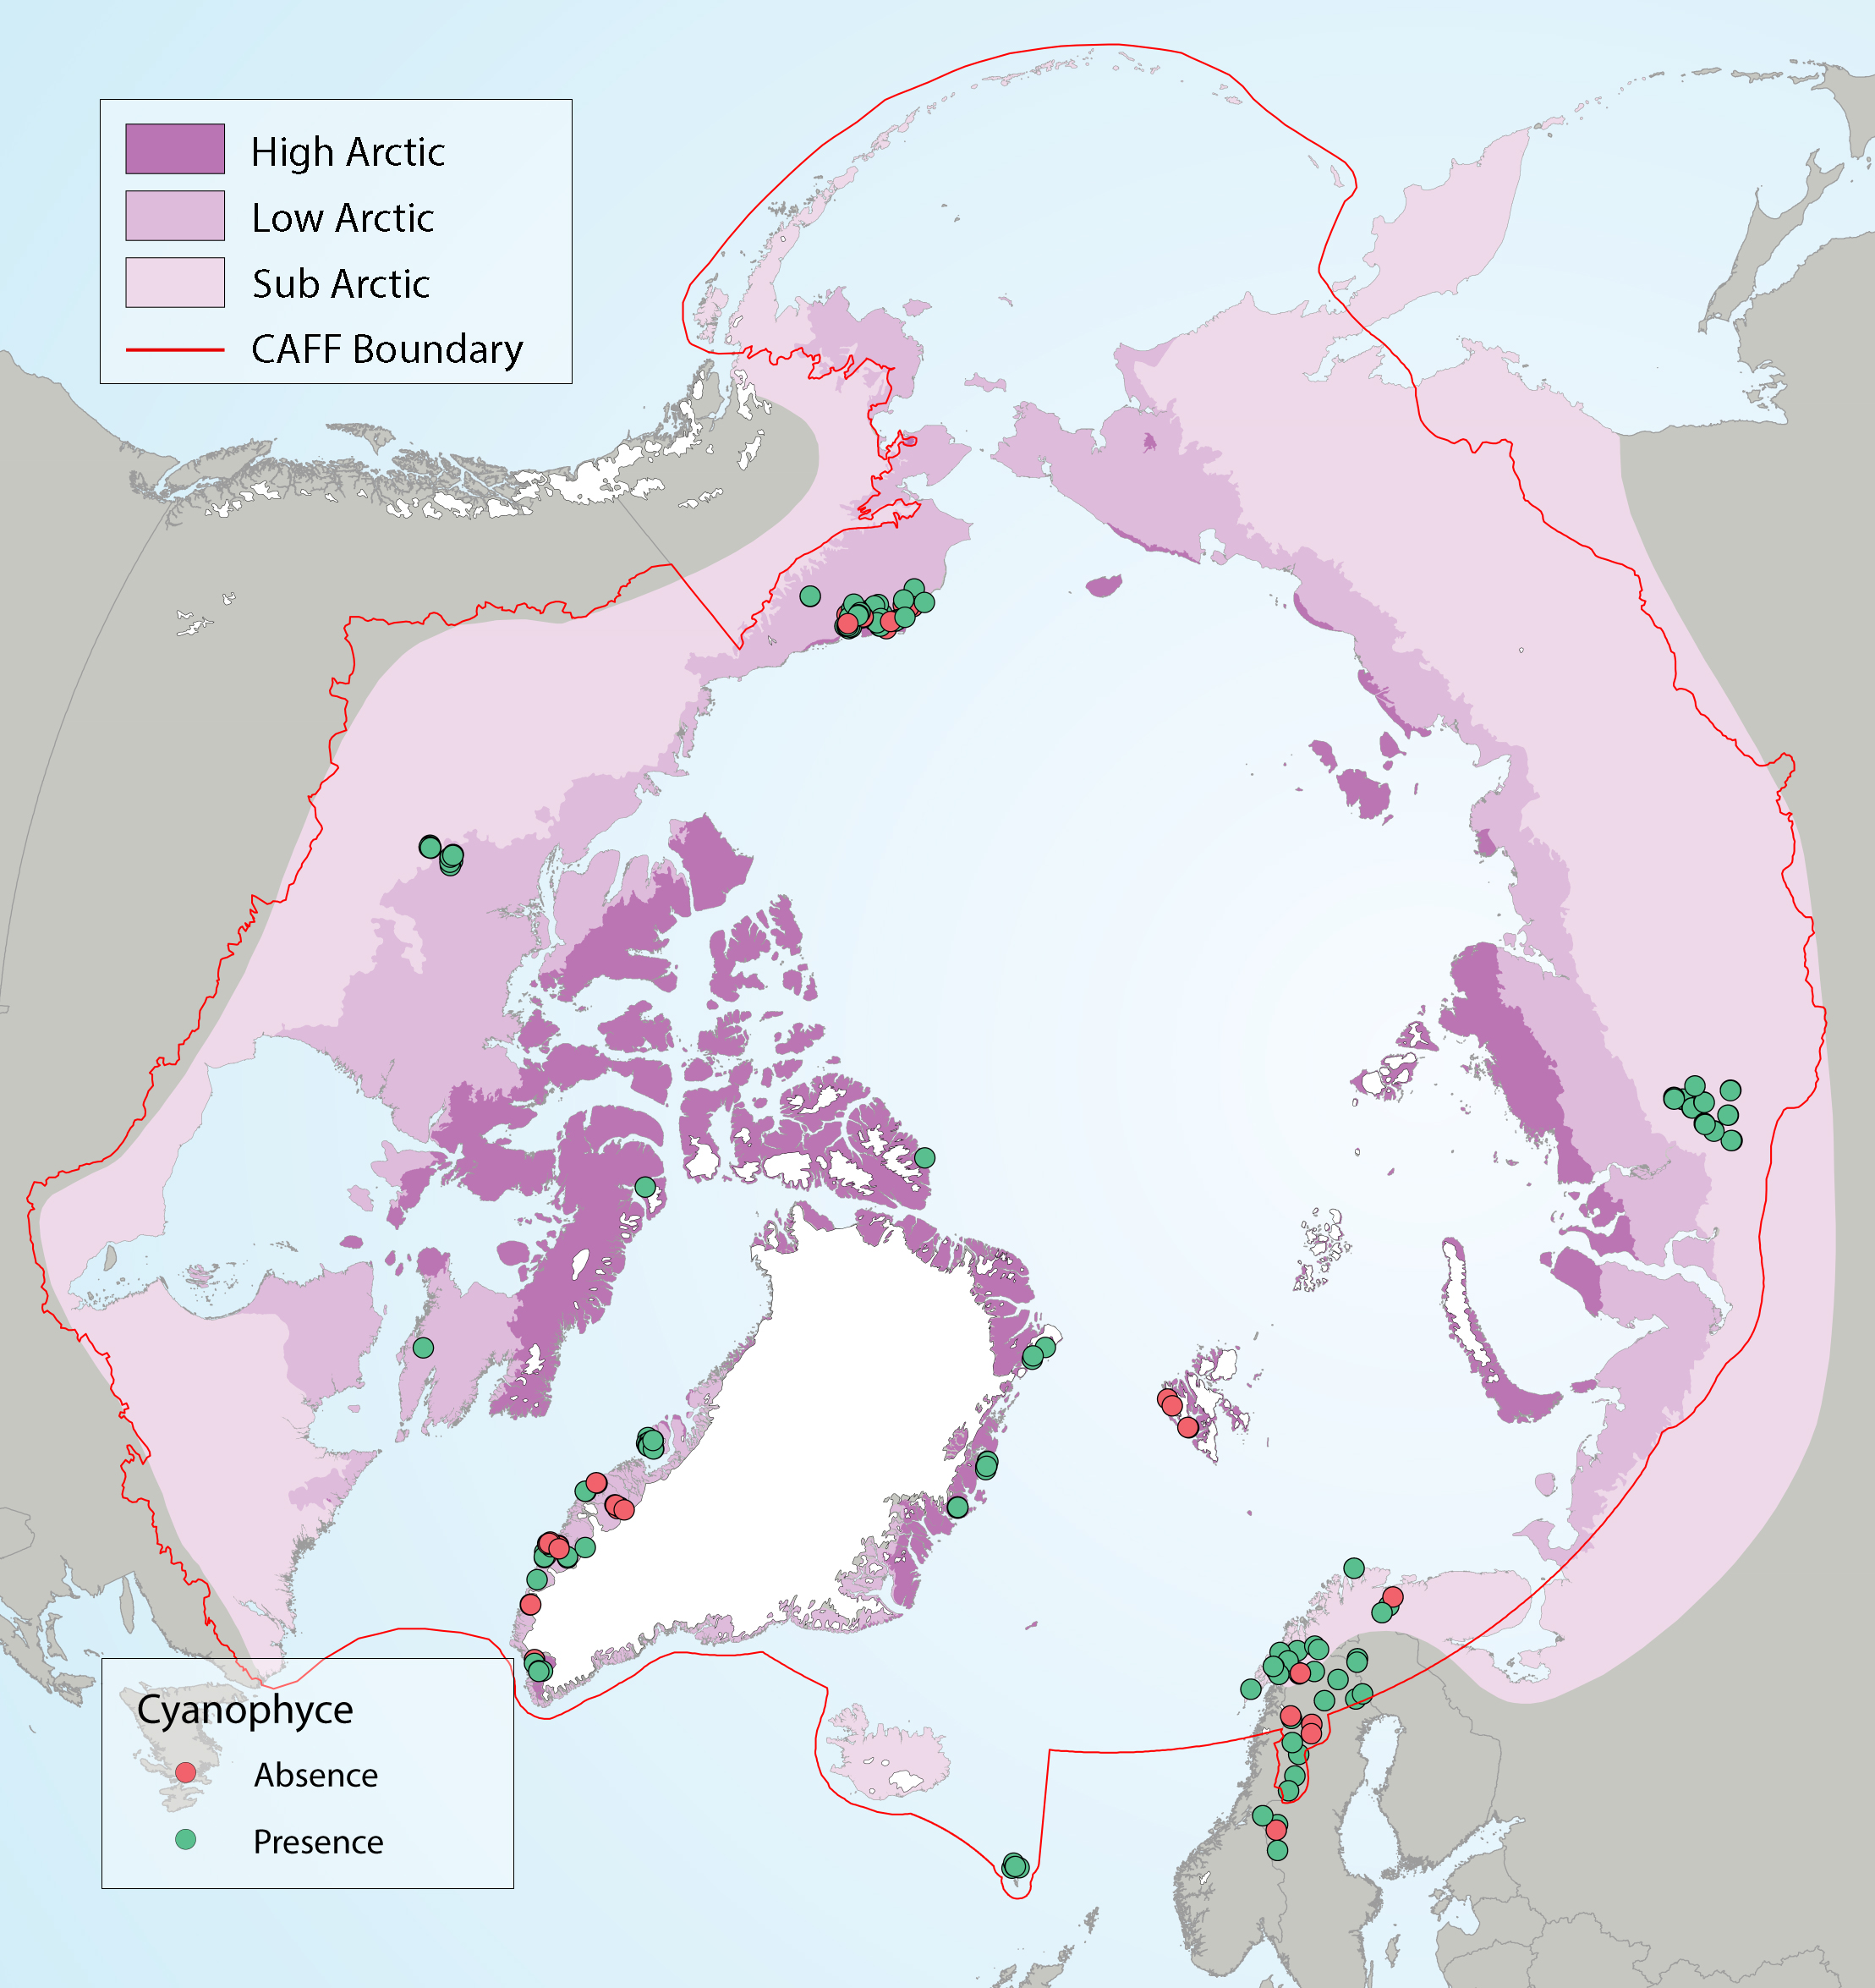
Circumpolar Arctic distribution of Cyanophyceae using presence- absence data from all sites sampled between 1980-2015. State of the Arctic Freshwater Biodiversity Report - Chapter 4 - Page 50 - Figure 4-21
-
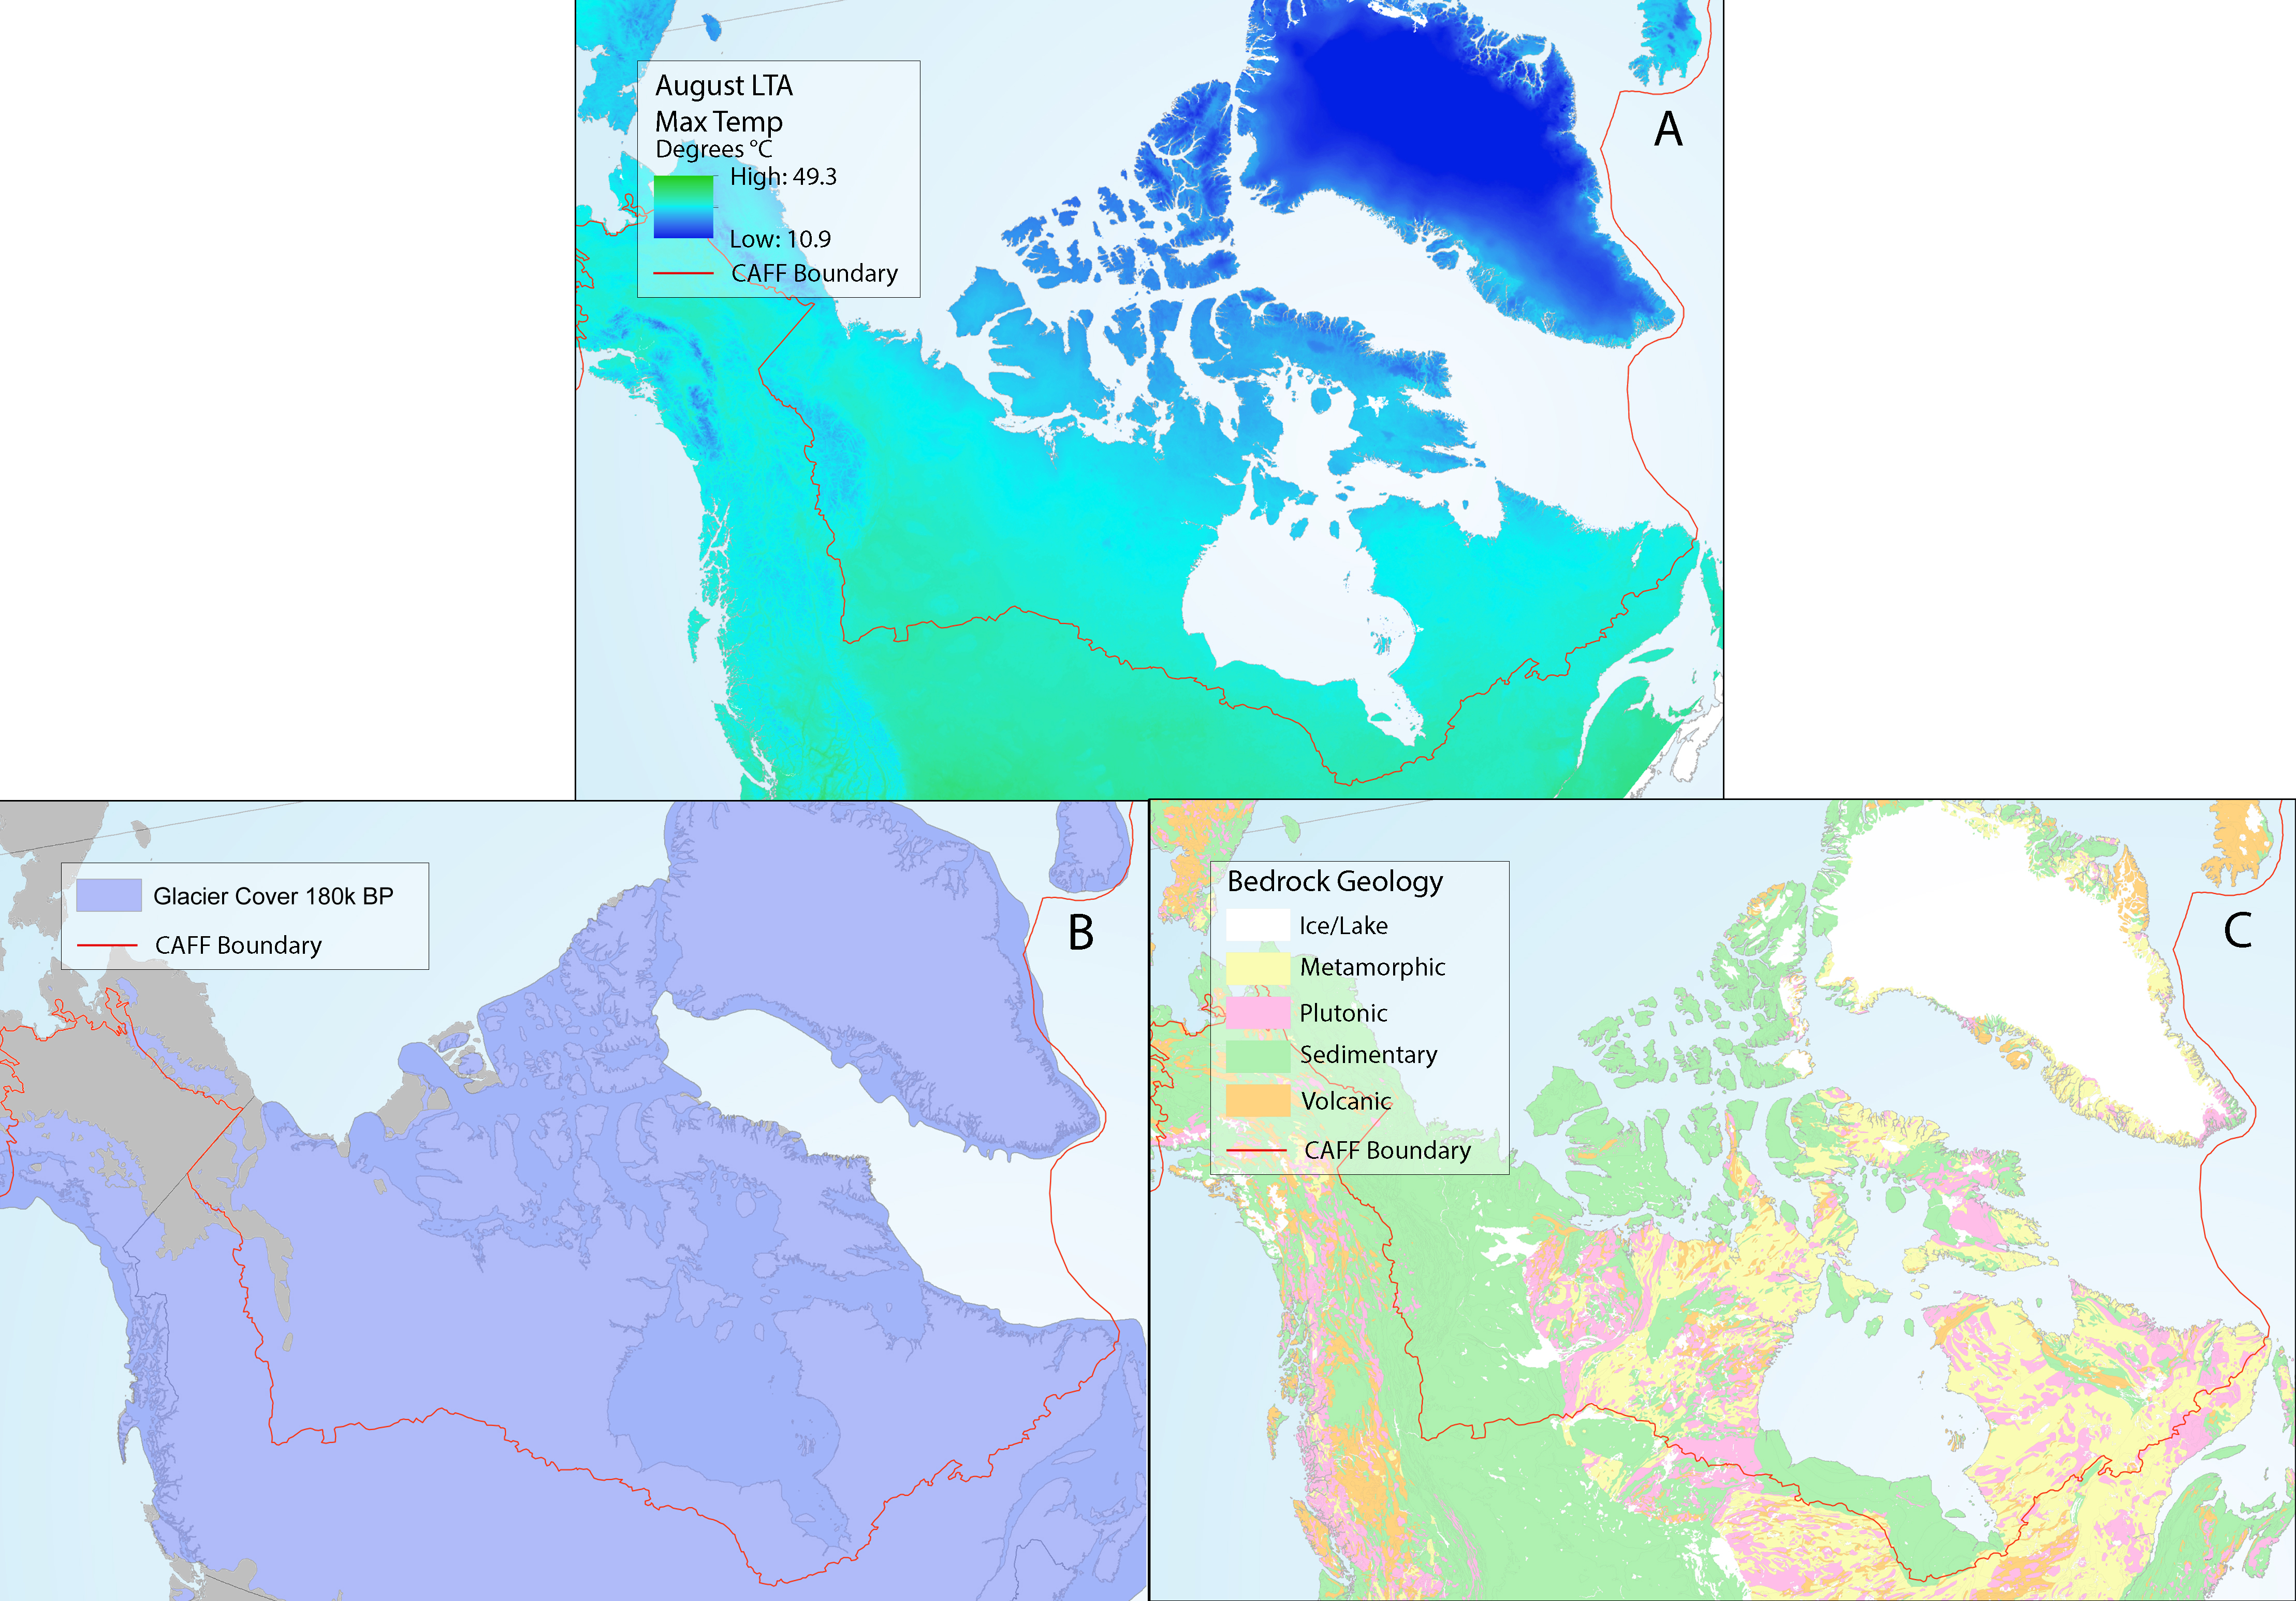
Abiotic drivers in North America, including (a) long-term average maximum August air temperature, (b) spatial distribution of ice sheets in the last glaciation of the North American Arctic region, and (c) geological setting of bedrock geology underlying North America. Panel (a) source Fick and Hijmans (2017). Panel (b) adapted from: Physical Geology by Steve Earle, freely available at http://open.bccampus.ca. Panel (c) source: Geogratis. State of the Arctic Freshwater Biodiversity Report - Chapter 5 - Page 86 - Figure 5-3
-
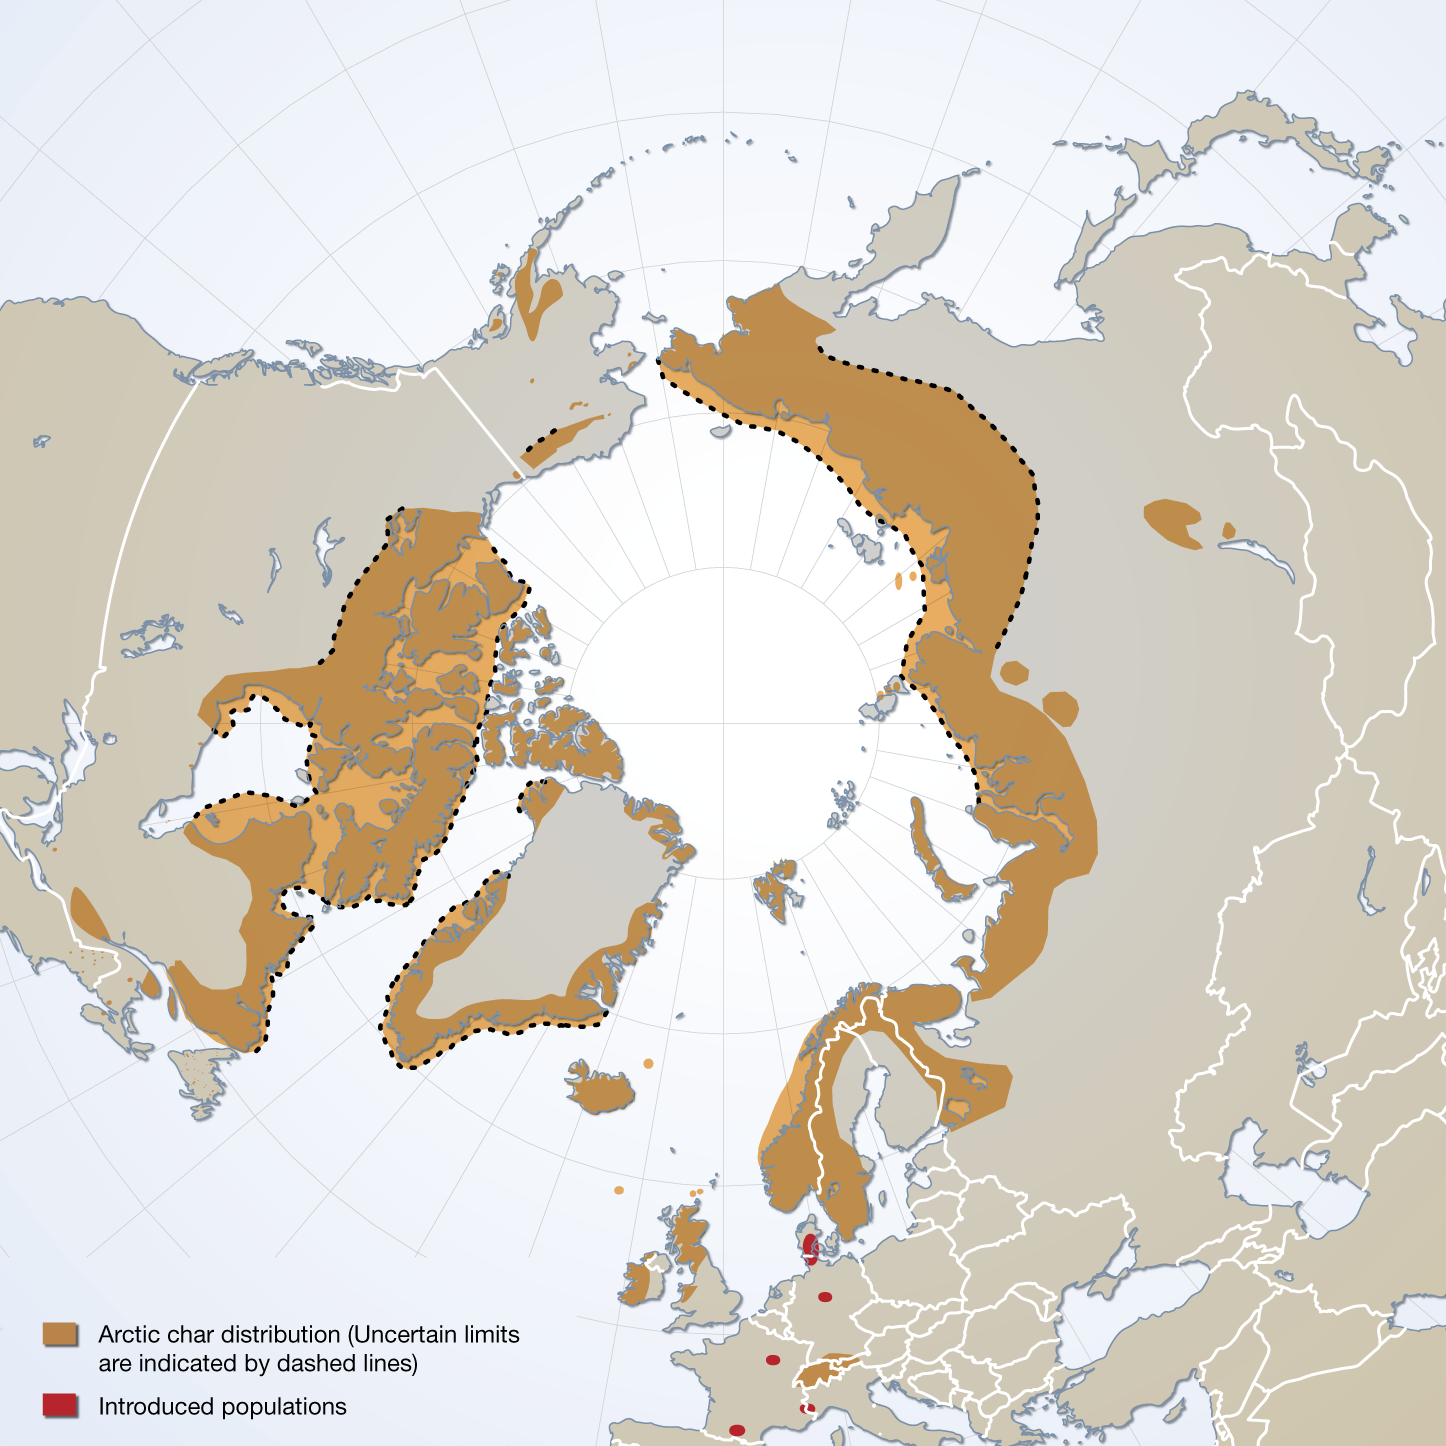
The distribution of Arctic char species complex, sensu stricto, and the location of introduced populations. Published in the Arctic Biodiversity trends 2010, Indicator #06 Arctic char, page 41 - released in May 2010
-
This report attempts to review the abundance, status and distribution of natural wild goose populations in the northern hemisphere. The report comprises three parts that 1) summarise key findings from the study and the methodology and analysis applied; 2) contain the individual accounts for each of the 68 populations included in this report; and 3) provide the datasets compiled for this study which will be made accessible on the Arctic Biodiversity Data Service.
-
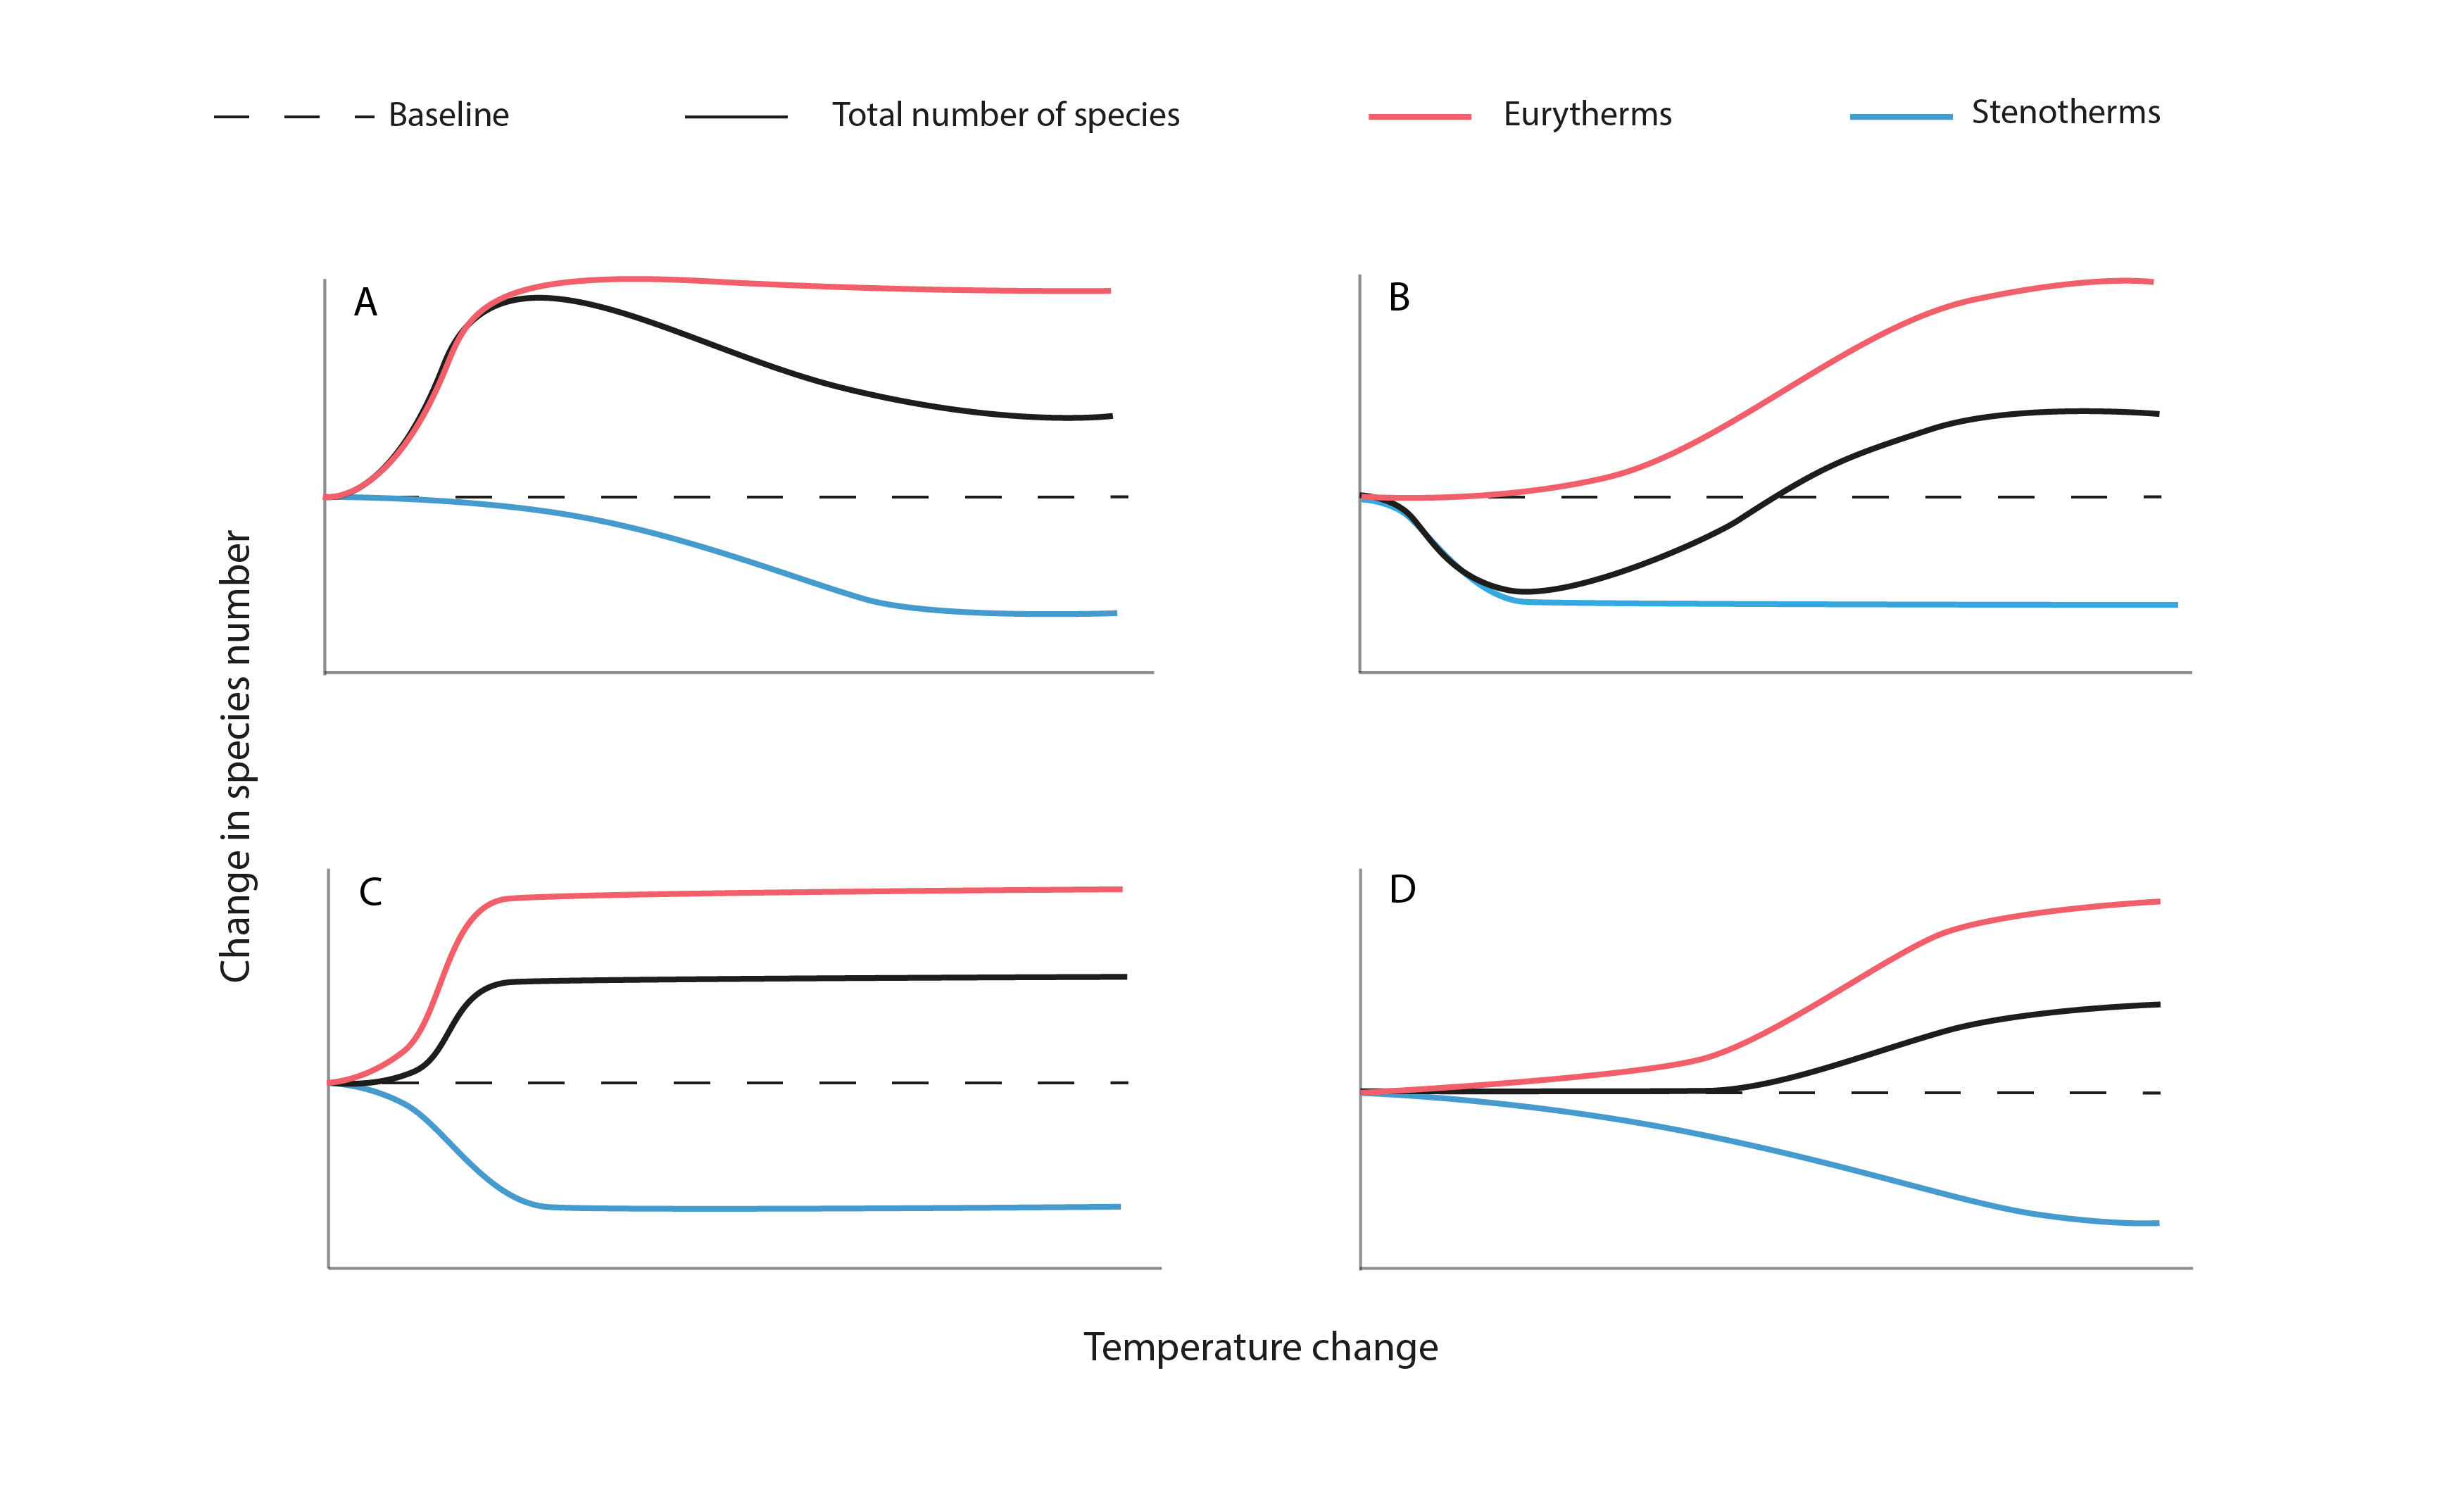
Figure 3-6. The hypothesized effects of rising mean water temperature on biodiversity (as total species number) of Arctic freshwater ecosystems. A pulsed increase in gamma biodiversity (a) results from the combination of high eurythermal invasion and establishment and low stenothermic loss with increasing water temperature. A pulsed decrease in gamma biodiversity (b) results from the combination of low eurythermal invasion and establishment and high stenothermic loss. Rapid increases (c) and slow increases (d) in species diversity occur, respectively, with high eurythermal invasion and establishment coupled with high stenothermic loss or low eurythermal invasion and establishment and low stenothermic loss as temperatures increase. For simplification, barriers to dispersal have been assumed to be limited in these models. State of the Arctic Freshwater Biodiversity Report - Chapter 3 - Page 23 - Figure 3-6
-
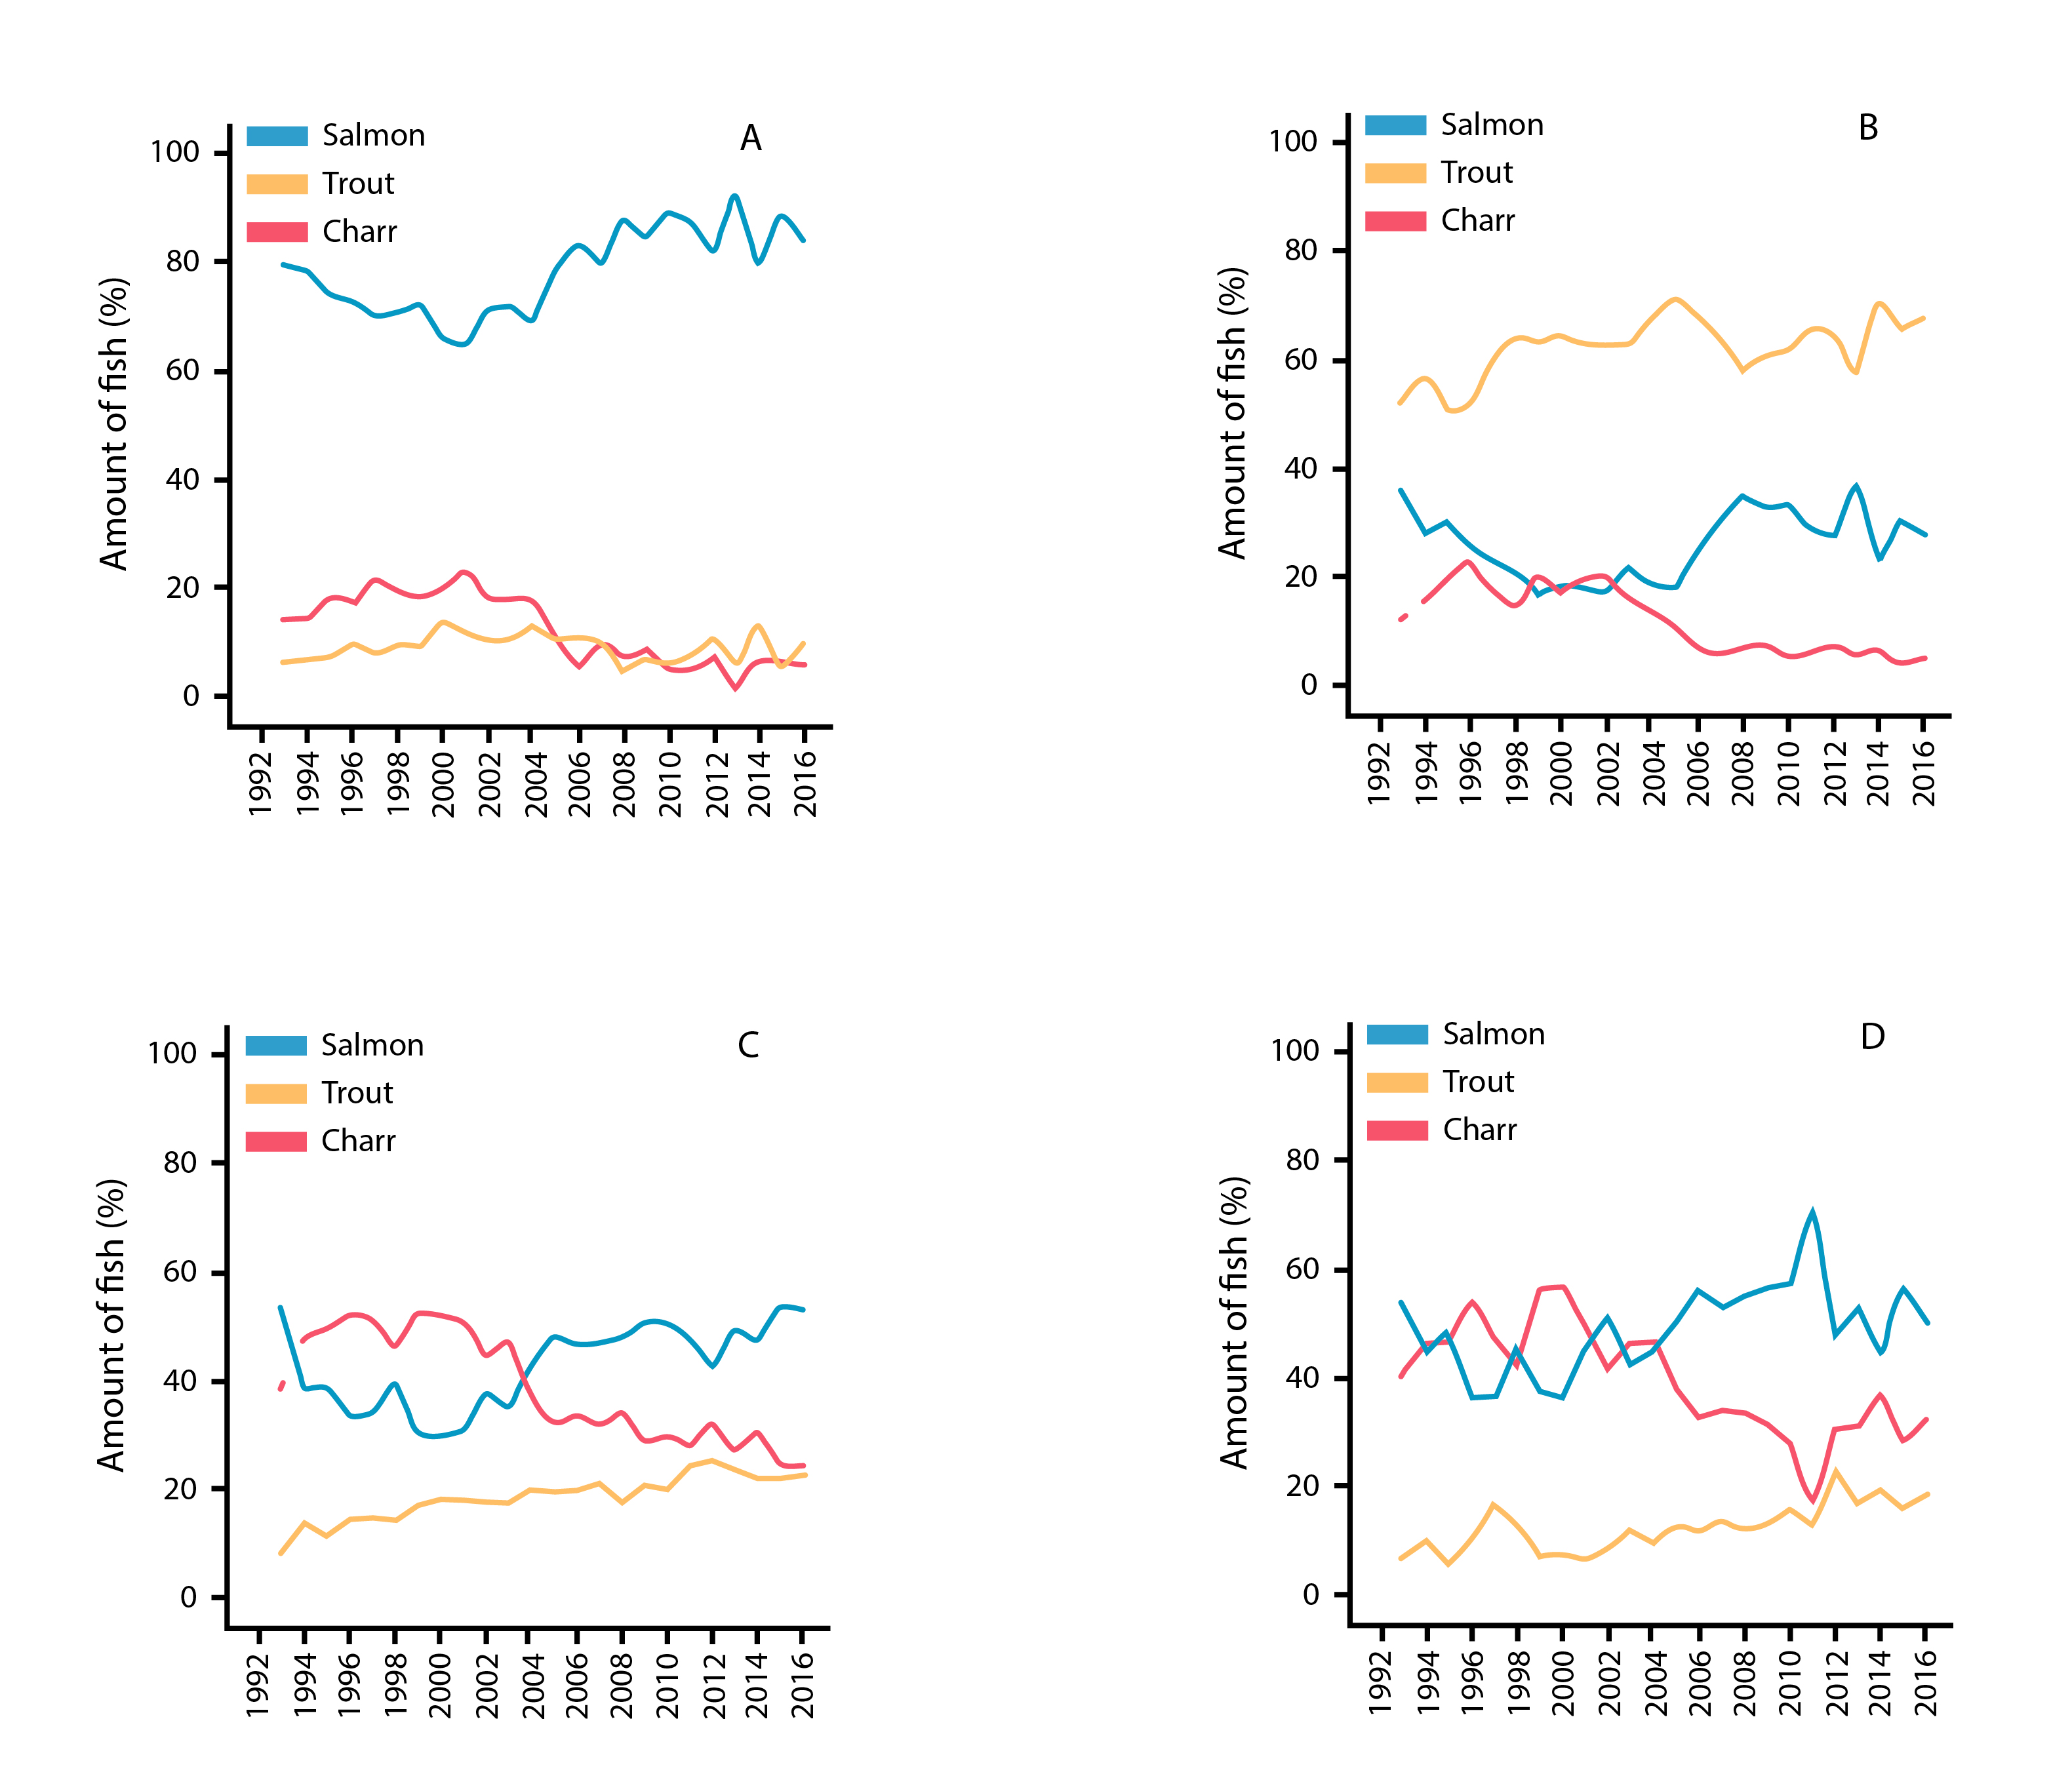
Temporal patterns in % abundance of Atlantic salmon, brown trout, and anadromous Arctic charr from catch statistics in Iceland rivers monitored from 1992 to 2016, showing results from (a) west, (b) south, (c) north, and (d) east Iceland. State of the Arctic Freshwater Biodiversity Report - Chapter 4 - Page 81 - Figure 4-41