 Arctic SDI catalogue
dataset
Type of resources
Available actions
Topics
Keywords
Contact for the resource
Provided by
Years
Formats
Representation types
Update frequencies
status
Scale
Resolution
-
Notagildi og orðskýringar: Skrá þar sem hver færsla, nefnd skiki (e. cadastral parcel), geymir bæði lýsandi og rúmfræðilegar upplýsingar um eigin legu á formi fláka, sem og upplýsingar um heimild skráningar og tengsl við eignarhald í gegnum landeignarnúmer. Afmörkun fláka er táknuð með tvívíðum hnitnum í samræmdu landshnitakerfi ISN93. Uppbygging: - Auðkenni skika er skikanúmer. - Auðkenni landeignar er landeignarnúmer. - Hver landeign samanstendur af einum eða fleiri skikum. - Sumir skikar eru í sameign fleiri landeigna. Þeir skikar eru auðkenndir með færslunni 999999 í dálki landeign_nr. Eigindalýsing: SKIKI_NR er hlaupandi upplýsingalaust auðkennisnúmer skika í landeignaskrá HMS. Aðallykill (PK). Skiki er landfræðileg heild, en LANDEIGN getur verið samsett úr einum eða fleiri skikum, hvort sem þeir liggja saman eða ekki. LANDEIGN_NR er landeignarnúmer SKIKA (afmörkunar) í séreign. Hlaupandi sex stafa auðkennisnúmer landeigna í HMS. Unnt er að afla frekari upplýsinga um landeignir á heimasíðu HMS, hms.is, eftir þessu númeri. SVEITARFELAG_NR - Númer þess sveitarfélags sem skikinn er skráður innan. DAGS_INN - Sú dagsetning er SKIKI (afmörkun) var fyrst skráður í landeignaskrá HMS. DAGS_LEIDR - Sú dagsetning er skráningu SKIKA (afmörkunar) var síðast breytt í landeignaskrá HMS. GAGNAEIGN – HMS er eigandi landeignaskrár. ADFERD_INN - Sú aðferð sem notuð var við að skrá gögnin í Landeignaskrá HMS. - 1 Óljóst. - 2 Innslegin hnit. - 3 Teiknað af þriðja aðila. - 4. Vörpuð gögn. NAKVAEMNI – Áætluð nákvæmni fitju. Tekur ávallt mið af lélegustu mælingu. HEIMILD – Tegund þeirrar heimildar sem fitja er skráð og teiknuð eftir. - 1 Annað/Óvíst. - 2 Landupplýsingakerfi sveitarfélaga. - 3 Þinglýst skjöl/Skjöl frá sveitarfélagi. ATHUGASEMD – Athugasemdir um innsetningu fitju eða heimildir hennar, gerðar af starfsfólki HMS. STADA_EIGN – Staða eignar í skrám HMS. - 1 Landeign er staðfest í landeignaskrá. - 2 Landeign er skráð í landeignaskrá en hefur verið tekin til vinnslu. - 3 Landeign er í frumvinnslu. HNIT – Afmörkun marghyrnings (POLYGON) á forminu „SDO_GEOMETRY“.
-

Notagildi: Reitakerfi eru nauðsynlegt til að birta upplýsingar sem af einhverjum ástæðum er ekki hægt að birta stakar s.s. vegna persónuverndar, umfangs verkefnis eða nákvæmni þeirra upplýsinga sem fyrir liggja. Reitakerfi Íslands er með mismunandi reitastærðum til að mæta mismunandi þörfum notenda við upplýsingamiðlun. Mælt er með notkun reitakerfisins m.a. þegar verið er að bera gögn saman milli stofnana. Reitakerfið er byggt á Lambert Azimuthal Equal Area vörpun sem tryggir að allir reitir sé jafn stórir. En það er helsta skilyrði þess að reitakerfið sé Inspire tækt. Viðmiðun er ISN 2004 Ef reitakerfið er notað í einhverjum af ISN Lambert vörpunum er það ferhyrnt. Orðskýringar: Heildarkerfið er nefnt reitakerfi. Hvert lag í því er nefnt net. Einingar í netinu eru nefndar reitir. Heiti reitana: Hver reitur hefur nafn sem er einkvæmt og er m.a. byggt upp á stærðareiningunni. 1km 10km og 100m skrárnar ná yfir strandlínu og eyjar landsins en 100km skráin nær yfir alla efnahagslögsöguna. grid_100k grid_50k grid_25k grid_10k grid_5k grid_2_5k grid_1k grid_500m grid_250m grid_100m Frekari tækniupplýsingar er að finna hér https://inspire.ec.europa.eu/id/document/tg/gg
-
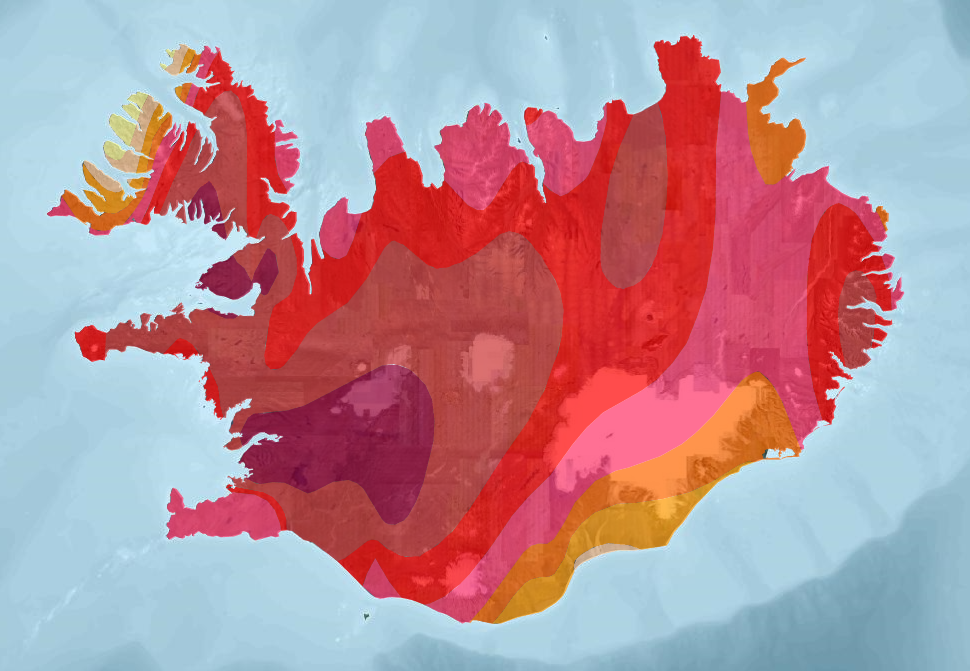
The dataset presents three layers of geothermal data from Iceland based on "Atlas of Geothermal Resources in Europe" (2002). Heat-flow density, Temperature at 1000 meters and Temperature at 2000 meters (1:10 000 000).
-
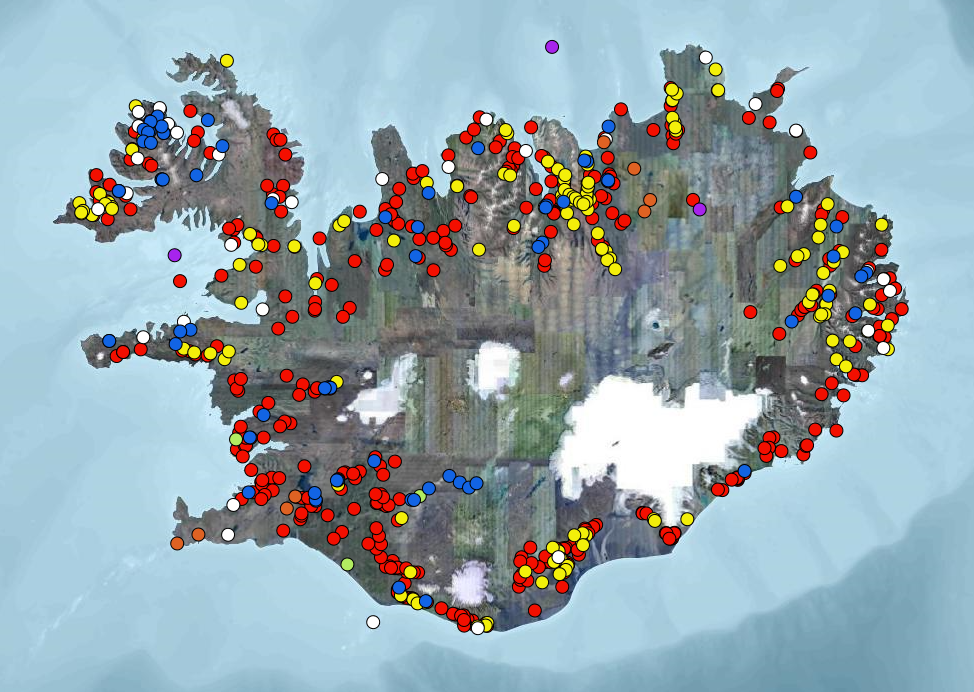
Staðsetningarhnit og upplýsingar um þau raforkuver / virkjanir á Íslandi sem selja raforku inn á landskerfið, auk díselstöðva sem framleiða allt árið. Vatnsafl, jarðvarmi, vindorka, eldsneyti og varaafl, auk upplýsinga um virkar og aflagðar heimarafstöðvar.
-

Hydrography (HY) Iceland is one of 12 themes in the European Location Project (ELF). The purpose of ELF is to create harmonised cross-border, cross-theme and cross-resolution pan-European reference data from national contributions. The goal is to provide INSPIRE-compliant data for Europe. A description of the ELF (European Location Project) is here: http://www.elfproject.eu/content/overview Encoding: INSPIRE version 4
-

ELF Geographical Names (GN) Iceland is one of 12 themes in the European Location Project (ELF). The purpose of ELF is to create harmonised cross-border, cross-theme and cross-resolution pan-European reference data from national contributions. The goal is to provide INSPIRE-compliant data for Europe. A description of the ELF (European Location Project) is here: http://www.elfproject.eu/content/overview Encoding: INSPIRE version 4
-

ELF Transport Networks (TN) Iceland is one of 12 themes in the European Location Project (ELF). The purpose of ELF is to create harmonised cross-border, cross-theme and cross-resolution pan-European reference data from national contributions. The goal is to provide INSPIRE-compliant data for Europe. A description of the ELF (European Location Project) is here: http://www.elfproject.eu/content/overview. The transport layer contains both line and polygons. The linelayer shows the transport network but the polygon layer contains the airports. Encoding: INSPIRE version 4
-

Administrative Units (AU) is one of 12 themes in the European Location Project (ELF). The purpose of ELF is to create harmonised cross-border, cross-theme and cross-resolution pan-European reference data from national contributions. The goal is to provide INSPIRE compliant data for Europe. A description of the ELF (European Location Project) is here: http://www.elfproject.eu/content/overview Encoding: INSPIRE version 4
-

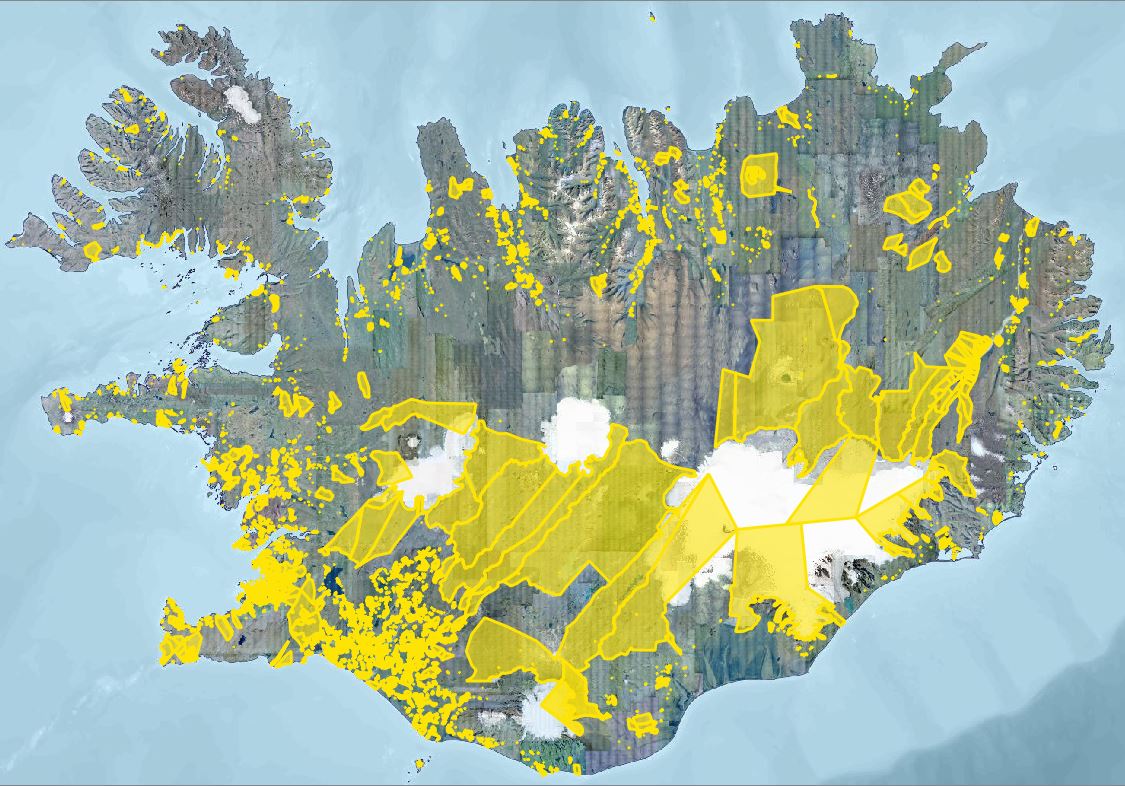
Corine Land Cover (CLC) 2012 and CLC change 2006-2012 are two of the datasets produced within the frame of the Initial Operations of the Copernicus programme (the European Earth monitoring programme previously known as GMES) on land monitoring.Corine Land Cover (CLC) provides consistent information on land cover and land cover changes across Europe. This inventory was initiated in 1985 (reference year 1990) and established a time series of land cover information with updates in 2000, 2006 and 2012 being the last one. CLC products are based on photointerpretation of satellite images by national teams of participating countries - the EEA member and cooperating countries – following a standard methodology and nomenclature with the following base parameters: 44 classes in the hierarchical three level Corine nomenclature; minimum mapping unit (MMU) for status layers is 25 hectares; minimum width of linear elements is 100 metres; minimum mapping unit (MMU) for Land Cover Changes (LCC) for the change layers is 5 hectares. The resulting national land cover inventories are further integrated into a seamless land cover map of Europe. Land cover and land use (LCLU) information is important not only for land change research, but also more broadly for the monitoring of environmental change, policy support, the creation of environmental indicators and reporting. CLC datasets provide important datasets supporting the implementation of key priority areas of the Environment Action Programmes of the European Union as protecting ecosystems, halting the loss of biological diversity, tracking the impacts of climate change, assessing developments in agriculture and implementing the EU Water Framework Directive, among others.More about the Corine Land Cover (CLC) and Copernicus land monitoring data in general can be found at http://land.copernicus.eu/.
-

The Corine Land Cover datasets CLC2000, CLC2006and CLC change 2000-2006areproduced within the frame of the GMES land monitoringproject.Corine Land Cover (CLC) provides consistent information on land cover and land cover changes across Europe. This inventory was initiated in 1985 (reference year 1990) and established a time series of land cover information with updates in 2000 and 2006.CLC products are based on photointerpretation of satellite images by national teams of participating countries - the EEA member and cooperating countries – following a standard methodology and nomenclature with the following base parameters: 44 classes in the hierarchical three level Corine nomenclature; minimum mapping unit (MMU) for status layers is 25 hectares; minimum width of linear elements is 100 metres; minimum mapping unit (MMU) for Land Cover Changes (LCC) for the change layers is 5 hectares. The resulting national land cover inventories are further integrated into a seamless land cover map of Europe.Land cover and land use (LCLU) information is important not only for land change research, but also more broadly for the monitoring of environmental change, policy support, the creation of environmental indicators and reporting. CLC datasets provide important datasets supporting the implementation of key priority areas of the Environment Action Programmes of the European Union as protecting ecosystems, halting the loss of biological diversity, tracking the impacts of climate change, assessing developments in agriculture and implementing the EU Water Framework Directive, among others.More about the Corine Land Cover (CLC) and Copernicus land monitoring data in general can be found at http://land.copernicus.eu/.