 Arctic SDI catalogue
National Terrestrial Ecosystem Monitoring System (NTEMS)
Type of resources
Available actions
Topics
Keywords
Contact for the resource
Provided by
Formats
Representation types
Update frequencies
status
-

High resolution forest change for Canada (Binary Change/No-change) The forest change data included in this product is national in scope (entire forested ecosystem) and represents the first wall-to-wall characterization of wildfire and harvest in Canada at a spatial resolution commensurate with human impacts. It is developed within the framework of Canada’s National Terrestrial Ecosystem Monitoring System (NTEMS). The information outcomes represent 25 years of stand replacing change in Canada’s forests, derived from a single, consistent spatially-explicit data source, derived in a fully automated manner. This demonstrated capacity to characterize forests at a resolution that captures human impacts is key to establishing a baseline for detailed monitoring of forested ecosystems from management and science perspectives. Time series of Landsat data were used to characterize national trends in stand replacing forest disturbances caused by wildfire and harvest for the period 1985–2010 for Canada's 650 million hectare forested ecosystems (https://authors.elsevier.com/sd/article/S0034425717301360 ). Landsat data has a 30m spatial resolution, so the change information is highly detailed and is commensurate with that of human impacts. These data represent annual stand replacing forest changes. The stand replacing disturbances types labeled are wildfire and harvest, with lower confidence wildfire and harvest, also shared. The distinction and sharing of lower class membership likelihoods is to indicate to users that some change events were more difficult to allocate to a change type, but are generally found to be in the correct category. For an overview on the data, image processing, and time series change detection methods applied, as well as information on independent accuracy assessment of the data, see Hermosilla et al. (2016; http://www.tandfonline.com/doi/full/10.1080/17538947.2016.1187673). The data available is, 1. a binary change/no-change; 2. Change year; and, 3. Change type. When using this data, please cite as: White, J.C., M.A. Wulder, T. Hermosilla, N.C. Coops, and G. Hobart. (2017). A nationwide annual characterization of 25 years of forest disturbance and recovery for Canada using Landsat time series. Remote Sensing of Environment. 192: 303-321. DOI: 10.1016/j.rse.2017.03.035. https://authors.elsevier.com/sd/article/S0034425717301360 Geographic extent: Canada's forested ecosystems (~ 650 Mha) Time period: 1985–2010
-

This dataset provides wall-to-wall maps of forest structure across Canada's 650 million hectare forested ecosystems for the year 2022, generated at a spatial resolution of 30 m. It is developed within the framework of Canada’s National Terrestrial Ecosystem Monitoring System (NTEMS). Structure estimates include key attributes such as canopy height, canopy cover, and aboveground biomass, derived using a combination of airborne lidar and Landsat-based spectral composites. Structure models were trained using the - lidar-plot framework - (Wulder et al. 2012), which integrates co-located airborne lidar data and ground plot measurements with Landsat time-series composites (Hermosilla et al. 2016). A Nearest Neighbour imputation approach was applied to estimate structural attributes across the full extent of Canada's forested area. These nationally consistent products are intended to support strategic-level forest monitoring and assessment and are not designed for operational forest management. For further details on the methods, accuracy assessment, and source data, see Matasci et al. (2018). Matasci, G., Hermosilla, T., Wulder, M.A., White, J.C., Coops, N.C., Hobart, G.W., Bolton, D.K., Tompalski, P., Bater, C.W., 2018. Three decades of forest structural dynamics over Canada's forested ecosystems using Landsat time-series and lidar plots. Remote Sensing of Environment, 216, 697-714. https://doi.org/10.1016/j.rse.2018.07.024 (Matasci et al. 2018)
-
Forest Elevation(Ht) Covariance 2015 Coefficient of variation of first returns height (%). Represents the variability in canopy heights relative to the mean canopy height. It is developed within the framework of Canada’s National Terrestrial Ecosystem Monitoring System (NTEMS). Products relating the structure of Canada's forested ecosystems have been generated and made openly accessible. The shared products are based upon peer-reviewed science and relate aspects of forest structure including: (i) metrics calculated directly from the lidar point cloud with heights normalized to heights above the ground surface (e.g., canopy cover, height), and (ii) modelled inventory attributes, derived using an area-based approach generated by using co-located ground plot and ALS data (e.g., volume, biomass). Forest structure estimates were generated by combining information from lidar plots (Wulder et al. 2012) with Landsat pixel-based composites (White et al. 2014; Hermosilla et al. 2016) using a nearest neighbour imputation approach with a Random Forests-based distance metric. These products were generated for strategic-level forest monitoring information needs and are not intended to support operational-level forest management. All products have a spatial resolution of 30 m. For a detailed description of the data, methods applied, and accuracy assessment results see Matasci et al. (2018). When using this data, please cite as follows: Matasci, G., Hermosilla, T., Wulder, M.A., White, J.C., Coops, N.C., Hobart, G.W., Bolton, D.K., Tompalski, P., Bater, C.W., 2018b. Three decades of forest structural dynamics over Canada's forested ecosystems using Landsat time-series and lidar plots. Remote Sensing of Environment 216, 697-714. Matasci et al. 2018) Geographic extent: Canada's forested ecosystems (~ 650 Mha) Time period: 1985–2011
-

Wildfire change year 1985-2022. Wildfire changes occurred from 1985 to 2022 displaying the year of greatest wildfire disturbance. It is developed within the framework of Canada’s National Terrestrial Ecosystem Monitoring System (NTEMS). The information outcomes represent 38 years of wildfires in Canada's forests, derived from a single, consistent, spatially explicit data source in a fully automated manner. Time series of Landsat data with 30 m spatial resolution were used to characterize national trends in stand replacing forest disturbances caused by wildfire for the period 1985-2022 for Canada's 650-million-hectare forested ecosystems. When using this data, please cite as: Hermosilla, T., M.A. Wulder, J.C. White, N.C. Coops, G.W. Hobart, L.B. Campbell, 2016. Mass data processing of time series Landsat imagery: pixels to data products for forest monitoring. International Journal of Digital Earth 9(11), 1035-1054. https://doi.org/10.1080/17538947.2016.1187673 (Hermosilla et al. 2016). See references below for an overview on the data processing, metric calculation, change attribution, and time series change detection methods applied, as well as information on independent accuracy assessment of the data.. Hermosilla, T., Wulder, M. A., White, J. C., Coops, N.C., Hobart, G.W., (2015). An integrated Landsat time series protocol for change detection and generation of annual gap-free surface reflectance composites. Remote Sensing of Environment 158, 220-234. https://doi.org/10.1016/j.rse.2014.11.005 (Hermosilla et al. 2015a). Hermosilla, T., Wulder, M.A., White, J.C., Coops, N.C., Hobart, G.W., (2015). Regional detection, characterization, and attribution of annual forest change from 1984 to 2012 using Landsat-derived time-series metrics. Remote Sensing of Environment 170, 121-132. https://doi.org/10.1016/j.rse.2015.09.004 (Hermosilla et al. 2015b). Hermosilla, T., M.A. Wulder, J.C. White, N.C. Coops, G. W. Hobart, (2017). Updating Landsat time series of surface-reflectance composites and forest change products with new observations. International Journal of Applied Earth Observation and Geoinformation. 63,104-111. https://doi.org/10.1016/j.jag.2017.07.013 (Hermosilla et al. 2017).
-

This dataset provides wall-to-wall maps of forest structure across Canada's 650 million hectare forested ecosystems for the year 2022, generated at a spatial resolution of 30 m. It is developed within the framework of Canada’s National Terrestrial Ecosystem Monitoring System (NTEMS). Structure estimates include key attributes such as canopy height, canopy cover, and aboveground biomass, derived using a combination of airborne lidar and Landsat-based spectral composites. Structure models were trained using the - lidar-plot framework - (Wulder et al. 2012), which integrates co-located airborne lidar data and ground plot measurements with Landsat time-series composites (Hermosilla et al. 2016). A Nearest Neighbour imputation approach was applied to estimate structural attributes across the full extent of Canada's forested area. These nationally consistent products are intended to support strategic-level forest monitoring and assessment and are not designed for operational forest management. For further details on the methods, accuracy assessment, and source data, see Matasci et al. (2018). Matasci, G., Hermosilla, T., Wulder, M.A., White, J.C., Coops, N.C., Hobart, G.W., Bolton, D.K., Tompalski, P., Bater, C.W., 2018. Three decades of forest structural dynamics over Canada's forested ecosystems using Landsat time-series and lidar plots. Remote Sensing of Environment, 216, 697-714. https://doi.org/10.1016/j.rse.2018.07.024 (Matasci et al. 2018)
-
This dataset provides wall-to-wall maps of forest structure across Canada's 650 million hectare forested ecosystems for the year 2022, generated at a spatial resolution of 30 m.It is developed within the framework of Canada’s National Terrestrial Ecosystem Monitoring System (NTEMS). Structure estimates include key attributes such as canopy height, canopy cover, and aboveground biomass, derived using a combination of airborne lidar and Landsat-based spectral composites. Structure models were trained using the - lidar-plot framework - (Wulder et al. 2012), which integrates co-located airborne lidar data and ground plot measurements with Landsat time-series composites (Hermosilla et al. 2016). A Nearest Neighbour imputation approach was applied to estimate structural attributes across the full extent of Canada's forested area. These nationally consistent products are intended to support strategic-level forest monitoring and assessment and are not designed for operational forest management. For further details on the methods, accuracy assessment, and source data, see Matasci et al. (2018). Matasci, G., Hermosilla, T., Wulder, M.A., White, J.C., Coops, N.C., Hobart, G.W., Bolton, D.K., Tompalski, P., Bater, C.W., 2018. Three decades of forest structural dynamics over Canada's forested ecosystems using Landsat time-series and lidar plots. Remote Sensing of Environment, 216, 697-714. https://doi.org/10.1016/j.rse.2018.07.024 (Matasci et al. 2018)
-

Forest Elevation(Ht) Stddev 2015 Standard deviation of height of lidar first returns (m). Represents the variability in canopy heights. It is developed within the framework of Canada’s National Terrestrial Ecosystem Monitoring System (NTEMS). Products relating the structure of Canada's forested ecosystems have been generated and made openly accessible. The shared products are based upon peer-reviewed science and relate aspects of forest structure including: (i) metrics calculated directly from the lidar point cloud with heights normalized to heights above the ground surface (e.g., canopy cover, height), and (ii) modelled inventory attributes, derived using an area-based approach generated by using co-located ground plot and ALS data (e.g., volume, biomass). Forest structure estimates were generated by combining information from lidar plots (Wulder et al. 2012) with Landsat pixel-based composites (White et al. 2014; Hermosilla et al. 2016) using a nearest neighbour imputation approach with a Random Forests-based distance metric. These products were generated for strategic-level forest monitoring information needs and are not intended to support operational-level forest management. All products have a spatial resolution of 30 m. For a detailed description of the data, methods applied, and accuracy assessment results see Matasci et al. (2018). When using this data, please cite as follows: Matasci, G., Hermosilla, T., Wulder, M.A., White, J.C., Coops, N.C., Hobart, G.W., Bolton, D.K., Tompalski, P., Bater, C.W., 2018b. Three decades of forest structural dynamics over Canada's forested ecosystems using Landsat time-series and lidar plots. Remote Sensing of Environment 216, 697-714. Matasci et al. 2018) Geographic extent: Canada's forested ecosystems (~ 650 Mha) Time period: 1985–2011
-

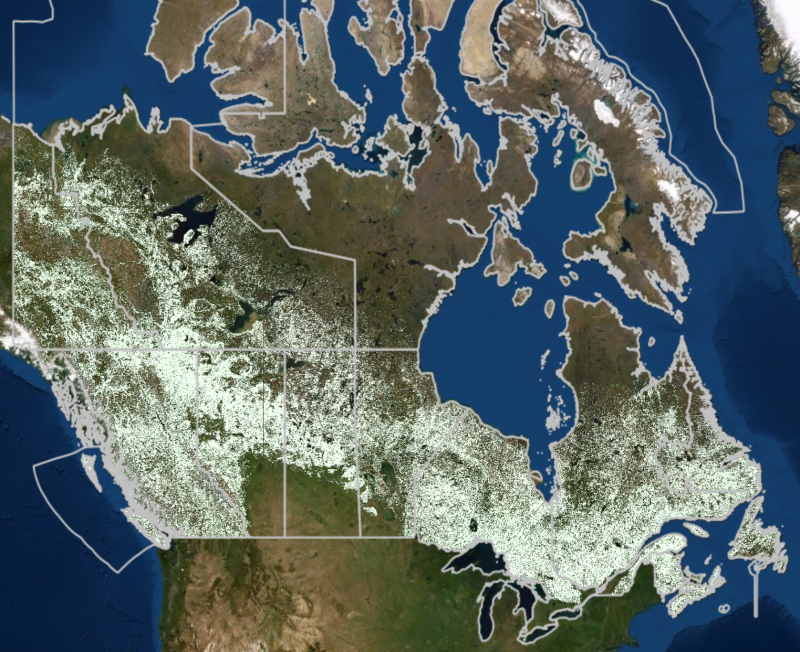
High-resolution false-color Landsat image composite of Canada's forested ecosystems (2022). This national image product represents the Composite to Change (C2C) proxy composite image derived from thousands of Landsat images acquired between July 1 and August 30, 2022. It is developed within the framework of Canada’s National Terrestrial Ecosystem Monitoring System (NTEMS). The overall process followed is described in (Hermosilla et al. 2016 ) with details on the generation of gap-free surface reflectance composites in ( Hermosilla et al. 2015). Following the motivation and rationale presented in White et al. (White et al. 2014), Landsat imagery is subjected to a series of processing steps to remove clouds and shadows as well as haze and other unwanted atmospheric effects. Year-on-year time series of Landsat imagery are interrogated to avoid missing values, and to ensure exhaustive spatial coverage of the national surface reflectance composites. False-colour 3-channel image (bands: shortwave infrared, SWIR1; near infrared; red) When using these data, please cite as: Hermosilla, T., M.A. Wulder, J.C. White, N.C. Coops, G.W. Hobart, L.B. Campbell, 2016. Mass data processing of time series Landsat imagery: pixels to data products for forest monitoring. International Journal of Digital Earth 9(11), 1035-1054 (Hermosilla et al. 2016 ).
-

Forest Elevation(Ht) Mean 2015 Mean height of lidar first returns (m). Represents the mean canopy height. It is developed within the framework of Canada’s National Terrestrial Ecosystem Monitoring System (NTEMS). Products relating the structure of Canada's forested ecosystems have been generated and made openly accessible. The shared products are based upon peer-reviewed science and relate aspects of forest structure including: (i) metrics calculated directly from the lidar point cloud with heights normalized to heights above the ground surface (e.g., canopy cover, height), and (ii) modelled inventory attributes, derived using an area-based approach generated by using co-located ground plot and ALS data (e.g., volume, biomass). Forest structure estimates were generated by combining information from lidar plots (Wulder et al. 2012) with Landsat pixel-based composites (White et al. 2014; Hermosilla et al. 2016) using a nearest neighbour imputation approach with a Random Forests-based distance metric. These products were generated for strategic-level forest monitoring information needs and are not intended to support operational-level forest management. All products have a spatial resolution of 30 m. For a detailed description of the data, methods applied, and accuracy assessment results see Matasci et al. (2018). When using this data, please cite as follows: Matasci, G., Hermosilla, T., Wulder, M.A., White, J.C., Coops, N.C., Hobart, G.W., Bolton, D.K., Tompalski, P., Bater, C.W., 2018b. Three decades of forest structural dynamics over Canada's forested ecosystems using Landsat time-series and lidar plots. Remote Sensing of Environment 216, 697-714. Matasci et al. 2018) Wulder et al. 2018) Geographic extent: Canada's forested ecosystems (~ 650 Mha) Time period: 1985–2011
-

This dataset provides wall-to-wall maps of forest structure across Canada's 650 million hectare forested ecosystems for the year 2022, generated at a spatial resolution of 30 m. It is developed within the framework of Canada’s National Terrestrial Ecosystem Monitoring System (NTEMS). Structure estimates include key attributes such as canopy height, canopy cover, and aboveground biomass, derived using a combination of airborne lidar and Landsat-based spectral composites. Structure models were trained using the - lidar-plot framework - (Wulder et al. 2012), which integrates co-located airborne lidar data and ground plot measurements with Landsat time-series composites (Hermosilla et al. 2016). A Nearest Neighbour imputation approach was applied to estimate structural attributes across the full extent of Canada's forested area. These nationally consistent products are intended to support strategic-level forest monitoring and assessment and are not designed for operational forest management. For further details on the methods, accuracy assessment, and source data, see Matasci et al. (2018). Matasci, G., Hermosilla, T., Wulder, M.A., White, J.C., Coops, N.C., Hobart, G.W., Bolton, D.K., Tompalski, P., Bater, C.W., 2018. Three decades of forest structural dynamics over Canada's forested ecosystems using Landsat time-series and lidar plots. Remote Sensing of Environment, 216, 697-714. https://doi.org/10.1016/j.rse.2018.07.024 (Matasci et al. 2018)