 Arctic SDI catalogue
Forests
Type of resources
Available actions
Topics
Keywords
Contact for the resource
Provided by
Formats
Representation types
Update frequencies
status
Resolution
-

High resolution forest change for Canada (Binary Change/No-change) 1985-2011 The forest change data included in this product is national in scope (entire forested ecosystem) and represents the first wall-to-wall characterization of wildfire and harvest in Canada at a spatial resolution commensurate with human impacts. The information outcomes represent 27 years of stand replacing change in Canada’s forests, derived from a single, consistent spatially-explicit data source, derived in a fully automated manner. This demonstrated capacity to characterize forests at a resolution that captures human impacts is key to establishing a baseline for detailed monitoring of forested ecosystems from management and science perspectives. Time series of Landsat data were used to characterize national trends in stand replacing forest disturbances caused by wildfire and harvest for the period 1985–2011 for Canada's 650 million hectare forested ecosystems (https://authors.elsevier.com/sd/article/S0034425717301360 ). Landsat data has a 30m spatial resolution, so the change information is highly detailed and is commensurate with that of human impacts. These data represent annual stand replacing forest changes. The stand replacing disturbances types labeled are wildfire and harvest, with lower confidence wildfire and harvest, also shared. The distinction and sharing of lower class membership likelihoods is to indicate to users that some change events were more difficult to allocate to a change type, but are generally found to be in the correct category. For an overview on the data, image processing, and time series change detection methods applied, as well as information on independent accuracy assessment of the data, see Hermosilla et al. (2016; http://www.tandfonline.com/doi/full/10.1080/17538947.2016.1187673). The data available is, 1. a binary change/no-change; 2. Change year; and, 3. Change type. When using this data, please cite as: White, J.C., M.A. Wulder, T. Hermosilla, N.C. Coops, and G. Hobart. (2017). A nationwide annual characterization of 25 years of forest disturbance and recovery for Canada using Landsat time series. Remote Sensing of Environment. 192: 303-321. DOI: 10.1016/j.rse.2017.03.035. https://authors.elsevier.com/sd/article/S0034425717301360 Geographic extent: Canada's forested ecosystems (~ 650 Mha) Time period: 1985–2011
-
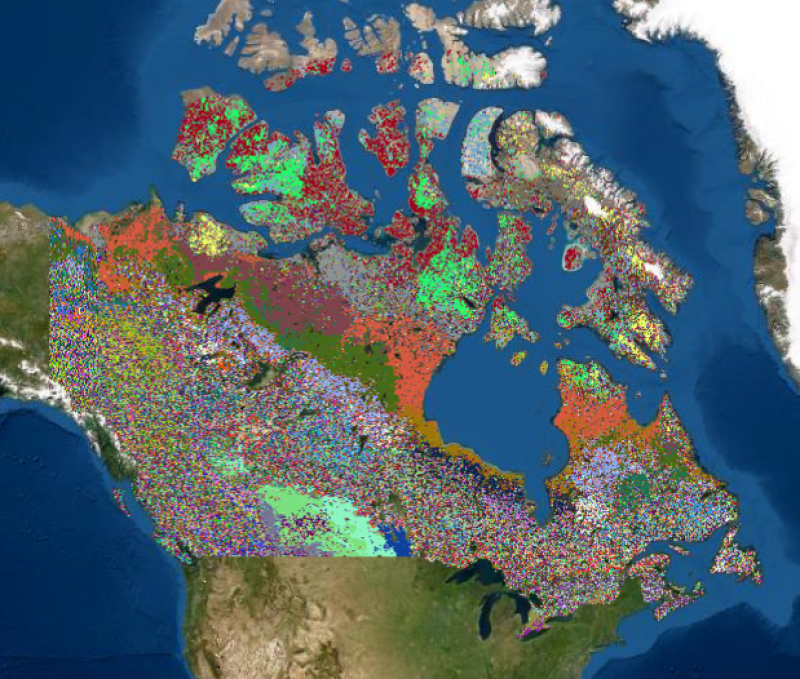
100 Class - Canadian Ecological Domain Classification from Satellite Data. Satellite derived data including 1) topography, 2) landscape productivity based on photosynthetic activity, and 3) land cover were used as inputs to create an environmental regionalization of the over 10 million km2 of Canada’s terrestrial land base. The outcomes of this clustering consists of three main outputs. An initial clustering of 100 classes was generated using a two-stage multivariate classification process. Next, an agglomerative hierarchy using a log-likelihood distance measure was applied to create a 40 and then a 14 class regionalization, aimed to meaningfully group ecologically similar components of Canada's terrestrial landscape. For more information (including a graphical illustration of the cluster hierarchy) and to cite this data please use: Coops, N.C., Wulder, M.A., Iwanicka, D. 2009. An environmental domain classification of Canada using earth observation data for biodiversity assessment. Ecological Informatics, Vol. 4, No. 1, Pp. 8-22, DOI: https://doi.org/10.1016/j.ecoinf.2008.09.005. ( Coops et al. 2009).
-
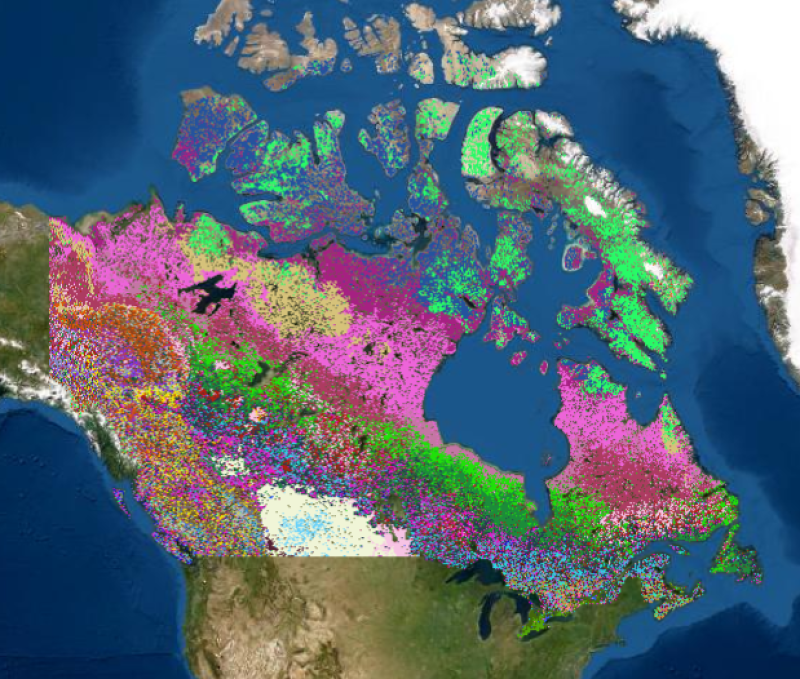
40 Class - Canadian Ecological Domain Classification from Satellite Data. Satellite derived data including 1) topography, 2) landscape productivity based on photosynthetic activity, and 3) land cover were used as inputs to create an environmental regionalization of the over 10 million km2 of Canada’s terrestrial land base. The outcomes of this clustering consists of three main outputs. An initial clustering of 100 classes was generated using a two-stage multivariate classification process. Next, an agglomerative hierarchy using a log-likelihood distance measure was applied to create a 40 and then a 14 class regionalization, aimed to meaningfully group ecologically similar components of Canada's terrestrial landscape. For more information (including a graphical illustration of the cluster hierarchy) and to cite this data please use: Coops, N.C., Wulder, M.A., Iwanicka, D. 2009. An environmental domain classification of Canada using earth observation data for biodiversity assessment. Ecological Informatics, Vol. 4, No. 1, Pp. 8-22, DOI: https://doi.org/10.1016/j.ecoinf.2008.09.005. ( Coops et al. 2009).
-
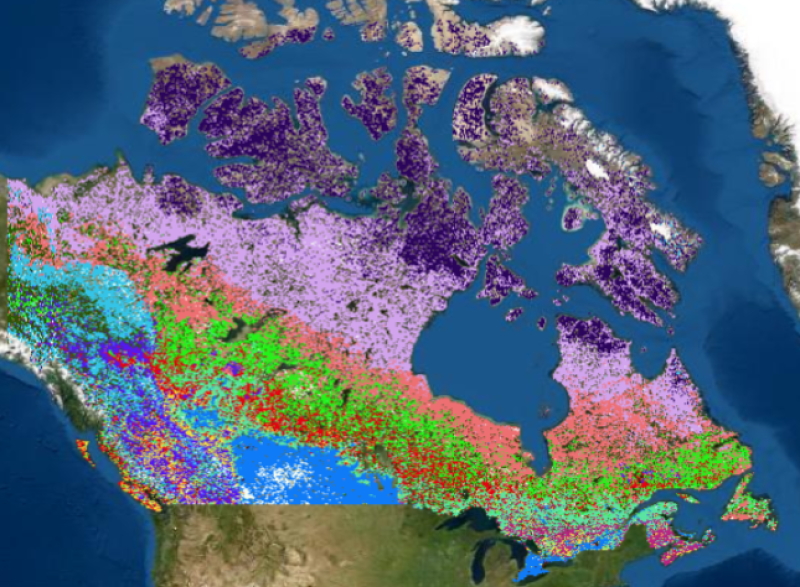
14 Class - Canadian Ecological Domain Classification from Satellite Data. Satellite derived data including 1) topography, 2) landscape productivity based on photosynthetic activity, and 3) land cover were used as inputs to create an environmental regionalization of the over 10 million km2 of Canada’s terrestrial land base. The outcomes of this clustering consists of three main outputs. An initial clustering of 100 classes was generated using a two-stage multivariate classification process. Next, an agglomerative hierarchy using a log-likelihood distance measure was applied to create a 40 and then a 14 class regionalization, aimed to meaningfully group ecologically similar components of Canada's terrestrial landscape. For more information (including a graphical illustration of the cluster hierarchy) and to cite this data please use: Coops, N.C., Wulder, M.A., Iwanicka, D. 2009. An environmental domain classification of Canada using earth observation data for biodiversity assessment. Ecological Informatics, Vol. 4, No. 1, Pp. 8-22, DOI: https://doi.org/10.1016/j.ecoinf.2008.09.005. ( Coops et al. 2009).
-
High resolution forest change for Canada (Change Type) 1985-2011 The forest change data included in this product is national in scope (entire forested ecosystem) and represents the first wall-to-wall characterization of wildfire and harvest in Canada at a spatial resolution commensurate with human impacts. The information outcomes represent 27 years of stand replacing change in Canada’s forests, derived from a single, consistent spatially-explicit data source, derived in a fully automated manner. This demonstrated capacity to characterize forests at a resolution that captures human impacts is key to establishing a baseline for detailed monitoring of forested ecosystems from management and science perspectives. Time series of Landsat data were used to characterize national trends in stand replacing forest disturbances caused by wildfire and harvest for the period 1985–2011 for Canada's 650 million hectare forested ecosystems (https://authors.elsevier.com/sd/article/S0034425717301360 ). Landsat data has a 30m spatial resolution, so the change information is highly detailed and is commensurate with that of human impacts. These data represent annual stand replacing forest changes. The stand replacing disturbances types labeled are wildfire and harvest, with lower confidence wildfire and harvest, also shared. The distinction and sharing of lower class membership likelihoods is to indicate to users that some change events were more difficult to allocate to a change type, but are generally found to be in the correct category. For an overview on the data, image processing, and time series change detection methods applied, as well as information on independent accuracy assessment of the data, see Hermosilla et al. (2016; http://www.tandfonline.com/doi/full/10.1080/17538947.2016.1187673). The data available is, 1. a binary change/no-change; 2. Change year; and, 3. Change type. When using this data, please cite as: White, J.C., M.A. Wulder, T. Hermosilla, N.C. Coops, and G. Hobart. (2017). A nationwide annual characterization of 25 years of forest disturbance and recovery for Canada using Landsat time series. Remote Sensing of Environment. 192: 303-321. DOI: 10.1016/j.rse.2017.03.035. https://authors.elsevier.com/sd/article/S0034425717301360 Geographic extent: Canada's forested ecosystems (~ 650 Mha) Time period: 1985–2011
-
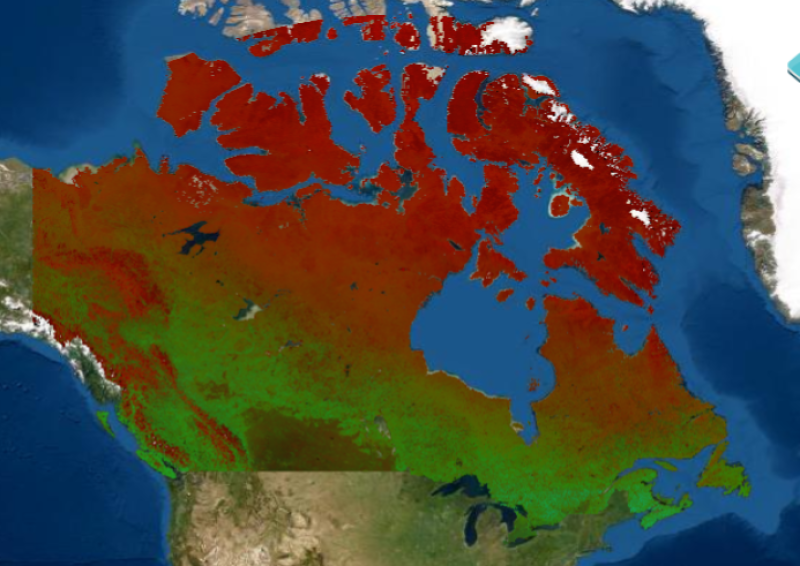
Dynamic Habitat Index. (2000-2005) Satellite derived estimates of photosynthetically active radiation can be obtained from satellites such as MODIS. Knowledge of the land cover allows for calculation the fraction of incoming solar radiation that is absorbed by vegetation. This fraction of photosynthetically active radiation (fPAR) absorbed by vegetation describes rate at which carbon dioxide and energy from sunlight are assimilated into carbohydrates during photosynthesis of plant tissues. The summation of carbon assimilated by the vegetation canopy over time yields the landscape's gross primary productivity. Daily MODIS imagery is the basis for periodic composites and monthly data products. Over the 6 year period from 2000-2005, we calculate the annual average cumulative total of 72 monthly fPAR measurements, to describe the integrated annual vegetative production of the landscape, the integrated average annual minimum monthly fPAR measurement, which describes the annual minimum green cover of the observed landscape, and the integrated average of the annual covariance of fPAR, which describes the seasonality of the observed landscape. We also share the combination of the annual integrated values for visualization and analysis as the Dynamic Habitat Index (with additional information in Coops et al. 2008). When using this data, please cite as: Coops, N.C., Wulder, M.A., Duro, D.C., Han, T. and Berry, S., 2008. The development of a Canadian dynamic habitat index using multi-temporal satellite estimates of canopy light absorbance. Ecological Indicators, 8(5), pp.754-766. ( Coops et al. 2008).
-
High resolution forest change for Canada (Change Year) 1985-2011 The forest change data included in this product is national in scope (entire forested ecosystem) and represents the first wall-to-wall characterization of wildfire and harvest in Canada at a spatial resolution commensurate with human impacts. The information outcomes represent 27 years of stand replacing change in Canada’s forests, derived from a single, consistent spatially-explicit data source, derived in a fully automated manner. This demonstrated capacity to characterize forests at a resolution that captures human impacts is key to establishing a baseline for detailed monitoring of forested ecosystems from management and science perspectives. Time series of Landsat data were used to characterize national trends in stand replacing forest disturbances caused by wildfire and harvest for the period 1985–2011 for Canada's 650 million hectare forested ecosystems (https://authors.elsevier.com/sd/article/S0034425717301360 ). Landsat data has a 30m spatial resolution, so the change information is highly detailed and is commensurate with that of human impacts. These data represent annual stand replacing forest changes. The stand replacing disturbances types labeled are wildfire and harvest, with lower confidence wildfire and harvest, also shared. The distinction and sharing of lower class membership likelihoods is to indicate to users that some change events were more difficult to allocate to a change type, but are generally found to be in the correct category. For an overview on the data, image processing, and time series change detection methods applied, as well as information on independent accuracy assessment of the data, see Hermosilla et al. (2016; http://www.tandfonline.com/doi/full/10.1080/17538947.2016.1187673). The data available is, 1. a binary change/no-change; 2. Change year; and, 3. Change type. When using this data, please cite as: White, J.C., M.A. Wulder, T. Hermosilla, N.C. Coops, and G. Hobart. (2017). A nationwide annual characterization of 25 years of forest disturbance and recovery for Canada using Landsat time series. Remote Sensing of Environment. 192: 303-321. DOI: 10.1016/j.rse.2017.03.035. https://authors.elsevier.com/sd/article/S0034425717301360 Geographic extent: Canada's forested ecosystems (~ 650 Mha) Time period: 1985–2011
-

Wildfire change year 1985-2022. Wildfire changes occurred from 1985 to 2022 displaying the year of greatest wildfire disturbance. It is developed within the framework of Canada’s National Terrestrial Ecosystem Monitoring System (NTEMS). The information outcomes represent 38 years of wildfires in Canada's forests, derived from a single, consistent, spatially explicit data source in a fully automated manner. Time series of Landsat data with 30 m spatial resolution were used to characterize national trends in stand replacing forest disturbances caused by wildfire for the period 1985-2022 for Canada's 650-million-hectare forested ecosystems. When using this data, please cite as: Hermosilla, T., M.A. Wulder, J.C. White, N.C. Coops, G.W. Hobart, L.B. Campbell, 2016. Mass data processing of time series Landsat imagery: pixels to data products for forest monitoring. International Journal of Digital Earth 9(11), 1035-1054. https://doi.org/10.1080/17538947.2016.1187673 (Hermosilla et al. 2016). See references below for an overview on the data processing, metric calculation, change attribution, and time series change detection methods applied, as well as information on independent accuracy assessment of the data.. Hermosilla, T., Wulder, M. A., White, J. C., Coops, N.C., Hobart, G.W., (2015). An integrated Landsat time series protocol for change detection and generation of annual gap-free surface reflectance composites. Remote Sensing of Environment 158, 220-234. https://doi.org/10.1016/j.rse.2014.11.005 (Hermosilla et al. 2015a). Hermosilla, T., Wulder, M.A., White, J.C., Coops, N.C., Hobart, G.W., (2015). Regional detection, characterization, and attribution of annual forest change from 1984 to 2012 using Landsat-derived time-series metrics. Remote Sensing of Environment 170, 121-132. https://doi.org/10.1016/j.rse.2015.09.004 (Hermosilla et al. 2015b). Hermosilla, T., M.A. Wulder, J.C. White, N.C. Coops, G. W. Hobart, (2017). Updating Landsat time series of surface-reflectance composites and forest change products with new observations. International Journal of Applied Earth Observation and Geoinformation. 63,104-111. https://doi.org/10.1016/j.jag.2017.07.013 (Hermosilla et al. 2017).
-

High-resolution map of leading tree species distribution for Canada’s forested ecosystems (2019). Leading tree species map produced from a 2019 Landsat image composite, geographic and climate data, elevation derivatives, and remote sensing derived phenology following the framework described in Hermosilla et al. (2022). Regional classification models were generated based on Canada’s National Forest Inventory using a 150x150 km tiling system. The leading tree species are defined by representing the most voted tree species from the Random Forests classification models (i.e. the class with the highest class membership probability).The data represents leading tree species of Canada's forested ecosystems in 2019. An image compositing window of August 1 ± 30 days was used to generate the best-available-pixel (BAP) image composites utilized as source data for the classification. The science and methods developed to generate the information outcomes shown here, that track and characterize the history of Canada’s forests, were led by Canadian Forest Service of Natural Resources Canada, developed within the framework of Canada’s National Terrestrial Ecosystem Monitoring System (NTEMS), partnered with the University of British Columbia, augmented by processing capacity from Digital Research Alliance of Canada. For an overview on the data, image processing, and methods applied, as well as information on independent accuracy assessment of the data, see Hermosilla et al. (2022) https://doi.org/10.1016/j.rse.2022.113276 When using this data, please cite as: Hermosilla, T., Bastyr, A., Coops, N.C., White, J.C., Wulder, M.A., 2022. Mapping the presence and distribution of tree species in Canada’s forested ecosystems. Remote Sensing of Environment 282, 113276.
-

Landsat-derived forest age for Canada 2022 Satellite-based forest age map for 2022 across Canada's forested ecozones at a 30-m spatial resolution, developed within the framework of Canada’s National Terrestrial Ecosystem Monitoring System (NTEMS). Remotely sensed data from Landsat (disturbances, surface reflectance composites, forest structure) and MODIS (Gross Primary Production) are utilized to determine age. Age can be determined where disturbance can be identified directly (disturbance approach) or inferred using spectral information (recovery approach) or using inverted allometric equations to model age where there is no evidence of disturbance (allometric approach). The disturbance approach is based upon satellite data and mapped changes and is the most accurate. The recovery approach also avails upon satellite data plus logic regarding forest succession, with an accuracy that is greater than pure modeling. Given the lack of widespread recent disturbance over Canada's forests, the allometric approach is required over the greatest area (86.6%). Using information regarding realized heights and growth and yield modeling, ages are estimated where none are otherwise possible. Trees of all ages are mapped, with trees >150 years old combined in an - old tree - category. See Maltman et al. (2023) for an overview of the methods, data, image processing, as well as information on agreement assessment using Canada's National Inventory (NFI). Maltman, J.C., Hermosilla, T., Wulder, M.A., Coops, N.C., White, J.C., 2023. Estimating and mapping forest age across Canada's forested ecosystems. Remote Sensing of Environment 290, 113529. ( Maltman et al. 2023).