 Arctic SDI catalogue
GeoTIF
Type of resources
Available actions
Topics
Keywords
Contact for the resource
Provided by
Formats
Representation types
Update frequencies
status
Scale
Resolution
-

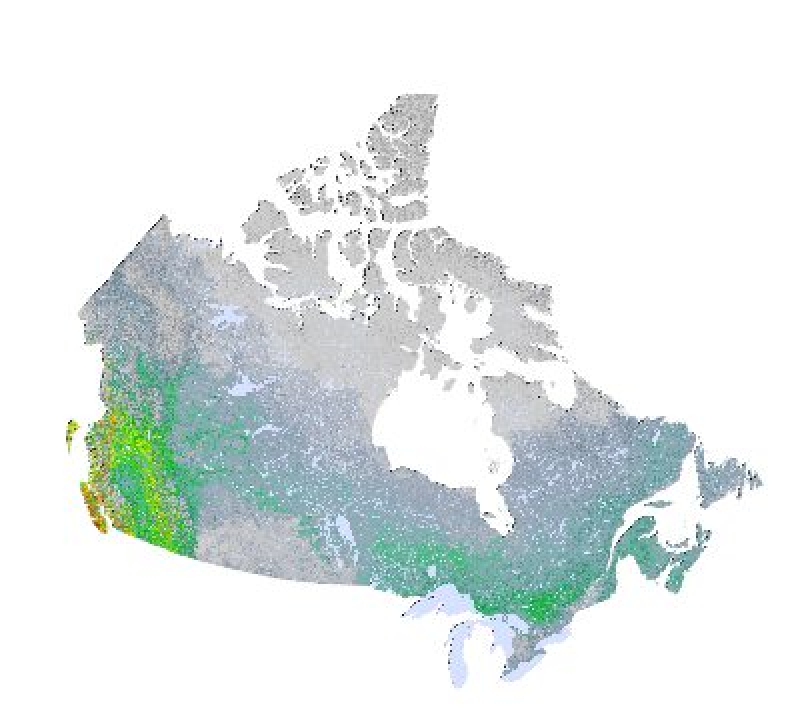
This dataset provides wall-to-wall maps of forest structure across Canada's 650 million hectare forested ecosystems for the year 2022, generated at a spatial resolution of 30 m. It is developed within the framework of Canada’s National Terrestrial Ecosystem Monitoring System (NTEMS). Structure estimates include key attributes such as canopy height, canopy cover, and aboveground biomass, derived using a combination of airborne lidar and Landsat-based spectral composites. Structure models were trained using the - lidar-plot framework - (Wulder et al. 2012), which integrates co-located airborne lidar data and ground plot measurements with Landsat time-series composites (Hermosilla et al. 2016). A Nearest Neighbour imputation approach was applied to estimate structural attributes across the full extent of Canada's forested area. These nationally consistent products are intended to support strategic-level forest monitoring and assessment and are not designed for operational forest management. For further details on the methods, accuracy assessment, and source data, see Matasci et al. (2018). Matasci, G., Hermosilla, T., Wulder, M.A., White, J.C., Coops, N.C., Hobart, G.W., Bolton, D.K., Tompalski, P., Bater, C.W., 2018. Three decades of forest structural dynamics over Canada's forested ecosystems using Landsat time-series and lidar plots. Remote Sensing of Environment, 216, 697-714. https://doi.org/10.1016/j.rse.2018.07.024 (Matasci et al. 2018)
-
Annual mapping of national level forest harvesting for Canada detected inclusive of 1985 to 2015 from Landsat satellite imagery. It is developed within the framework of Canada’s National Terrestrial Ecosystem Monitoring System (NTEMS). This dataset is composed of two layers: (1) binary harvest mask, and (2) year of harvest disturbance detection. The information outcomes represent 31 years of harvesting activity in Canada’s forests, derived from a single, consistent, spatially-explicit data source in an automated manner. Time series of Landsat data with 30-m spatial resolution were used to characterize national trends in stand replacing forest disturbances, including those attributed to harvest for the period 1985–2015 for Canada's 650 million hectare forested ecosystems (Hermosilla et al. 2016). See references below for an overview regarding the data, image processing, and time-series change detection methods applied, as well as information on independent accuracy assessment of the data. When using this data, please cite as: Hermosilla, T., M.A. Wulder, J.C. White, N.C. Coops, G.W. Hobart, L.B. Campbell, (2016). Mass data processing of time series Landsat imagery: pixels to data products for forest monitoring. International Journal of Digital Earth. 9(11), 1035-1054. ( Hermosilla et al. 2016) For additional resources on the data used and methods applied, please see: Hermosilla, T., Wulder, M. A., White, J. C., Coops, N.C., Hobart, G.W., (2015). An integrated Landsat time series protocol for change detection and generation of annual gap-free surface reflectance composites. Remote Sensing of Environment 158, 220-234. ( Hermosilla et al. 2015a) Hermosilla, T., Wulder, M.A., White, J.C., Coops, N.C., Hobart, G.W., (2015). Regional detection, characterization, and attribution of annual forest change from 1984 to 2012 using Landsat-derived time-series metrics. Remote Sensing of Environment 170, 121-132. ( Hermosilla et al. 2015b) Hermosilla, T., Wulder, M.A., White, J.C., Coops, N.C., Hobart, G.W., 2017. Updating Landsat time series of surface-reflectance composites and forest change products with new observations. International Journal of Applied Earth Observation and Geoinformation 63, 104-111.( Hermosilla et al. 2017)
-
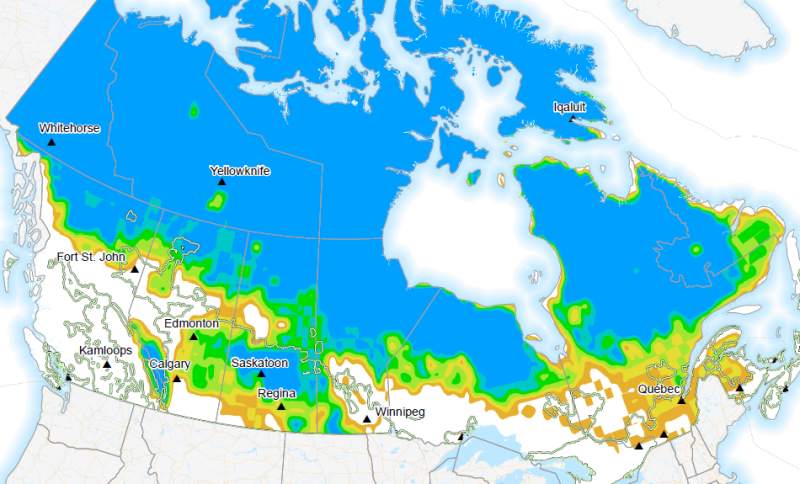
The number of days in the forecast period with a minimum temperature below the frost temperature. It is -15°C for herbaceous crops over the dormant period (ifd_herb_dorm). Week 1 and week 2 forecasted index is available daily from November 1 to March 31. Week 3 and week 4 forecasted index is available weekly (Thursday) from November 1 to March 31. Over-wintering crops are biennial and perennial field crops such as herbaceous plants (strawberry, alfalfa, timothy, and many other forage crops) and woody fruit trees (apple, pear, peach, cherry, plum, apricot, chestnut, pecan, grape, etc.). These crops normally grow and develop in the growing season and become dormant in the non-growing season. However, extreme weather and climate events such as cold waves in the growing season and ice freezing events during the winter are a major constraint for their success of production and survival in Canada. The winter survival of these plants depends largely on agrometeorological conditions from late autumn to early spring, especially ice-freezing damage during the winter season. Agriculture and Agri-Food Canada (AAFC) and Environment and Climate Change Canada (ECCC) have together developed a suite of extreme agrometeorological indices based on four main categories of weather factors: temperature, precipitation, heat, and wind. The extreme weather indices are intended as short-term prediction tools and generated using ECCC’s medium range forecasts to create a weekly index product on a daily and weekly basis.
-

The raster maps depict a suite of forest attributes in 2001* and 2011 at 250 m by 250 m spatial resolution. The maps were produced using the k nearest neighbours method applied to MODIS imagery and trained from National Forest Inventory photo plot data. For detailed information about map production methods please refer to Beaudoin et al. (2018) "Tracking forest attributes across Canada between 2001 and 2011 using the k nearest neighbours mapping approach applied to MODIS imagery." Canadian Journal of Forest Research 48, 85-93. https://cfs.nrcan.gc.ca/publications?id=38979 The map datasets may be downloaded from https://nfi.nfis.org/downloads/nfi_knn2011.zip or https://open.canada.ca/data/en/dataset/ec9e2659-1c29-4ddb-87a2-6aced147a990 * Note: the forest composition (leading tree genus) map depicts forest attributes in 2001. How can this data be used? The resolution and accuracy of these map products are best suited for strategic-level forest reporting and informing policy and decision making at regional to national scales. As these maps also offer a coherent set of quantitative values for a large suite of forest attributes, they can be used as baseline information for modelling and in calculations such as merchantable forest volume or percentage of tree species. It is also possible to overlay these maps with other maps produced on the same pixel grid to make assessments of disturbance impacts, such as fire and harvests.
-
Canada's National Forest Inventory (NFI) sampling program is designed to support reporting on forests at the national scale. On the other hand, continuous maps of forest attributes are required to support strategic analyses of regional policy and management issues. We have therefore produced maps covering 4.03 × 10⁶ km2 of inventoried forest area for the 2001 base year using standardised observations from the NFI photo plots (PP) as reference data. We used the k nearest neighbours (kNN) method with 26 geospatial data layers including MODIS spectral data and climatic and topographic variables to produce maps of 127 forest attributes at a 250 × 250 m resolution. The stand-level attributes include land cover, structure, and tree species relative abundance. In this article, we report only on total live aboveground tree biomass, with all other attributes covered in the supplementary data (http://nrcresearchpress.com/doi/suppl/10.1139/cjfr-2013-0401). In general, deviations in predicted pixel-level values from those in a PP validation set are greater in mountainous regions and in areas with either low biomass or sparse PP sampling. Predicted pixel-level values are overestimated at small observed values and underestimated at large ones. Accuracy measures are improved through the spatial aggregation of pixels to 1 km2 and beyond. Overall, these new products provide unique baseline information for strategic-level analyses of forests (https://nfi.nfis.org) Collection: - **[Canada's National Forest Inventory (NFI) 2006](https://open.canada.ca/data/en/dataset/e2fadaeb-3106-4111-9d1c-f9791d83fbf4)**
-

Landsat-derived forest age for Canada 2022 Satellite-based forest age map for 2022 across Canada's forested ecozones at a 30-m spatial resolution. Remotely sensed data from Landsat (disturbances, surface reflectance composites, forest structure) and MODIS (Gross Primary Production) are utilized to determine age. Age can be determined where disturbance can be identified directly (disturbance approach) or inferred using spectral information (recovery approach) or using inverted allometric equations to model age where there is no evidence of disturbance (allometric approach). The disturbance approach is based upon satellite data and mapped changes and is the most accurate. The recovery approach also avails upon satellite data plus logic regarding forest succession, with an accuracy that is greater than pure modeling. Given the lack of widespread recent disturbance over Canada's forests, the allometric approach is required over the greatest area (86.6%). Using information regarding realized heights and growth and yield modeling, ages are estimated where none are otherwise possible. Trees of all ages are mapped, with trees >150 years old combined in an - old tree - category. This product was developed within the framework of Canada’s National Terrestrial Ecosystem Monitoring System (NTEMS). See Maltman et al. (2023) for an overview of the methods, data, image processing, as well as information on agreement assessment using Canada's National Inventory (NFI). Maltman, J.C., Hermosilla, T., Wulder, M.A., Coops, N.C., White, J.C., 2023. Estimating and mapping forest age across Canada's forested ecosystems. Remote Sensing of Environment 290, 113529. ( Maltman et al. 2023).
-

Canada's National Forest Inventory (NFI) sampling program is designed to support reporting on forests at the national scale. On the other hand, continuous maps of forest attributes are required to support strategic analyses of regional policy and management issues. We have therefore produced maps covering 4.03 × 10⁶ km2 of inventoried forest area for the 2001 base year using standardised observations from the NFI photo plots (PP) as reference data. We used the k nearest neighbours (kNN) method with 26 geospatial data layers including MODIS spectral data and climatic and topographic variables to produce maps of 127 forest attributes at a 250 × 250 m resolution. The stand-level attributes include land cover, structure, and tree species relative abundance. In this article, we report only on total live aboveground tree biomass, with all other attributes covered in the supplementary data (http://nrcresearchpress.com/doi/suppl/10.1139/cjfr-2013-0401). In general, deviations in predicted pixel-level values from those in a PP validation set are greater in mountainous regions and in areas with either low biomass or sparse PP sampling. Predicted pixel-level values are overestimated at small observed values and underestimated at large ones. Accuracy measures are improved through the spatial aggregation of pixels to 1 km2 and beyond. Overall, these new products provide unique baseline information for strategic-level analyses of forests (https://nfi.nfis.org) Collection: - **[Canada's National Forest Inventory (NFI) 2006](https://open.canada.ca/data/en/dataset/e2fadaeb-3106-4111-9d1c-f9791d83fbf4)**
-
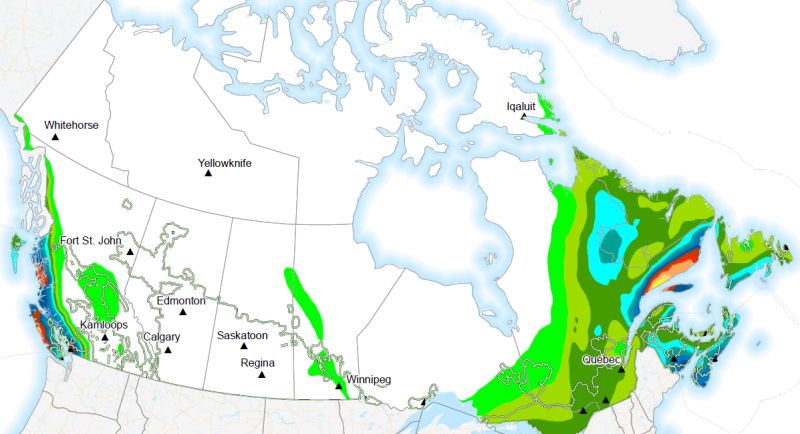
The greatest daily precipitation over the forecast period (p1d). Week 1 and week 2 forecasted index is available daily from September 1 to August 31. Week 3 and week 4 forecasted index is available weekly (Thursday) from September 1 to August 31. Units: mm Precipitation (moisture availability) establishes the economic yield potential and product quality of field crops. Both dry and wet precipitation extremes have the ability to inhibit proper crop growth. The greatest daily precipitation index covers the risk of excessive precipitation in the short term, while the other indices pertain to longer term moisture availability. Agriculture and Agri-Food Canada (AAFC) and Environment and Climate Change Canada (ECCC) have together developed a suite of extreme agrometeorological indices based on four main categories of weather factors: temperature, precipitation, heat, and wind. The extreme weather indices are intended as short-term prediction tools and generated using ECCC’s medium range forecasts to create a weekly index product on a daily and weekly basis.
-

Post-disturbance forest recovery data for Canada's forested ecosystems, representing a total area of ~650 million ha, captures the return of forests following wildfire and harvest that occurred between 1986 and 2012. It is developed within the framework of Canada’s National Terrestrial Ecosystem Monitoring System (NTEMS). These spatially-explicit outputs represent the rate of spectral recovery: the rate at which a pixel returns to 80% of its pre-disturbance value (White et al. 2017) within the observation period (1985-2017) using the Y2R or Years-to-Recovery metric derived from Landsat times series data. Baseline rates of spectral recovery (Y2R) were defined for each of Canada's 12 forested ecozones. These baselines were then used to identify spatial clusters of recovering pixels on the landscape where Y2R were either significantly faster or slower than their ecozonal baseline. Finally, areas that were disturbed by wildfire and harvest (1986-2012), but which had not recovered by the end of the observation period (2017) are also provided. Note that these areas are still recovering, but they had not yet recovered according to our metric of spectral recovery, by the end of the time series in 2017. For an overview of the methods, the validation of the Y2R metric, and interpretation of the derived trends, see White et al. (2022) and White et al. (2017). White, J.C., Hermosilla, T., Wulder, M.A., Coops, N.C., 2022. Mapping, validating, and interpreting spatio-temporal trends in post-disturbance forest recovery. Remote Sensing of Environment, 271, 112904. https://doi.org/10.1016/j.rse.2022.112904 ( White et al. 2022) White, J.C., Wulder, M.A., Hermosilla, T., Coops, N.C., Hobart, G.W. 2017. A nationwide annual characterization of 25 years of forest disturbance and recovery for Canada using Landsat time series. Remote Sensing of Environment, 194, pp. 303-321. DOI: https://doi.org/10.1016/j.rse.2017.03.035 .( White et al. 2017)
-

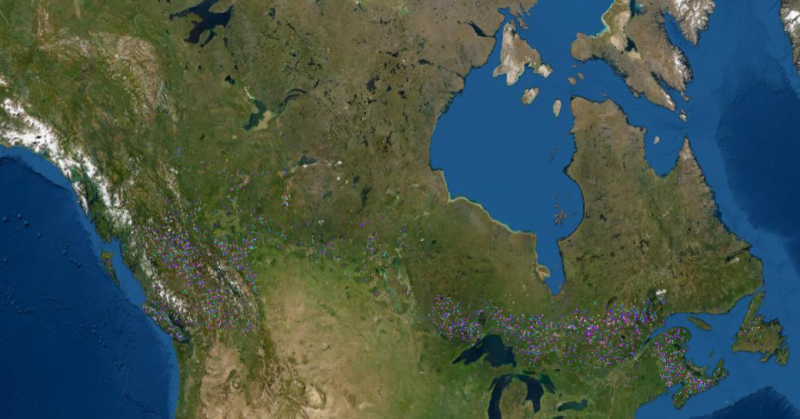
Harvest changes occurred from 1985 to 2022 displaying the year of greatest harvest disturbance. It is developed within the framework of Canada’s National Terrestrial Ecosystem Monitoring System (NTEMS). The information outcomes represent 38 years of harvest activity in Canada's forests, derived from a single, consistent, spatially explicit data source in a fully automated manner. Time series of Landsat data with 30 m spatial resolution were used to characterize national trends in stand replacing forest disturbances caused by harvest for the period 1985-2022 for Canada's 650-million-hectare forested ecosystems. When using this data, please cite as: Hermosilla, T., M.A. Wulder, J.C. White, N.C. Coops, G.W. Hobart, L.B. Campbell, 2016. Mass data processing of time series Landsat imagery: pixels to data products for forest monitoring. International Journal of Digital Earth 9(11), 1035-1054. https://doi.org/10.1080/17538947.2016.1187673 ( Hermosilla et al. 2016). See references below for an overview on the data processing, metric calculation, change attribution, and time series change detection methods applied, as well as information on independent accuracy assessment of the data. Hermosilla, T., Wulder, M. A., White, J. C., Coops, N.C., Hobart, G.W., (2015). An integrated Landsat time series protocol for change detection and generation of annual gap-free surface reflectance composites. Remote Sensing of Environment 158, 220-234. ( Hermosilla et al. 2015a). Hermosilla, T., Wulder, M.A., White, J.C., Coops, N.C., Hobart, G.W., (2015). Regional detection, characterization, and attribution of annual forest change from 1984 to 2012 using Landsat-derived time-series metrics. Remote Sensing of Environment 170, 121-132. ( Hermosilla et al. 2015b). Hermosilla, T., M.A. Wulder, J.C. White, N.C. Coops, G. W. Hobart, (2017). Updating Landsat time series of surface-reflectance composites and forest change products with new observations. International Journal of Applied Earth Observation and Geoinformation. 63,104-111. https://doi.org/10.1016/j.jag.2017.07.013 (Hermosilla et al. 2017)