 Arctic SDI catalogue
Harvest
Type of resources
Available actions
Topics
Keywords
Contact for the resource
Provided by
Formats
Representation types
Update frequencies
status
-
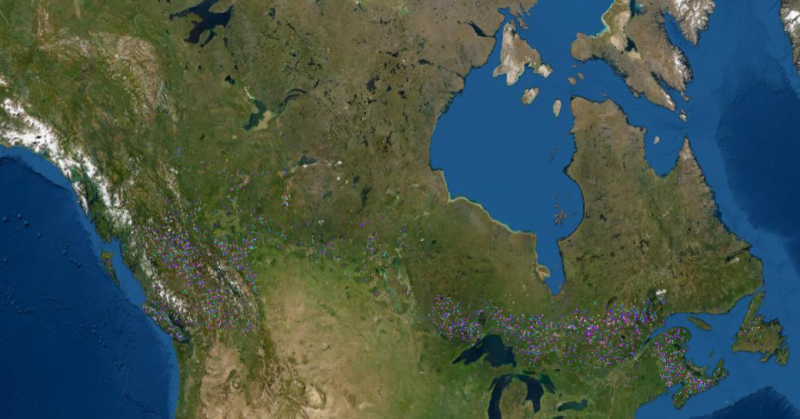
Annual mapping of national level forest harvesting for Canada detected inclusive of 1985 to 2015 from Landsat satellite imagery. It is developed within the framework of Canada’s National Terrestrial Ecosystem Monitoring System (NTEMS). This dataset is composed of two layers: (1) binary harvest mask, and (2) year of harvest disturbance detection. The information outcomes represent 31 years of harvesting activity in Canada’s forests, derived from a single, consistent, spatially-explicit data source in an automated manner. Time series of Landsat data with 30-m spatial resolution were used to characterize national trends in stand replacing forest disturbances, including those attributed to harvest for the period 1985–2015 for Canada's 650 million hectare forested ecosystems (Hermosilla et al. 2016). See references below for an overview regarding the data, image processing, and time-series change detection methods applied, as well as information on independent accuracy assessment of the data. When using this data, please cite as: Hermosilla, T., M.A. Wulder, J.C. White, N.C. Coops, G.W. Hobart, L.B. Campbell, (2016). Mass data processing of time series Landsat imagery: pixels to data products for forest monitoring. International Journal of Digital Earth. 9(11), 1035-1054. ( Hermosilla et al. 2016) For additional resources on the data used and methods applied, please see: Hermosilla, T., Wulder, M. A., White, J. C., Coops, N.C., Hobart, G.W., (2015). An integrated Landsat time series protocol for change detection and generation of annual gap-free surface reflectance composites. Remote Sensing of Environment 158, 220-234. ( Hermosilla et al. 2015a) Hermosilla, T., Wulder, M.A., White, J.C., Coops, N.C., Hobart, G.W., (2015). Regional detection, characterization, and attribution of annual forest change from 1984 to 2012 using Landsat-derived time-series metrics. Remote Sensing of Environment 170, 121-132. ( Hermosilla et al. 2015b) Hermosilla, T., Wulder, M.A., White, J.C., Coops, N.C., Hobart, G.W., 2017. Updating Landsat time series of surface-reflectance composites and forest change products with new observations. International Journal of Applied Earth Observation and Geoinformation 63, 104-111.( Hermosilla et al. 2017)
-

This file outlines the boundaries of Manitoba Agriculture's crop reporting regions./This file describes the boundaries of Manitoba Agriculture's crop report regions. This file outlines the boundaries of the five crop reporting regions as specified in Manitoba Agriculture's Crop Report.The Manitoba Agriculture Crop Report provides information on progress of seeding and crop establishment, crop development, any pest activity including weeds, insects and disease, crop activity including weeds, insects and disease, harvest progress, insects and disease, harvest progress, insects and disease, harvest progress, crop yields and grades, fall field work progress, and status of winter cereal crop seeding and establishment. In addition, it provides information on haying progress and estimated yields, as well as pasture conditions.This file describes the boundaries of the five crop report regions as specified in the Agriculture Manitoba crop report.The Manitoba Agriculture crop report provides information on progress in planting and establishing crops, as well as crop establishment, vegetative development, pest activities including weeds, insects, and diseases, harvest progress, yields and crop rankings, progress on field work in the fall, and the status of planting and establishing winter cereal crops. In addition, it provides information on the haymaking process and estimated yields, as well as on pasture conditions. **This third party metadata element was translated using an automated translation tool (Amazon Translate).**
-

Each year, forest managers report on the activities they conduct under approved forest management plans. Each annual report includes data for only a single year and a single management unit. We then consolidate this information for all of Ontario’s managed forests (all management units). We make this data available in two ways: 1. __Tabular data__ through [statistics (text)](https://www.ontario.ca/page/forest-management-facts-and-figures), [visual trends (charts)](https://public.tableau.com/app/profile/larlo/vizzes), or [open data (CSV files)](https://data.ontario.ca/dataset/report-on-forest-management-annual-summary-of-ontario-s-forest-management-activities). If you are not familiar with GIS data, these options provide a great way to explore the information. 2. __Spatial (map-based) data__ through this ESRI geodatabase data package. This option is intended for users who need to analyze forestry operations across the province and/or over extended time periods. It consolidates hundreds of individual layers into a smaller number of comprehensive layers. The data package includes the data dictionary (Technical Specification) in PDF format, which contains information about: * Forest Harvest (HRV) * Establishment Survey (EST/FTG) * Forest Regeneration (RGN) * Forestry Roads and Water Crossings (RDS/WTX) * Site Preparation (SIP) * Forestry Tending (TND) * Silviculture Ground Rule Changes (SGR) This data package is updated periodically once all management units publish their annual reports. This means the most recent annual report data for a specific management unit may not yet be included. You can find the latest management unit annual report data on the [Forest Management Planning Annual Report](https://lio.maps.arcgis.com/home/item.html?id=5ff9195d168544739741ed9ba1192d60) page. For additional annual report information—including text, tabular data, and maps—the Forest Information Manual requires the [Natural Resources Information Portal (NRIP)](https://nrip.mnr.gov.on.ca/s/fmp-online?language=en_US) as the means to transfer and store the source information.
-

__The link: *Access the data directory* is available in the section*Dataset Description Sheets; Additional Information*__. The **up-to-date ecoforest map (formerly “with disturbances”) ** is the result of the interpretation of aerial photographs and control points in the field as part of the ecoforest inventory of southern Quebec. This mapping presents the various forest and ecological characteristics of the forest territory and corresponds to the portrait of the forest up to the year the aerial photograph was taken (mapping cycle of about 10 years). Next, the outlines and nature of recent disturbances (forest interventions, fires and other disturbances) are then integrated annually. The fifth mapping cycle has been under way since 2015. This map covers almost all of the territory south of the 52nd parallel of Quebec's public and private forest. It is distributed by map sheet at a scale of 1/250,000. The minimum mapping area is 4 ha for stands and 0.1 ha for disturbances. __ ⚠️ 1) Note that__ the disturbance maps used to update the updated ecoforest map are also distributed separately on Data Quebec. Here is the list of these maps: + ** [Forest fires] (https://www.donneesquebec.ca/recherche/dataset/feux-de-foret) ** + ** [Harvesting and other silvicultural interventions] (https://www.donneesquebec.ca/recherche/dataset/recolte-et-reboisement) ** + ** [Epidemics, windfalls and ice storms] (https://www.donneesquebec.ca/recherche/dataset/epidemies-chablis-et-verglas) ** + ** [Forest Infrastructure] (https://www.donneesquebec.ca/recherche/dataset/infrastructures-en-milieu-forestier) ** __ ⚠️ 2) Note that__ disturbances are prioritized according to the nature of the layer and respect for the chronology of events. Only the last original or partial disturbance is kept in the updated ecoforest map. You should refer to the annual update layers, listed in __Note 1__, to access the full history of disturbances.**This third party metadata element was translated using an automated translation tool (Amazon Translate).**
-
Mariculture includes several different types of activities in public marine areas, such as the cultivation and harvesting of seaweed, the harvesting of green urchins, and the breeding of blue mussels or scallops, among others. Each of these activities has very distinct environmental, physicochemical and biological needs, in addition to having to coexist safely with other human activities and constraints in the maritime environment. For these reasons, mariculture activities must take place in delimited and reserved marine areas, and therefore require a permit. The “Maricolous Sites” data set brings together under provincial coverage (polygons) the information contained in the permits issued by the regional directorates. It identifies businesses, and presents their permit numbers, types of activities and species that they are authorized to raise, as well as the location and area of sites (polygons) under permits and authorizations to operate a mariculture site issued by MAPAQ.**This third party metadata element was translated using an automated translation tool (Amazon Translate).**