 Arctic SDI catalogue
Relative Wave Exposure
Type of resources
Topics
Keywords
Contact for the resource
Provided by
Formats
Representation types
Update frequencies
status
-
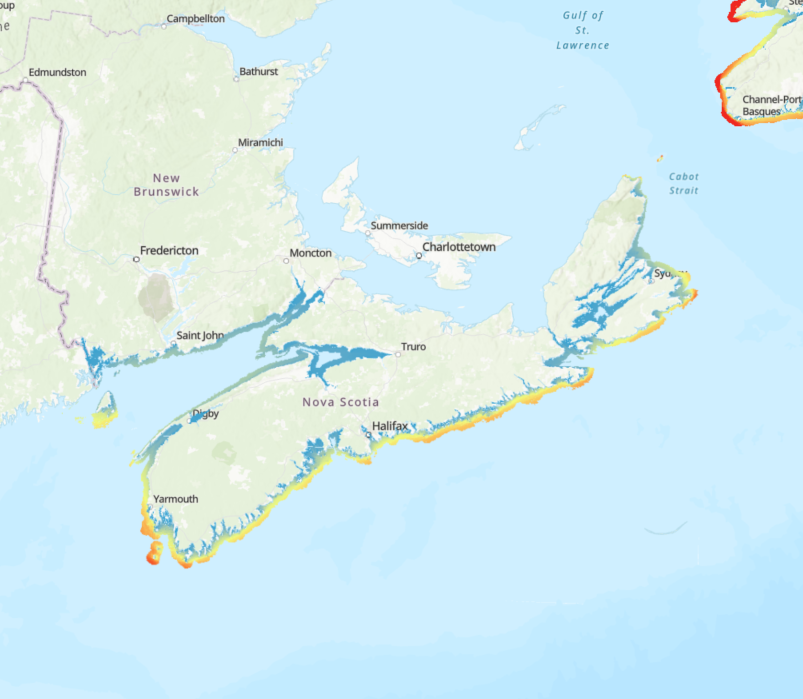
Exposure to wind-driven waves forms a key physical gradient in nearshore environments influencing both ecological communities and human activities. We calculated a relative exposure index (REI) for wind-driven waves covering the coastal zone of the Scotian Shelf-Bay of Fundy bioregion. We derived REI and two other fetch-based indices (sum fetch, minimum fetch) from two formulations of wind fetch (unweighted and effective fetch) for input points in an evenly spaced fishnet grid (50-m resolution) covering a buffered area within 5 km from the coastline and shallower than 50 m depth. We calculated unweighted fetch lengths (m) for 32 compass headings per input point (11.25° intervals), and effective fetch lengths for 8 headings per point (45° intervals). Unweighted fetch is the distance along a given heading from a point in coastal waters to land. Effective fetch is a directionally weighted average of multiple fetch measures around a given heading that reduces the influence of irregular coastline shape on exposure estimates. For fetch calculations, we used land features at a 1:50,000 scale for Canadian administrative boundaries (NrCan 2017), and unknown resolution for St. Pierre and Miquelon, and US states bordering the Gulf of Maine (GADM 2012). The summed and minimum unweighted fetch lengths for each point provide coarse summaries of wave exposure and distance to land, respectively. The relative exposure index (REI) gives a more accurate metric of exposure by combining effective fetch with modelled wind speeds (m s-1) and frequency data. We provide the original calculations of unweighted fetch, effective fetch, and other fetch-based indices (i.e., sum, minimum) in csv format along with the REI layer (GeoTIFF format) resampled to 35-m resolution. With broad spatial coverage and high resolution, these indices can support regional-scale distribution modelling of species and biological assemblages in the coastal zone as well as marine spatial planning activities. When using data please cite following: O'Brien JM, Wong MC, Stanley RRE (2022) A relative wave exposure index for the coastal zone of the Scotian Shelf-Bay of Fundy Bioregion. figshare. Collection. https://doi.org/10.6084/m9.figshare.c.5433567 References GADM database of Global Administrative Areas (2012). Global Administrative Areas, version 2.0. (accessed 2 December 2020). www.gadm.org Natural Resources Canada (2017) Administrative Boundaries in Canada - CanVec Series - Administrative Features - Open Government Portal. (accessed 2 December 2020). https://open.canada.ca/data/en/dataset/306e5004-534b-4110-9feb-58e3a5c3fd97.
-

Exposure to wind-driven waves manifests an important physical gradient in the coastal zone that influences a variety of physical and biological processes (i.e., species distribution). Fetch, the unobstructed distance over which wind-driven waves can build, is a popular proxy for wave exposure at a given location commonly used for site-specific evaluations. Here, we provide two measures of fetch (unweighted fetch, effective fetch) and three fetch-derived indices of wave exposure (sum fetch, minimum fetch, and a relative exposure index) covering the coastal zones of two Canadian bioregions (Scotian Shelf-Bay of Fundy, Newfoundland-Labrador Shelves). For each region, we calculated fetch and exposure indices for input points in an evenly spaced fishnet grid (see linked records below for datasets by region). We provide unweighted fetch lengths (m) for 32 compass headings per input point (11.25° intervals), and effective fetch lengths for 8 headings per point (45° intervals). Effective fetch is a weighted average of multiple fetch measures around a given heading that reduces the influence of irregular coastline shape on exposure estimates. We also include calculations of the summed and minimum unweighted fetch lengths for each point that provide coarse proxies of exposure and distance to land, respectively. The relative exposure index (REI), provided as regional spatial layers in raster format, provides a more accurate metric of exposure by combining effective fetch with modelled wind speeds (m s-1) and frequency data. Users may also use fetch calculations to derive their own exposure layers using alternative sources of wind data, indices, or formulations. Detailed methodology on the calculations for fetch, effective fetch and REI are outlined in the Supplementary Information below. Citation information and differences in data pre-processing methods and spatial resolution of the regional analyses are described in their respective data records. The broad spatial coverage and high resolution offered by these indices are suitable to support regional-scale modelling and planning exercises. In particular, these indices will be of value to ongoing Marine Spatial Planning efforts, which includes regional conservation planning, that seek to evaluate the distribution of coastal species and overlap with human activities.
-

A relative exposure index (REI), unweighted fetch, effective fetch, and other fetch-based indices (i.e., sum, minimum) were calculated for the Newfoundland and Labrador (NL) Shelves bioregion. Due to the extensive coastline of the study region, this analysis was conducted for a 5km buffered region along the coast at a spatial resolution of 250m. Detailed methods on the selection of input points for the NL bioregion are included below. Methods Preprocessing and input point selection: Land boundary files were obtained for Eastern Canada and the Canadian Arctic (NrCan 2017) at a scale of 1:50,000 as well as for Saint Pierre and Miquelon (Hijmans 2015), and the New England states (GADM 2012) however the scale at which these layers were produced is unknown. Land boundary files were merged into a single land polygon layer and watercourses reaching for in-land and/or above sea level were clipped from this polygon layer (Greyson 2021). A 5km buffer was generated around the NL provincial boundary. This buffer was then clipped by all land polygons to remove areas overlapping land polygons within the study area. All buffer segments intersecting the NAFO divisions within the NL bioregion were selected and the Union tool in ArcGIS Pro (v. 2.7.2) was used to fill-in gaps within the buffered area, creating a more continuous polygon. The buffered layer was then dissolved, and the NL provincial boundary polygon was erased from the buffered layer to create the study area polygon. A 250m fishnet was created and clipped to the study area (5km buffer layer) and the feature to point tool was used (with the “inside parameter checked”) to convert this grid into a point layer (approx. 1,000,000 points). The spatial resolution for all subsequent analyses was matched to the fishnet grid at 250m. References GADM database of Global Administrative Areas (2012). Global Administrative Areas, version 2.0. (accessed 2 December 2020). www.gadm.org Greyson, P (2021) Land boundary file for Eastern Canada, the Canadian Arctic, the New England States and Saint Pierre and Miquelon. [shapefile]. Unpublished data. Hijmans, R. and University of California, Berkeley, Museum of Vertebrate Zoology. (2015). First-level Administrative Divisions, Saint Pierre and Miquelon, 2015. UC Berkeley, Museum of Vertebrate Zoology. Available at: http://purl.stanford.edu/bz573nv9230 Natural Resources Canada (2017) Administrative Boundaries in Canada - CanVec Series - Administrative Features - Open Government Portal. (accessed 2 December 2020). https://open.canada.ca/data/en/dataset/306e5004-534b-4110-9feb-58e3a5c3fd97.