 Arctic SDI catalogue
mosaïque
Type of resources
Keywords
Contact for the resource
Provided by
Years
Formats
Representation types
Update frequencies
status
Service types
Resolution
-
La donnée a été créée ou dérivée à partir d'images de véhicules aériens non habités (UAV) acquises à partir d'une enquête d'une journée, le 28 juillet 2016, à Cambridge Bay, au Nunavut. Cinq points de contrôle provenant d'un système de positionnement différentiel global ont été positionnés dans les coins et au centre de l'étude de la végétation. Les jeux de données suivants couvrent une superficie de 525m2 et ont été produits par le Centre canadien de télédétection / Centre canadien de cartographie et d'observation de la Terre: - UAV modèle d'hauteur de la végétation, Cambridge Bay, Nunavut - UAV modèle numérique de surface (MNS) dans Cambridge Bay, Nunavut - Parcelle de végétation - UAV orthomosaïque de Cambridge Bay, Nunavut - Parcelle de végétation L'enquête sur les UAV a été menée en collaboration avec La Station canadienne de recherche dans l’Extrême-Arctique (SCREA) pour la recherche sur la surveillance de la végétation nordique. Pour plus de renseignement, consultez nos travaux de recherche actuels: Fraser et al; ""UAV photogrammetry for mapping vegetation in the low-Arctic"" Arctic Science, 2016, 2(3): 79-102, 10.1139/as-2016-0008 http://www.nrcresearchpress.com/doi/abs/10.1139/AS-2016-0008
-
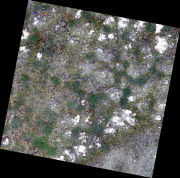
The 0.34 cm resolution orthomosaic was created from unmanned aerial vehicle (UAV) imagery acquired from a single day survey, July 28th 2016, in Cambridge Bay, Nunavut. Five control points taken from a Global Differential Positioning System were positioned in the corners and the center of the vegetation survey. The orthomosaic covering 525m2 was produced by Canada Centre for Remote Sensing /Canada Centre for Mapping and Earth Observation. The UAV survey was completed in collaboration with the Canadian High Arctic Research Station (CHARS) for northern vegetation monitoring research. For more information, refer to our current Arctic vegetation research: Fraser et al; "UAV photogrammetry for mapping vegetation in the low-Arctic" Arctic Science, 2016, 2(3): 79-102. http://www.nrcresearchpress.com/doi/abs/10.1139/AS-2016-0008.
-

This data publication contains an optimized mosaic of PALSAR-2 L-band dual-polarized radar backscatter summer composite for the year 2020 across Canada (excluding the Arctic Archipelago). Its primary purpose is to offer the best possible L-band radar summer-like composite mosaic mostly tailored for i) classifying natural treed or shrubby vegetation covers, and ii) estimating their structural attributes, such as height and biomass. ## Methodology: This product is based on the freely available and open dataset of yearly JAXA Global PALSAR-2/PALSAR Mosaics ver. 1 (hereafter JAXA GPM v1). They were generated by the Japanese space agency (JAXA) using PALSAR L-band synthetic aperture radar sensors aboard the Advanced Land Observing Satellites (ALOS): ALOS-2 PALSAR-2 (2015 to 2020) and ALOS PALSAR (2007 to 2010). JAXA GPM v1 provide yearly mosaics orthorectified and slope-corrected L-band HH- and HV-polarized gamma naught (γ°) backscatter amplitude with 25-m pixel size and scaled as 16-bit data (Shimada et al. 2014). JAXA GPM v1 are accessible as a Google Earth Engine image collection at https://developers.google.com/earth-engine/datasets/catalog/JAXA_ALOS_PALSAR_YEARLY_SAR. The yearly 2007 to 2020 JAXA GPM v1 dataset across Canada underwent a post-processing and compositing methodology implemented in Google Earth Engine, as detailed in Pontone et al. 2024 and summarized in a pdf “Readme” file provided with the dataset. In summary, the method involves these three steps: 1. Post-processing of yearly γ° HH and HV datasets: handling data gaps, filtering speckle noise, and generating two radar vegetation indices, the HV/HH ratio (HVHH) and the radar forest degradation index (RFDI). 2. Temporal compositing from 2015 to 2020 of post-processed yearly γ° PALSAR-2 HH, HV, HVHH, and RFDI backscatter data aimed to i) address data gaps and ii) mitigate detrimental backscatter fluctuations across ALOS-2 orbits resulting from numerous out-of-summer acquisitions. 3. Generating the final PALSAR-2 L-band γ° radar backscatter summer composite circa 2020 raster files. ## Performance et limitations: The resulting Canada-wide, excluding the Arctic Archipelago, gap-free and radiometrically optimized mosaic of circa 2020 PALSAR-2 L-band backscatter summer composite was found significantly improved compared to the single-year 2020 JAXA GPM v1 mosaic, particularly in northern boreal Canada (Pontone et al. 2024). However, this product should be considered as a summer-like composite and users should be mindful of the following known limitations: • In northwestern Canada, there were often minimal to no summer PALSAR-2 acquisitions, resulting in residual backscatter fluctuations across ALOS-2 orbits. • The composite may exhibit patchy radiometric noise in areas that experienced major disturbances (fires, harvesting) between 2015 and 2020 despite they were accounted for in our compositing methodology. • This product is deemed less performant, or possibly not suitable, for i) characterizing highly dynamic land cover types such as grasslands, croplands, and water bodies, or for ii) estimating soil and/or vegetation moisture content for the year 2020. As a final note, JAXA released an improved GPM ver. 2 that was not available at the time of this study. A preliminary analysis shows that the circa 2020 PALSAR-2 composite product still seems to outperform the 2020 JAXA GPM v2 in northern Canada. ## Additional Information on Dataset: This dataset comprises four raster geotiff files of circa 2020 L-band PALSAR-2 summer temporal composites as mosaics of orthorectified and radiometrically slope corrected dual-polarized HH and HV gamma naught (γ°) backscatter amplitude, along with two radar vegetation indices (HVHH, RFDI), all scaled as 16-bit Digital Number (DN) values with 30-m pixel size in Lambert conformal conic projection. An additional 8-bit RGB quick-view file is also provided. A companion pdf ”Readme” file provides further details about these geotiff files and equations to convert DN values to γ° absolute intensity values. ## Dataset Citation: Beaudoin, A., Villemaire, P., Gignac, C., Tolszczuk, S., Guindon, L., Pontone, N., Millard, C. (2024). Canada’s PALSAR-2 dual-polarized L-band radar summer backscatter composite, circa 2020. Natural Resources Canada, Canadian Forest Service, Laurentian Forestry Centre, Quebec, Canada. https://doi.org/10.23687/8ec4ee78-9240-4bd0-9c97-d3a27829e209 In addition, please provide credits to the Japanese space agency JAXA with the mention “Original Global PALSAR-2/PALSAR Mosaics v1 provided by JAXA (©JAXA)” ## Publication Reference for Product Development and Use in Wetland Mapping: Pontone, N., Millard, K., Thompson, D., Guindon, L., Beaudoin, A. (2024). A hierarchical, Multi-Sensor Framework for Peatland Sub-Class and Vegetation Mapping Throughout the Canadian Boreal Forest. Remote Sensing for Ecology and Conservation (accepted for publication). ## Cited reference: Shimada, M., Itoh, T., Motooka, T., Watanabe, M., Tomohiro, S., Thapa, T., Lucas, R. (2014). New Global Forest/Non-Forest Maps from ALOS PALSAR Data (2007-2010). Remote Sensing of Environment, 155, pp. 13-31. https://doi.org/ 10.1016/j.rse.2014.04.014