 Arctic SDI catalogue
statistiques
Type of resources
Available actions
Keywords
Contact for the resource
Provided by
Years
Formats
Representation types
Update frequencies
status
Service types
-
Groupe de municipalités voisines les unes des autres qui sont réunies pour des besoins de planification régionale et de gestion de services communs (comme les services de police et d'ambulance). Ces groupes sont créés selon les lois en vigueur dans certaines provinces du Canada. Division de recensement (DR) est le terme général de régions créées en vertu des lois provinciales (comme comté, municipalité régionale de comté et regional district) ou des régions équivalentes. Dans d'autres provinces et dans les territoires, où les lois ne prévoient pas de telles régions, Statistique Canada définit des régions équivalentes à des fins statistiques en collaboration avec ces provinces et territoires. Les divisions de recensement sont des régions géographiques intermédiaires entre la municipalité (subdivision de recensement) et la province/territoire.
-
Statistics Canada, in collaboration with the Public Health Agency of Canada and Natural Resources Canada, is presenting selected Census data to help inform Canadians on the public health risk of the COVID-19 pandemic and to be used for modelling analysis.The data provided here show the population counts and percentage distribution for various geographic levels by broad age groups, males, females and both sexes, from the 2016 Census.
-

A collection of online resources where one can obtain different Labour Market Information.
-

This service shows the percentage of population aged 25 to 64 years in private households with a postsecondary certificate, diploma or degree by census division, 2016. The data is from the Census Profile, Statistics Canada Catalogue no. 98-316-X2016001. This data pertains to the population aged 25 to 64 years in private households by the highest level of education that a person has successfully completed. Persons with a post-secondary certificate, diploma or degree includes those with an apprenticeship or trades certificate or diploma; a college, CEGEP or other non-university certificate or diploma; a university certificate or diploma below bachelor level or a university certificate, diploma or degree at bachelor level or above. For additional information refer to the 2016 Census Dictionary for ' Highest certificate, diploma or degree'. For additional information refer to the 2016 Census Dictionary for ' Highest certificate, diploma or degree'. To have a cartographic representation of the ecumene with this socio-economic indicator, it is recommended to add as the first layer, the “NRCan - 2016 population ecumene by census division” web service, accessible in the data resources section below.
-

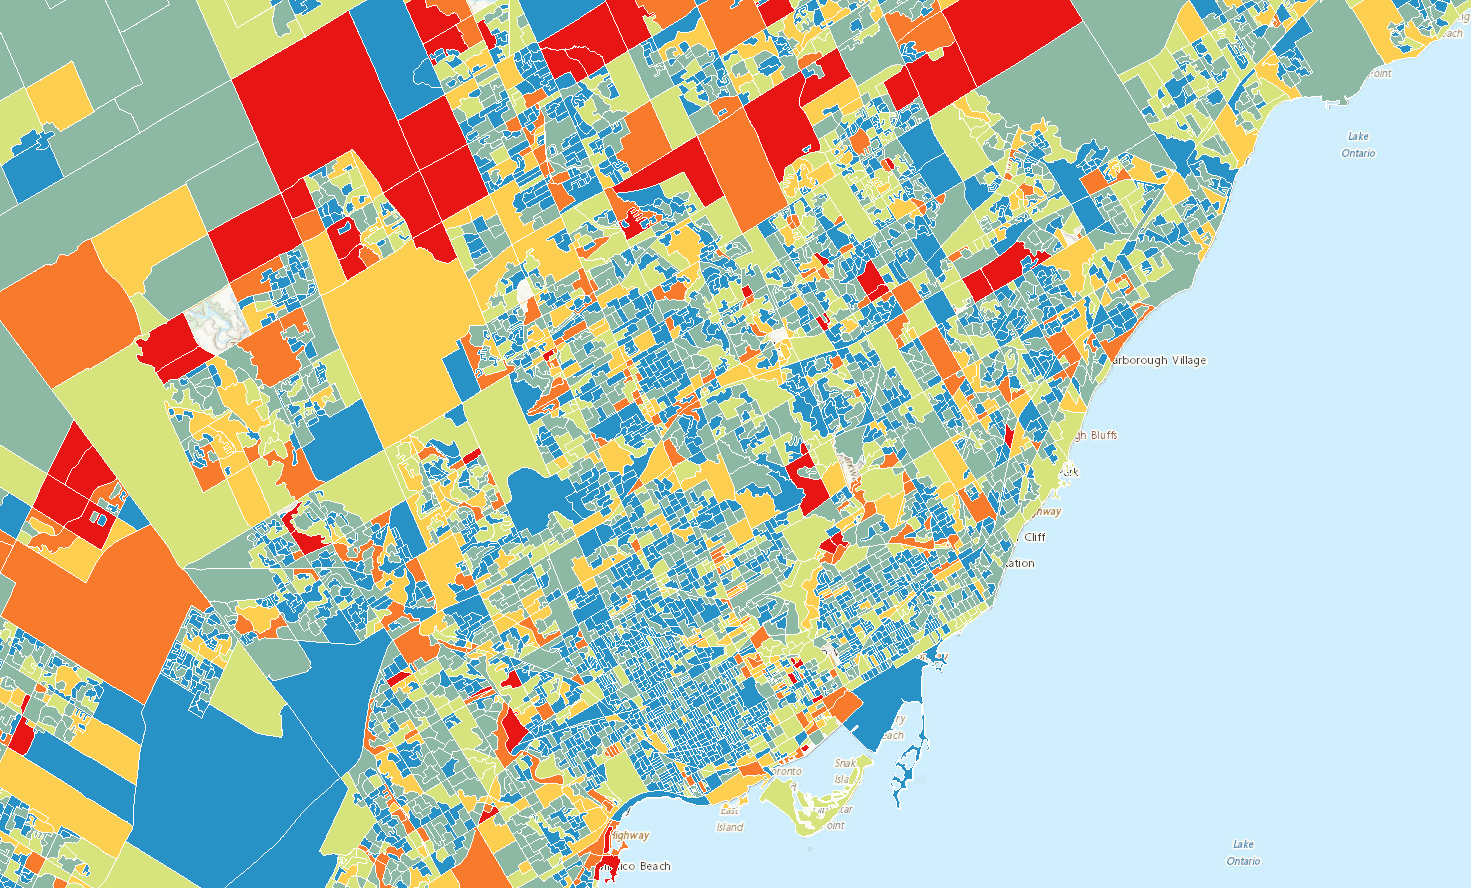
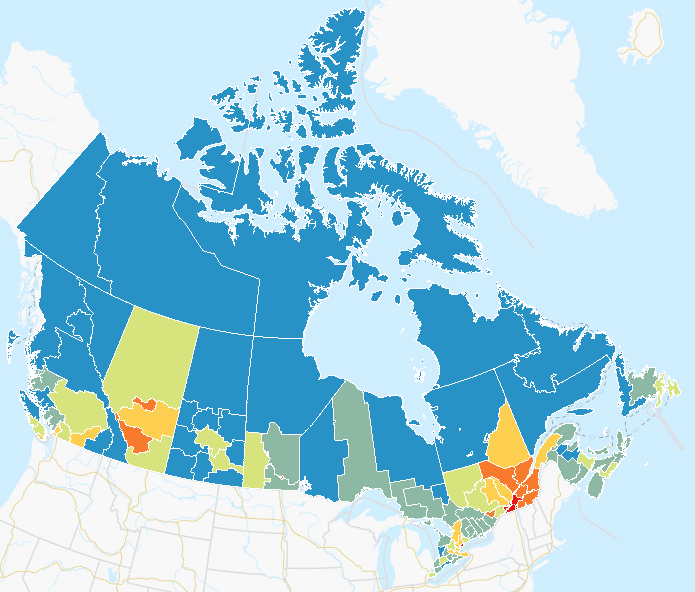
The Canadian indexes of social resilience and vulnerability were created to provide area-based information on resilience and vulnerability to natural hazards and disasters across Canada. Specifically, the Canadian Index of Social Resilience (CISR) aims to reflect a community’s ability to respond to and recover from natural hazards. In contrast, the Canadian Index of Social Vulnerability (CISV) aims to reflect the social vulnerability of an area based on factors that have the potential to amplify the impact of disasters on populations. Before the CISR and CISV were built, indicator frameworks were developed for social resilience and social vulnerability, respectively. Indicators were selected because of their demonstrated association with social resilience or social vulnerability. The selection was informed by the theoretical and research literature, existing indexes, availability of relevant data and engagement with subject-matter experts. The CISR and the CISV were created using data from Dissemination areas (DAs) across the country. The selected indicators were included in a principal component analysis, which is a statistical technique that allows a large number of indicators to be collapsed into a smaller number of interpretable components. Based on the results of the principal component analysis, DA-level scores were calculated for each index. Higher CISR scores correspond to DAs that are more resilient and higher CISV scores correspond to DAs that are more vulnerable. These indexes can be used to better understand areas which may experience the largest disproportional social impacts from natural hazards.
-
Statistics Canada, in collaboration with the Public Health Agency of Canada and Natural Resources Canada, is presenting selected Census data to help inform Canadians on the public health risk of the COVID-19 pandemic and to be used for modelling analysis. The data provided here show the counts of the population in nursing homes and/or residences for senior citizens by broad age groups (0 to 79 years and 80 years and over) and sex, from the 2016 Census. Nursing homes and/or residences for senior citizens are facilities for elderly residents that provide accommodations with health care services or personal support or assisted living care. Health care services include professional health monitoring and skilled nursing care and supervision 24 hours a day, 7 days a week, for people who are not independent in most activities of daily living. Support or assisted living care services include meals, housekeeping, laundry, medication supervision, assistance in bathing or dressing, etc., for people who are independent in most activities of daily living. Included are nursing homes, residences for senior citizens, and facilities that are a mix of both a nursing home and a residence for senior citizens. Excluded are facilities licensed as hospitals, and facilities that do not provide any services (which are considered private dwellings).
-

This service shows the ratio of immigrants who arrived between 2001 and 2016 to immigrants who arrived before 2001, by census subdivision, 2016. The data is a custom extraction from the 2016 Census - 25% sample data. This data pertains to persons in private households who are immigrants by their period of immigration. 'Immigrant' includes persons who are, or who have ever been, landed immigrants or permanent residents. Such persons have been granted the right to live in Canada permanently by immigration authorities. Immigrants who have obtained Canadian citizenship by naturalization are included in this category. In the 2016 Census of Population, 'Immigrant' includes immigrants who landed in Canada on or prior to May 10, 2016. 'Period of immigration' refers to the period in which the immigrant first obtained landed immigrant or permanent resident status. For additional information refer to the 2016 Census Dictionary for 'Immigrant status' and 'Period of immigration'. For additional information refer to the 2016 Census Dictionary for 'Immigrant status' and 'Period of immigration'. To have a cartographic representation of the ecumene with this socio-economic indicator, it is recommended to add as the first layer, the “NRCan - 2016 population ecumene by census subdivision” web service, accessible in the data resources section below.
-

This service shows the proportion of average total income of households which is spent on shelter costs by census division. The data is from the Census Profile, Statistics Canada Catalogue no. 98-316-X2016001. Shelter-cost-to-income ratio is calculated for private households living in owned or rented dwellings who reported a total household income greater than zero. Private households living in band housing, located on an agricultural operation that is operated by a member of the household, and households who reported a zero or negative total household income are excluded. The relatively high shelter-costs-to-household income ratios for some households may have resulted from the difference in the reference period for shelter costs and household total income data. The reference period for shelter cost data is 2016, while household total income is reported for the year 2015. As well, for some households, the 2015 household total income may represent income for only part of a year. For additional information refer to the 2016 Census Dictionary for 'Total income' and 'Shelter cost'. To have a cartographic representation of the ecumene with this socio-economic indicator, it is recommended to add as the first layer, the “NRCan - 2016 population ecumene by census division” web service, accessible in the data resources section below.
-

This service shows the median after-tax income of lone parent families in 2015 for Canada by 2016, census subdivision. The data is from the data table Household Income Statistics (3) and Household Type Including Census Family Structure (11) for Private Households of Canada, Provinces and Territories, Census Divisions and Census Subdivisions, 2016 Census - 100% Data, Statistics Canada Catalogue no. 98-400-X2016099. This data pertains to households with one lone-parent census family without other persons in the household. In the context of census families, total income refers to receipts from certain sources of all of its family members, before income taxes and deductions, during a specified reference period. After-tax income refers to total income less income taxes of the statistical unit during a specified reference period. The median income of a specified group is the amount that divides the income distribution of that group into two halves. For additional information refer to the 2016 Census Dictionary for 'Total income', 'After-tax income' and 'Census family'. For additional information refer to the 2016 Census Dictionary for 'Total income', 'After-tax income' and 'Census family'. To have a cartographic representation of the ecumene with this socio-economic indicator, it is recommended to add as the first layer, the “NRCan - 2016 population ecumene by census subdivision” web service, accessible in the data resources section below.