 Arctic SDI catalogue
WMS
Type of resources
Available actions
Topics
Keywords
Contact for the resource
Provided by
Years
Formats
Representation types
Update frequencies
status
Service types
Scale
-

The Canadian Gravity Anomaly Data Base consists of approximately 660 000 gravity observations, including 165 000 on land, acquired between 1944 and the present. The data spacing ranges from less than 1 km to over 20 km, with an average spacing between 5 and 10 km. All measurements were reduced to the IGSN71 datum. Theoretical gravity values were calculated from the Geodetic Reference System 1967 (GRS67) gravity formula. Bouguer anomalies were calculated using a vertical gravity gradient of 0.3086 mGal·m-1 and a crustal density of 2 670 kg·m-3.
-

Radar coverage is provided to dynamically display the zones covered by the radars every 6 minutes, and to provide information on the availability (or not) of the contributing radars as well as on the areas of overlap.
-

The Canadian Gravity Anomaly Data Base consists of approximately 660 000 gravity observations, including 165 000 on land, acquired between 1944 and the present. The data spacing ranges from less than 1 km to over 20 km, with an average spacing between 5 and 10 km. All measurements were reduced to the IGSN71 datum. Theoretical gravity values were calculated from the Geodetic Reference System 1967 (GRS67) gravity formula. Bouguer anomalies were calculated using a vertical gravity gradient of 0.3086 mGal·m-1 and a crustal density of 2 670 kg·m-3.
-

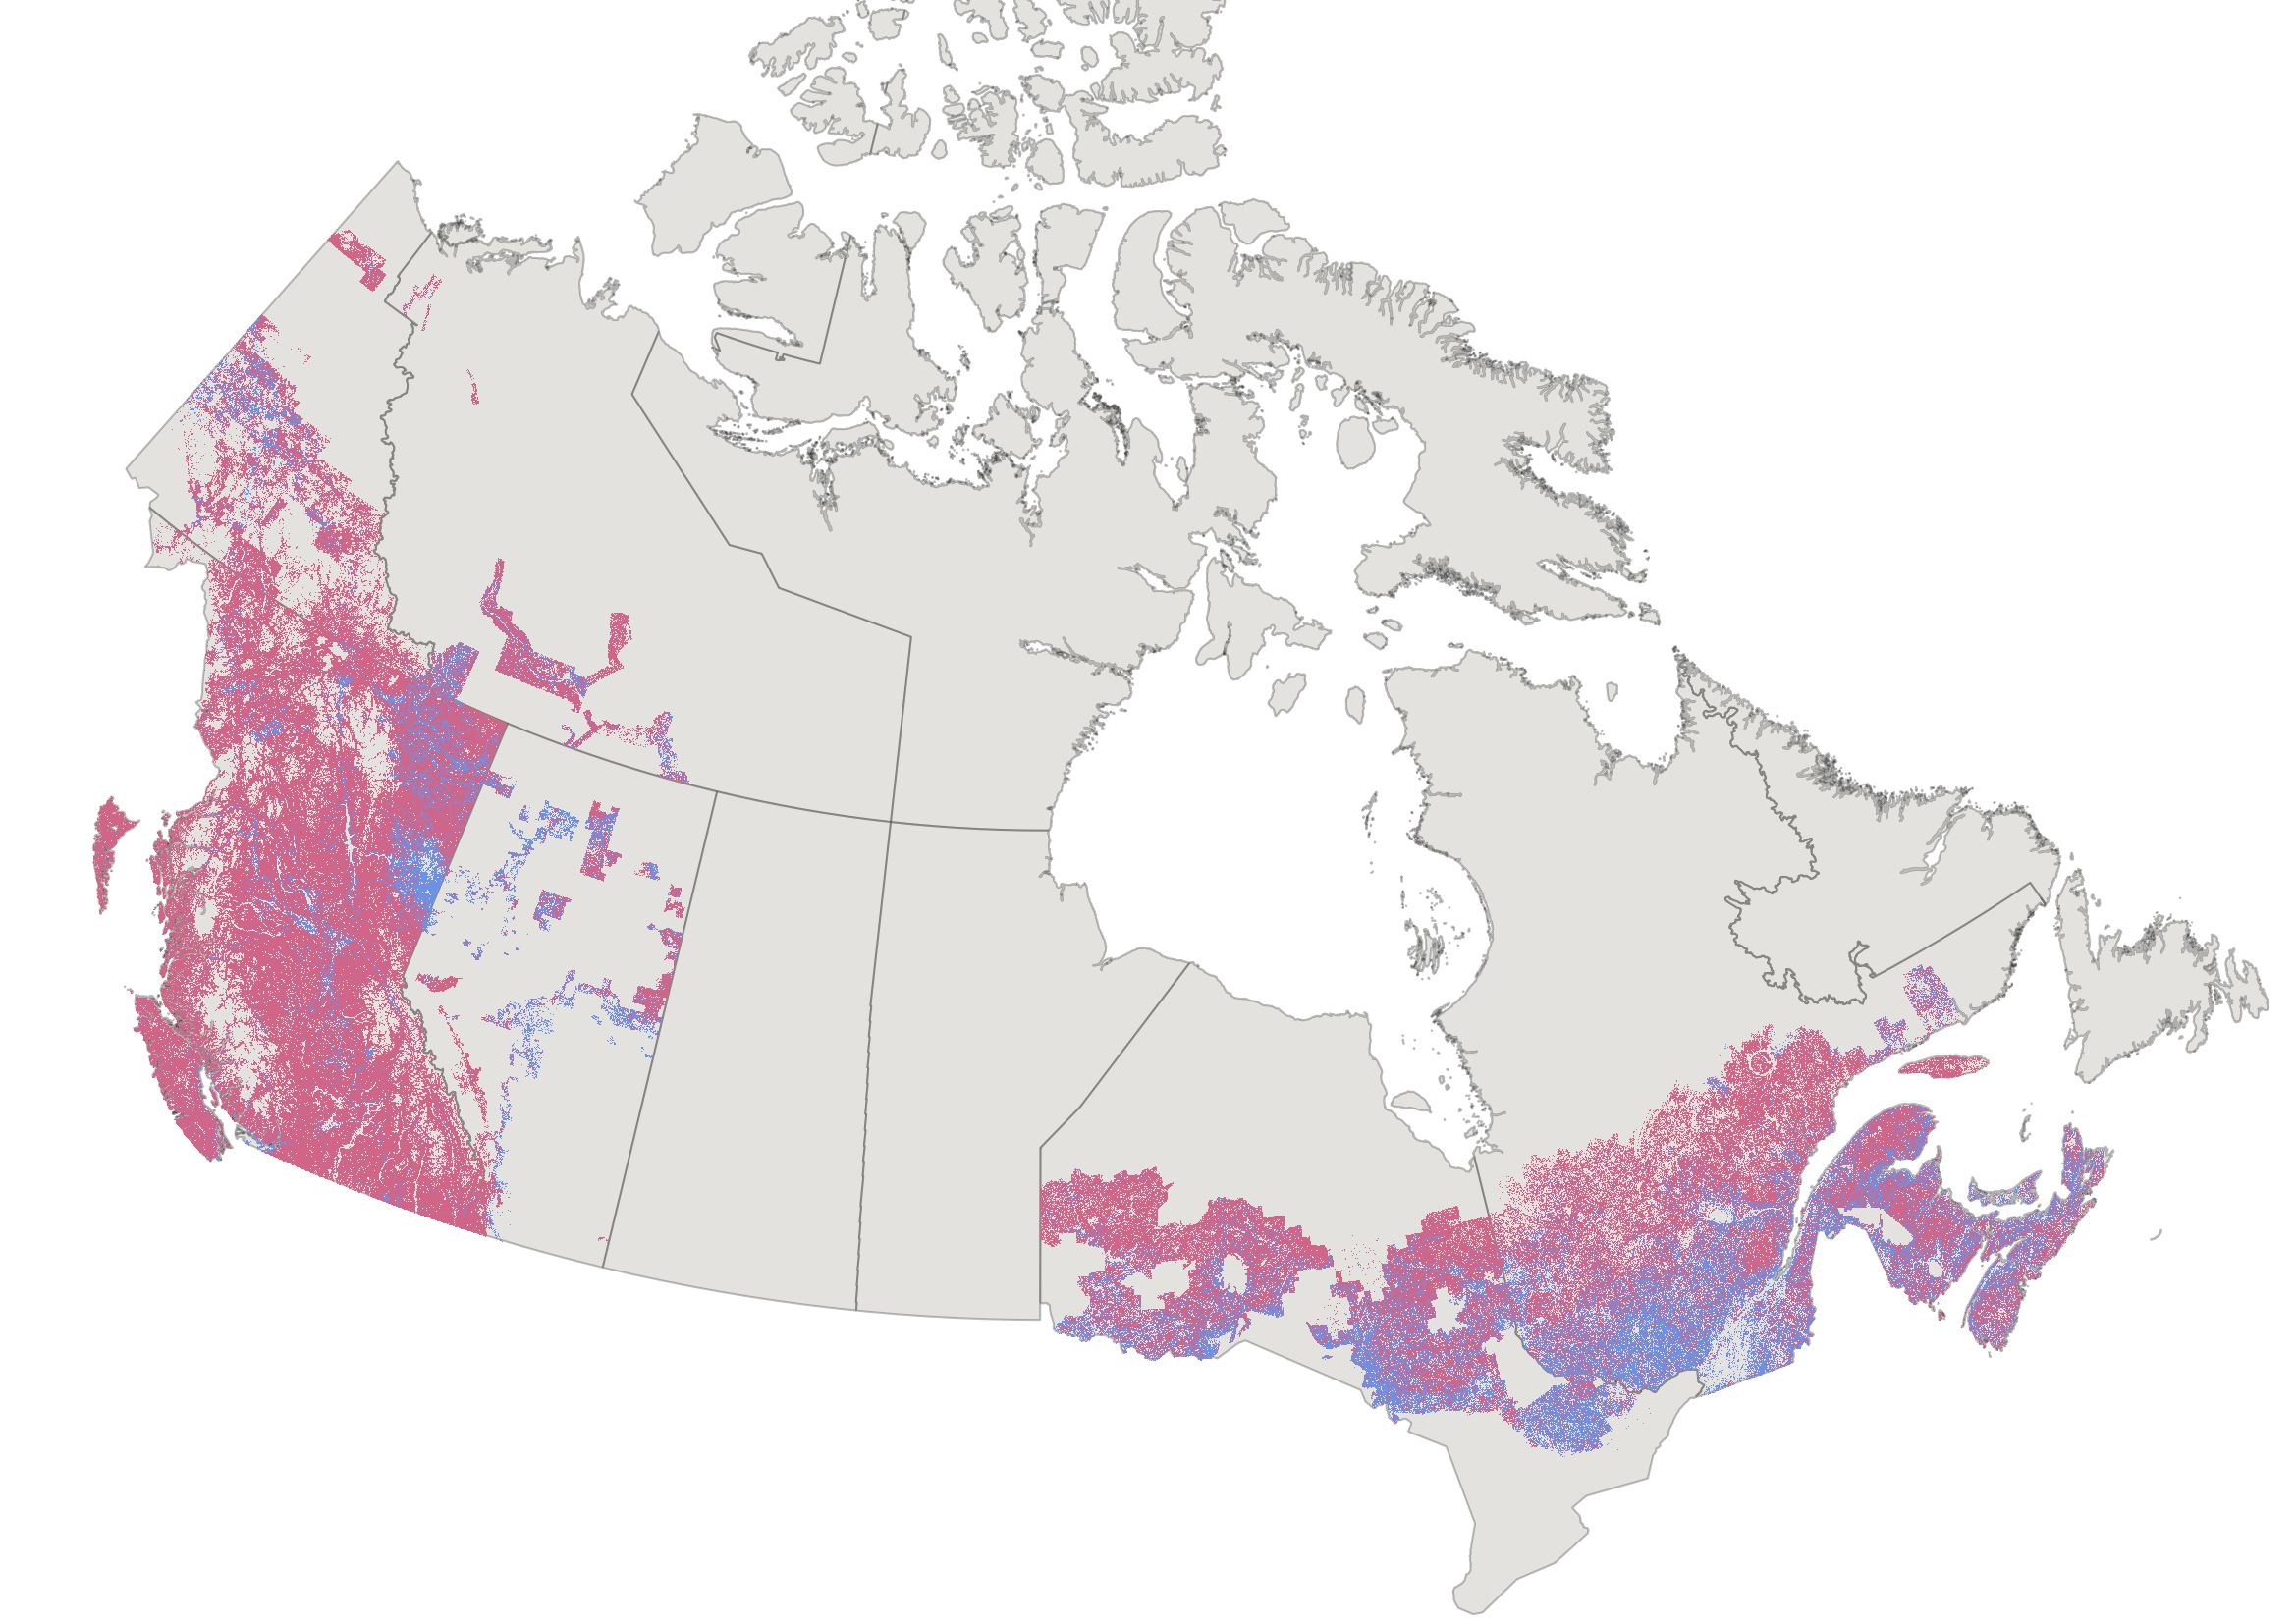
Multi-Agency Ground Plot (MAGPlot) database (DB) is a pan-Canadian forest ground-plot data repository. The database synthesize forest ground plot data from various agencies, including the National Forest Inventory (NFI) and 12 Canadian jurisdictions: Alberta (AB), British Columbia (BC), Manitoba (MB), New Brunswick (NB), Newfoundland and Labrador (NL), Nova Scotia (NS), Northwest Territories (NT), Ontario (ON), Prince Edward Island (PE), Quebec (QC), Saskatchewan (SK), and Yukon Territory (YT), contributed in their original format. These datasets underwent data cleaning and quality assessment using the set of rules and standards set by the contributors and associated documentations, and were standardized, harmonized, and integrated into a single, centralized, and analysis-ready database. The primary objective of the MAGPlot project is to collate and harmonize forest ground plot data and to present the data in a findable, accessible, interoperable, and reusable (FAIR) format for pan-Canadian forest research. The current version includes both historical and contemporary forest ground plot data provided by data contributors. The standardized and harmonized dataset includes eight data tables (five site related and three tree measurement tables) in a relational database schema. Site-related tables contain information on geographical locations, treatments (e.g. stand tending, regeneration, and cutting), and disturbances caused by abiotic factors (e.g., weather, wildfires) or biotic factors (e.g., disease, insects, animals). Tree-related tables, on the other hand, focus on measured tree attributes, including biophysical and growth parameters (e.g., DBH, height, crown class), species, status, stem conditions (e.g., broken or dead tops), and health conditions. While most contributors provided large and small tree plot measurements, only NFI, AB, MB, and SK contributed datasets reported at regeneration plot level (e.g., stem count, regeneration species). Future versions are expected to include updated and/or new measurement records as well as additional tables and measured and compiled (e.g., tree volume and biomass) attributes. MAGPlot is hosted through Canada’s National Forest Information System (https://nfi.nfis.org/en/maps). ---------------------------------------------------------------- SITES NUMBER OF MEASUREMENTS LAYER: ----------------------------------------------------------------- Shows the total number of subsequent measurements conducted at each MAGPlot site. ----------- NOTES: ----------- The MAGPlot release (v1.0.0 and v1.1.0) does not include NL and SK datasets due to pending Data Sharing Agreements, ongoing data processing, or restrictions on third-party sharing. These datasets will be included in future releases. While certain jurisdictions permit open or public data sharing, given that requestor signs and adheres the Data Use agreement, there are some jurisdictions that require a jurisdiction-specific request form to be signed in addition to the Data Use Agreement form. For the MAGPlot Data Dictionary, other metadata, datasets available for open sharing (with approximate locations), data requests (for other datasets or exact coordinates), and available data visualization products, please check all the folders in the “Data and Resources” section below. Coordinates in web services have been randomized within 5km of true location to preserve site integrity. Access the WMS (Web Map Service) layers from the “Data and Resources” section below. A data request must be submitted to access historical datasets, datasets restricted by data-use agreements, or exact plot coordinates using the link below. NFI Data Request Form: https://nfi.nfis.org/en/datarequestform ----------------------------------- ACKNOWLEDGEMENTS: ----------------------------------- We acknowledge and recognize the following agencies that have contributed data to the MAGPlot database: Government of Alberta - Ministry of Agriculture, Forestry, and Rural Economic Development - Forest Stewardship and Trade Branch Government of British Columbia - Ministry of Forests - Forest Analysis and Inventory Branch Government of Manitoba - Ministry of Economic, Development, Investment, Trade, and Natural Resources - Forestry and Peatlands Branch Government of New Brunswick - Ministry of Natural Resources and Energy Development - Forestry Division, Forest - Planning and Stewardship Branch Government of Newfoundland & Labrador - Department of Fisheries, Forestry and Agriculture - Forestry Branch Government of Nova Scotia - Ministry of Natural Resources and Renewables - Department of Natural Resources and Renewables Government of Northwest Territories - Department of Environment & Climate Change - Forest Management Division Government of Ontario - Ministry of Natural Resources and Forestry - Science and Research Branch, Forest Resources Inventory Unit Government of Prince Edward Island - Department of Environment, Energy, and Climate Action - Forests, Fish, and Wildlife Division Government of Quebec - Ministry of Natural Resources and Forests - Forestry Sector Government of Saskatchewan - Ministry of Environment - Forest Service Branch Government of Yukon - Ministry of Energy, Mines, and Resources - Forest Management Branch Government of Canada - Natural Resources Canada - Canadian Forest Service - National Forest Inventory Projects Office
-

Wildfire ignition density rasters separated by cause (human, natural (lightning)) for mean and normalized mean summaries from 1980 to 2023.
-

Multi-Agency Ground Plot (MAGPlot) database (DB) is a pan-Canadian forest ground-plot data repository. The database synthesize forest ground plot data from various agencies, including the National Forest Inventory (NFI) and 12 Canadian jurisdictions: Alberta (AB), British Columbia (BC), Manitoba (MB), New Brunswick (NB), Newfoundland and Labrador (NL), Nova Scotia (NS), Northwest Territories (NT), Ontario (ON), Prince Edward Island (PE), Quebec (QC), Saskatchewan (SK), and Yukon Territory (YT), contributed in their original format. These datasets underwent data cleaning and quality assessment using the set of rules and standards set by the contributors and associated documentations, and were standardized, harmonized, and integrated into a single, centralized, and analysis-ready database. The primary objective of the MAGPlot project is to collate and harmonize forest ground plot data and to present the data in a findable, accessible, interoperable, and reusable (FAIR) format for pan-Canadian forest research. The current version includes both historical and contemporary forest ground plot data provided by data contributors. The standardized and harmonized dataset includes eight data tables (five site related and three tree measurement tables) in a relational database schema. Site-related tables contain information on geographical locations, treatments (e.g. stand tending, regeneration, and cutting), and disturbances caused by abiotic factors (e.g., weather, wildfires) or biotic factors (e.g., disease, insects, animals). Tree-related tables, on the other hand, focus on measured tree attributes, including biophysical and growth parameters (e.g., DBH, height, crown class), species, status, stem conditions (e.g., broken or dead tops), and health conditions. While most contributors provided large and small tree plot measurements, only NFI, AB, MB, and SK contributed datasets reported at regeneration plot level (e.g., stem count, regeneration species). Future versions are expected to include updated and/or new measurement records as well as additional tables and measured and compiled (e.g., tree volume and biomass) attributes. MAGPlot is hosted through Canada’s National Forest Information System (https://nfi.nfis.org/en/maps). ------------------------------------------------------ LATEST SITE DISTURBANCES LAYER: ------------------------------------------------------ Shows the most recently recorded disturbance class at each MAGPlot site. These disturbance classes are broad categories, with more detailed disturbance types available in the full dataset. ----------- NOTES: ----------- The MAGPlot release (v1.0 and v1.1) does not include NL and SK datasets due to pending Data Sharing Agreements, ongoing data processing, or restrictions on third-party sharing. These datasets will be included in future releases. While certain jurisdictions permit open or public data sharing, given that requestor signs and adheres the Data Use agreement, there are some jurisdictions that require a jurisdiction-specific request form to be signed in addition to the Data Use Agreement form. For the MAGPlot Data Dictionary, other metadata, datasets available for open sharing (with approximate locations), data requests (for other datasets or exact coordinates), and available data visualization products, please check all the folders in the “Data and Resources” section below. Coordinates in web services have been randomized within 5km of true location to preserve site integrity. Access the WMS (Web Map Service) layers from the “Data and Resources” section below. A data request must be submitted to access historical datasets, datasets restricted by data-use agreements, or exact plot coordinates using the link below. NFI Data Request Form: https://nfi.nfis.org/en/datarequestform --------------------------------- ACKNOWLEDGEMENT: --------------------------------- We acknowledge and recognize the following agencies that have contributed data to the MAGPlot database: Government of Alberta - Ministry of Agriculture, Forestry, and Rural Economic Development - Forest Stewardship and Trade Branch Government of British Columbia - Ministry of Forests - Forest Analysis and Inventory Branch Government of Manitoba - Ministry of Economic, Development, Investment, Trade, and Natural Resources - Forestry and Peatlands Branch Government of New Brunswick - Ministry of Natural Resources and Energy Development - Forestry Division, Forest Planning and Stewardship Branch Government of Newfoundland & Labrador - Department of Fisheries, Forestry and Agriculture - Forestry Branch Government of Nova Scotia - Ministry of Natural Resources and Renewables - Department of Natural Resources and Renewables Government of Northwest Territories - Department of Environment & Climate Change - Forest Management Division Government of Ontario - Ministry of Natural Resources and Forestry - Science and Research Branch, Forest Resources Inventory Unit Government of Prince Edward Island - Department of Environment, Energy, and Climate Action - Forests, Fish, and Wildlife Division Government of Quebec - Ministry of Natural Resources and Forests - Forestry Sector Government of Saskatchewan - Ministry of Environment - Forest Service Branch Government of Yukon - Ministry of Energy, Mines, and Resources - Forest Management Branch Government of Canada - Natural Resources Canada - Canadian Forest Service - National Forest Inventory Projects Office
-

The Canadian Gravity Anomaly Data Base consists of approximately 660 000 gravity observations, including 165 000 on land, acquired between 1944 and the present. The data spacing ranges from less than 1 km to over 20 km, with an average spacing between 5 and 10 km. All measurements were reduced to the IGSN71 datum. Theoretical gravity values were calculated from the Geodetic Reference System 1967 (GRS67) gravity formula. Bouguer anomalies were calculated using a vertical gravity gradient of 0.3086 mGal·m-1 and a crustal density of 2 670 kg·m-3.
-
The Common Attribute Schema for Forest Resource Inventories (CASFRI) is a Canadian forest resource inventory data repository. Forest resource inventory datasets in CASFRI are harmonized to a common data model so that data collected by different agencies following different standards can be used together. Participating provincial, territorial and federal government departments and agencies share current and historical map-based forest resource inventory datasets through CASFRI so that their data are available to users who’s areas of interest span multiple jurisdictions. CASFRI was originally developed by academic researchers (Cumming et al., https://doi.org/10.1139/cjfr-2014-0102). This flavour of CASFRI (CASFRIv5) was developed anew in collaboration with academic researchers at the University of Laval to provide a government version of CASFRI that is findable, accessible, interoperable, and reusable. It uses the most up-to-date forest inventory data provided by participating provincial, territorial, and federal government departments and agencies. CASFRIv5 is hosted on the Canadian Council of Forest Ministers’ data portal, the National Forest Information System (http://nfis.org).
-
The Regional Air Quality Deterministic Prediction System FireWork (RAQDPS-FW) carries out physics and chemistry calculations, including emissions from active wildfires, to arrive at deterministic predictions of chemical species concentration of interest to air quality, such as fine particulate matter PM2.5 (2.5 micrometers in diameter or less). Geographical coverage is Canada and the United States. Data is available at a horizontal resolution of 10 km. While the system encompasses more than 80 vertical levels, data is available only for the surface level. The products are presented as historical, annual or monthly, averages which highlight long-term trends in cumulative effects on the environment.