 Arctic SDI catalogue
tendances
Type of resources
Available actions
Keywords
Contact for the resource
Provided by
Years
Representation types
Update frequencies
status
Service types
-
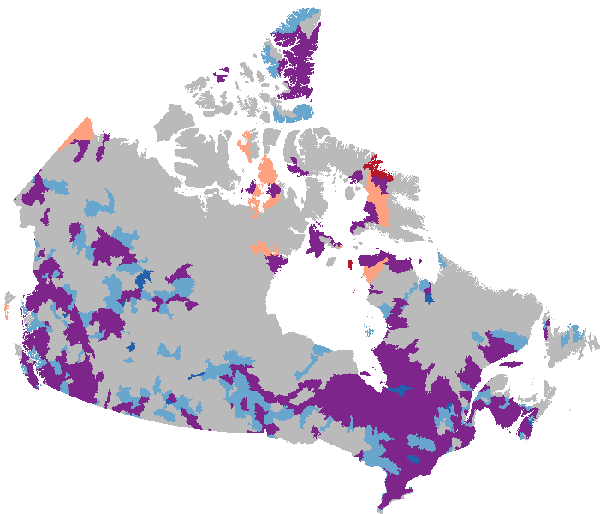
This series provides maps of trends in annual mean temperature and annual total precipitation for Canada over the period 1948-2012. Trends in Canada’s climate are analyzed to provide a comprehensive view of the climate variability and long-term changes over the period of instrumental record. Observed daily temperatures and precipitations were first homogenized/adjusted to account for changes in instrumentation, observing practices and relocation of observing sites. Annual mean anomalies from the 1961-1990 reference period were then obtained at individual sites and interpolated to 50-km spaced grid. Trends in annual mean temperature show significant warming from 1 to 3°C almost everywhere across Canada for 1948-2012. Trends in annual total precipitation indicate a significant increase in precipitation of 10 to 30% during 1948-2012 in the northern regions and in a few small areas in the south. For more information, please consult the article “Observed Trends in Canada’s Climate and Influence of Low-Frequency Variability Modes” published in the Journal of Climate (doi: http://dx.doi.org/10.1175/JCLI-D-14-00697.1). / Cette série fournit des cartes des tendances de la température moyenne annuelle et des précipitations totales annuelles pour le Canada au cours de la période 1948-2012. Les tendances du climat du Canada sont analysées pour fournir une vue d'ensemble de la variabilité climatique et des changements à long terme au cours de la période instrumentale. Les températures et les précipitations quotidiennes observées ont d'abord été homogénéisées/ajustées pour tenir compte des changements d'instrumentation, des pratiques d'observation et de la relocalisation des sites d'observation. Les anomalies moyennes annuelles de la période de référence 1961-1990 ont ensuite été obtenues sur des sites individuels et interpolées à une grille espacée de 50 km. Les tendances de la température moyenne annuelle montrent un réchauffement important de 1 à 3 ° C presque partout au Canada pour 1948-2012. Les tendances des précipitations totales annuelles indiquent une augmentation significative des précipitations de 10 à 30% en 1948-2012 dans les régions du nord et dans quelques petites régions du sud. Pour plus d'informations, veuillez consulter l'article intitulé «Tendances observées dans le climat et l'influence du Canada sur les modes de variabilité à faible fréquence» publié dans Journal of Climate (doi: http://dx.doi.org/10.1175/JCLI-D-14-00697.1).
-
This collection of flood susceptibility products captures temporal patterns of historic flood events from 2000 to 2023, derived from flood susceptibility maps. The layers are designed to support decision-making by providing easily interpretable information for planning, screening, and other management purposes. This collection contains several datasets which explore the suite of rasters from 2000 to 2023: - Extreme wet and extreme dry years and the associated average flood susceptibility, processed by NHN WU, as found by Generalized Extreme Value (GEV) analysis - Flood susceptibility envelope, which is derived from the above wet and dry years - Trend slope, for each pixel the value for each year is extracted and the linear trend is computed, greater than 1000 is increasing flood susceptibility and below 1000 is decreasing flood susceptibility. - Trend Class, as identified by wet and dry scores, applied to NHN WU - Current flood susceptibility, which represents the estimated average value of present-day flood susceptibility - Current interquartile range, which provides and indication of the temporal variability of a given pixel under the current regime. This dataset forms part of a broader collection of flood susceptibility datasets, offering related information and analyses. The collection includes an overview page with associated publications, historic susceptibility values, temporal trends, and future projections. - **[Collection - Flood Susceptibility Mapping](https://open.canada.ca/data/en/dataset/1074f781-85d3-4c86-86cb-fd1c339197dc)** - **[Historic - Flood Susceptibility Mapping](https://open.canada.ca/data/en/dataset/ea1384df-bf4a-4743-97bb-870dc43f8d77)** - **[Future - Flood Susceptibility Mapping](https://open.canada.ca/data/en/dataset/c00f95a3-7bab-4d28-b9cc-b30f06b5afd2)**