 Arctic SDI catalogue
Temperature
Type of resources
Available actions
Topics
Keywords
Contact for the resource
Provided by
Years
Formats
Representation types
Update frequencies
status
Service types
Scale
-
The impact of climatic variability on the environment is of great importance to the agricultural sector in Canada. Monitoring the impacts on water supplies, soil degradation and agricultural production is essential to the preparedness of the region in dealing with possible drought and other agroclimate risks. Derived normal climate data represent 30-year averages (1961-1990, 1971-2000, 1981-2010, 1991-2020) of climate conditions observed at a particular location. The derived normal climate data represents 30-year averages or “normals” for precipitation, temperature, growing degree days, crop heat units, frost, and dry spells. These normal trends are key to understanding agroclimate risks in Canada. These normal can be used as a baseline to compare against current conditions, and are particularly useful for monitoring drought risk.
-

Contained within the 5th Edition (1978 to 1995) of the National Atlas of Canada has a large that shows the extent of permafrost and abundance of ground ice; mapping units are based on physiographic regions. Point data on map give permafrost temperature and thickness for specific sites. The second, smaller, map shows the mean annual ground temperatures. Graphs show four shallow temperature profiles (to 25 metres depth), and four deep temperature profiles (to several hundred metres depth). Heginbottom, J. A., Dubreuil, M. -A. & Harker, P. (1995). Canada, permafrost. In The National Atlas of Canada (5 ed.). Natural Resources Canada, Geomatics Canada, MCR Series, 4177, Natural Resources Canada. https://doi.org/10.4095/294672
-

Description: Seasonal temperature climatology of the Northeast Pacific Ocean was computed from historical observations including all available conductivity-temperature-depth (CTD), bottle, expendable bathy-thermograph (XBT), and Argo data in NOAA (http://www.argo.ucsd.edu/), Marine Environmental Data Service (MEDS), and Institute of Ocean Sciences archives over 1980 to 2010 period. Methods: Calculations, including smooth and interpolation, were carried out in sixty-five subregions and up to fifty-two vertical levels from surface to 5000m. Seasonal averages were computed as the median of yearly seasonal values. Spring months were defined as April to June, summer months were defined as July to September, fall months were defined as October to December, and winter months were defined as January to March. The data available here contain raster layers of seasonal temperature climatology for the Canadian Pacific Exclusive Economic Zone (EEZ), a subset of seasonal climatology of the Northeast Pacific Ocean, in high spatial resolution of 1/300 degree. References: Foreman, M. G. G., W. R. Crawford, J. Y. Cherniawsky, and J. Galbraith (2008). Dynamic ocean topography for the northeast Pacific and its continental margins, Geophys. Res. Lett., 35, L22606, doi: 10.1029/2008GL035152. Data Sources: NOAA, MEDS and IOS observational data Uncertainties: Uncertainties are introduced when quality controlled observational data are spatially interpolated to varying distances from the observation point. Climatological averages are calculated from these interpolated values.
-

Description: Seasonal climatologies for temperature of the Northeast Pacific Ocean were computed to cover the period 2001 to 2020. Historical observations included all available conductivity-temperature-depth (CTD), bottle and profiling floats in the NODC World Ocean Database, Marine Environmental Data Services (MEDS), Institute of Ocean Sciences Water Properties website and the Canadian Integrated Ocean Observing System (CIOOS Pacific). Methods: Interpolation was carried out in up to fifty-two vertical levels from surface to 5000m. Data-Interpolating Variational Analysis (DIVA) was used for spatial interpolation for all years within each season and estimates projected onto a consistent grid. The average of the grid nodes was calculated to obtain the seasonal climatology. DIVA was used again on the final climatology followed by a median filter and a 5-point smoother. Spring months were defined as April to June, summer months were defined as July to September, fall months were defined as October to December, and winter months were defined as January to March. The data available here contain raster layers of seasonal temperature climatologies for the Canadian Pacific Exclusive Economic Zone (EEZ), a subset of seasonal climatologies of the Northeast Pacific Ocean, in high spatial resolution of 1/300 degree. Data Sources: NODC, MEDS, IOS and CIOOS Pacific Data. Uncertainties: Uncertainties are introduced when quality controlled observational data are spatially interpolated to varying distances from the observation point. Climatological averages are calculated from these interpolated values.
-
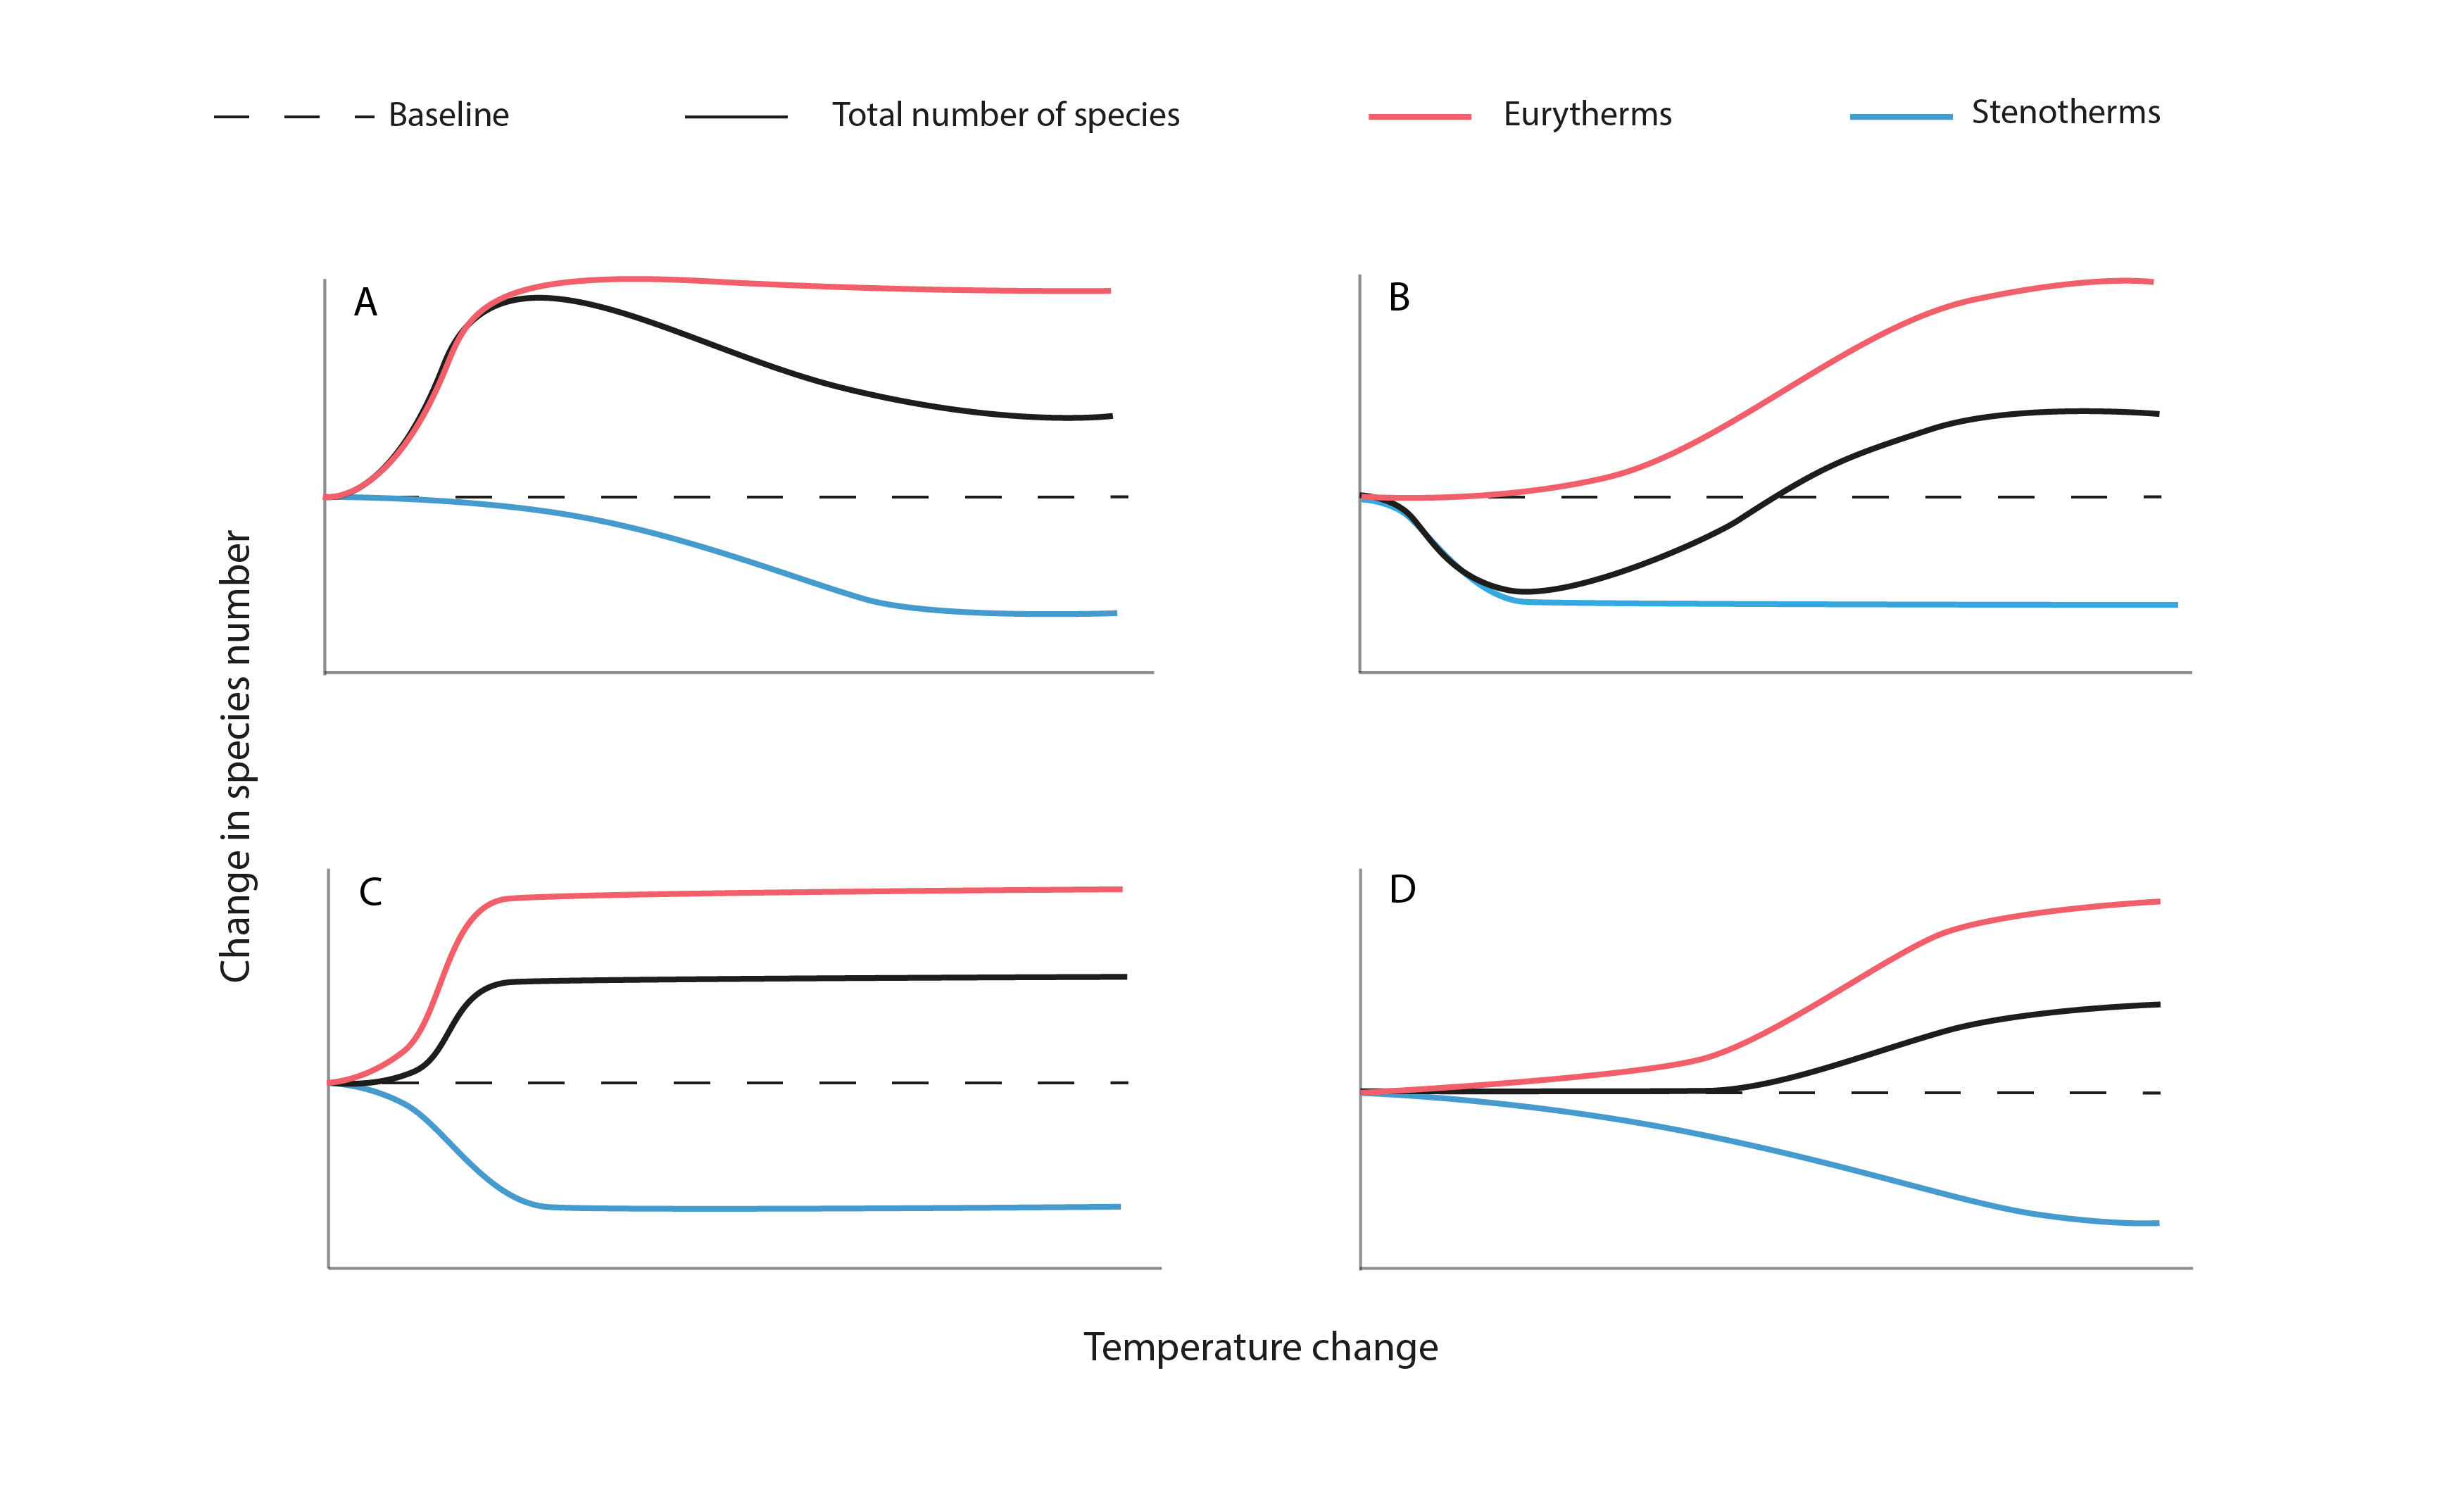
Figure 3-6. The hypothesized effects of rising mean water temperature on biodiversity (as total species number) of Arctic freshwater ecosystems. A pulsed increase in gamma biodiversity (a) results from the combination of high eurythermal invasion and establishment and low stenothermic loss with increasing water temperature. A pulsed decrease in gamma biodiversity (b) results from the combination of low eurythermal invasion and establishment and high stenothermic loss. Rapid increases (c) and slow increases (d) in species diversity occur, respectively, with high eurythermal invasion and establishment coupled with high stenothermic loss or low eurythermal invasion and establishment and low stenothermic loss as temperatures increase. For simplification, barriers to dispersal have been assumed to be limited in these models. State of the Arctic Freshwater Biodiversity Report - Chapter 3 - Page 23 - Figure 3-6
-
Crop/Corn Heat Units (CHU) is a temperature-based index often used by farmers and agricultural researchers to estimate whether the climate is warm enough to grow corn. Daily crop heat units are calculated from minimum and maximum temperatures with separate calculations for day and night. The daytime relationship sets the minimum at 10 C for growth up to a maximum of 30 C, beyond which growth slows. These values are calculated across Canada in 10x10 km cells.
-
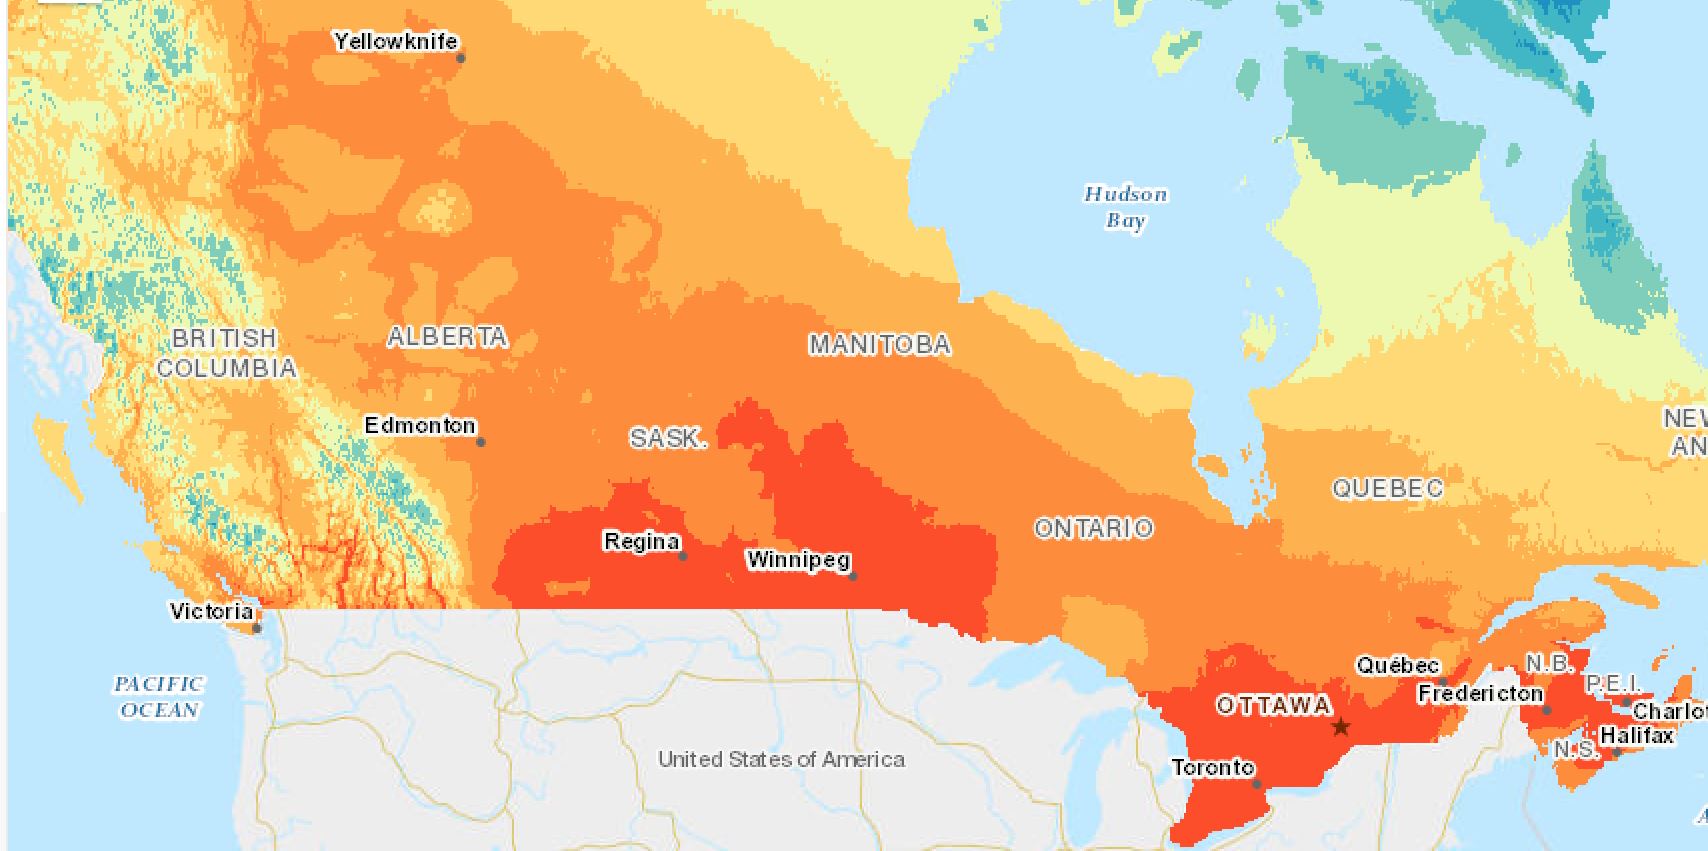
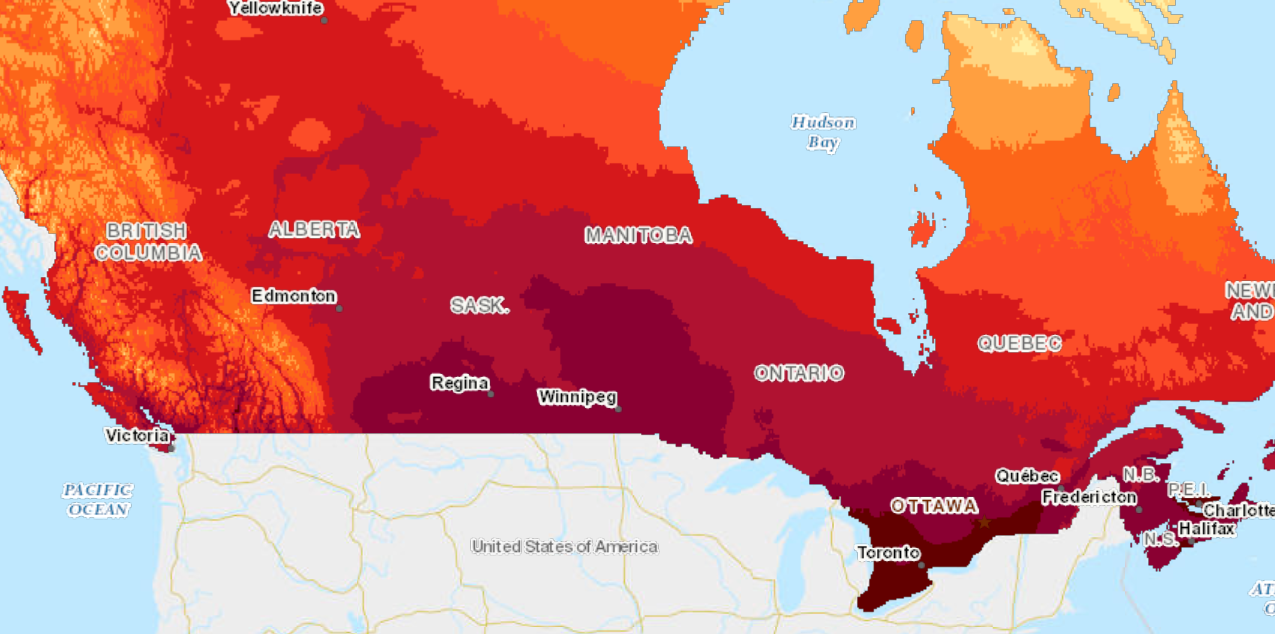
Monthly 30-year Average Mean Temperature represents the average monthly mean temperature calculated at a given location averaged across a 30 year period (1961-1991, 1971-2000, 1981-2010, 1991-2020). These values are calculated across Canada in 10x10 km cells.
-

Monthly 30-year Average Minimum Temperature represents the average monthly minimum temperature calculated at a given location averaged across a 30 year period (1961-1991, 1971-2000, 1981-2010, 1991-2020). These values are calculated across Canada in 10x10 km cells.
-

Monthly 30-year Average Maximum Temperature represents the average monthly maximum temperature calculated for a given location averaged across a 30 year period (1961-1991, 1971-2000, 1981-2010, 1991-2020). These values are calculated across Canada in 10x10 km cells.
-

30-year Average Number of Days with Temperature above 32 °C are defined as the count of the number of climate days during the month where the maximum daily temperature was greater than 32 °C. These values are calculated across Canada in 10x10 km cells.