 Arctic SDI catalogue
Grassland
Type of resources
Available actions
Topics
Keywords
Contact for the resource
Provided by
Formats
Representation types
Update frequencies
status
-

The main high resolution grassland product is the Grassland layer, a grassland/non-grassland mask for the EEA39 area. This grassy and non-woody vegetation baseline product includes all kinds of grasslands: managed grassland, semi-natural grassland and natural grassy vegetation. It is a binary status layer mapping grassland and all non-grassland areas in 20m and (aggregated) 100m pixel size. Two additional (expert) products complete the high resolution grassland product: the Ploughing Indicator (PLOUGH) and the Grassland Vegetation Probability Index (GRAVPI). While the PLOUGH concentrates on historic land cover features with the aim to indicate ploughing activities in preceding years, the GRAVPI provides a measure of classification reliability. GRAVPI is a 20m pixel size product, mapping on a range of 1-100 the class probability. PLOUGH is a 20m pixel size additional product, mapping from 1-6 the number of years since the last indication of ploughing. A verification of the Grassland layer was performed by the Institute of Nature Research during autumn of 2018 and the data and resulting report are made available on the NLSI websites.
-
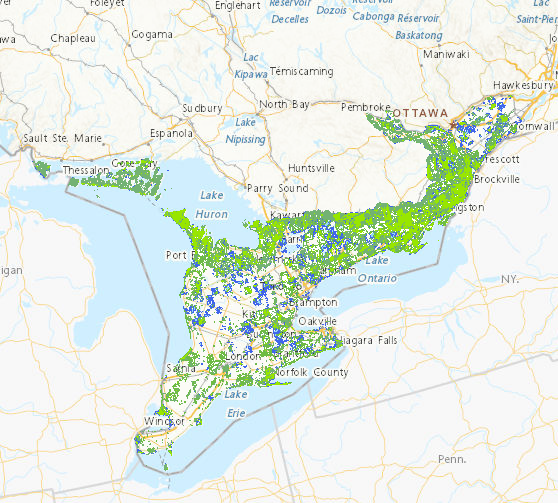
The Canadian Wildlife Service - Ontario Region Biodiversity Atlas represents the Canadian Wildlife Service biodiversity portfolio across the Ontario portions of the Boreal Hardwood Shield (Bird Conservation Region 12) and Mixedwood Plains (Bird Conservation Region 13) ecozones. These data are the derived product from an extensive landscape assessment that assessed the Canadian Wildlife Service biodiversity portfolio (Species at Risk, migratory birds, habitat) at various resolutions. Biodiversity is mapped by forest, grassland (open country) and wetland quality and quantity, and then progressively combined to identify local High Value Biodiversity Areas. At the finest resolution, scores were applied to each unit of analysis (5 hectare hexagon in Bird Conservation Region 12; 2 hectare hexagon in Bird Conservation Region 13), based on over 30 criteria for landscape habitat condition, Species at Risk and migratory birds. Habitat condition scores were derived from guidance in Environment and Climate Change Canada's existing How Much Habitat is Enough? and in Bird Conservation Region 12, where the landscape is less fragmented, habitat was also based on draft guidance in How Much Disturbance is too Much? Individual scores were summed and various combinations (e.g. top 25% of forest scores + top 25% of Species at Risk (SAR) scores) were calculated to identify areas with multiple conservation value. For each habitat type (forest, grassland and wetland), study units with more than one conservation value were aggregated into High Value Habitat which were subsequently aggregated into High Value Biodiversity Areas (HVBA). The results are areas on the landscape that have high value from a Canadian Wildlife Service specific lens; that is, they are high quality habitats that are important for Species at Risk and/or migratory birds. High value habitats are those forests, grasslands and wetlands with potential high conservation value (PHCV). They contain at least 1 of a possible 3 potential high conservation values: top 25% of overall habitat scores, top 25% of Species at Risk (SAR) scores, and/or top 25% of relevant migratory bird scores. High value forest, grassland and wetland were derived by combining landscape, Species at Risk (SAR) and migratory bird elements (see Table 1). Overall habitat scores were assigned to each study unit based on the combined scores for each forest, grassland and wetland. These overall habitat scores were divided into quartiles, and the top 25% of each total score (overall forest, overall grassland and overall wetland) are considered to be potential high conservation value. Similarly, SAR scores were assigned for each study unit, totalled and broken into quartiles. The top 25% of SAR scores that intersect each of forest, grassland and wetland are considered to be the highest quality habitats important to SAR and have potential high conservation value. Finally, relevant migratory bird scores were totalled within each study unit, divided into quartiles and the top 25% of migratory bird scores that intersect each of forest, grassland and wetland are considered to be the highest quality habitats important to migratory birds and have potential high conservation value. Study units with a PHCV greater than 0 (i.e., contains at least 1 of the possible 3 potential high conservation values) were aggregated together by 750 m to create High Value Habitats. High value biodiversity areas (HVBAs) are those study units that contain multiple high value habitats (high value forest and/or high value grassland and/or high value wetland). High value biodiversity areas (HVBA) were derived by aggregating high value forest, grassland and wetland. Study units with a potential high conservation value greater than 1 were aggregated together by 750 m. Biodiversity sites are areas greater than 20 ha, and secondary biodiversity sites are areas less than 20 ha in area.