 Arctic SDI catalogue
Atlas
Type of resources
Topics
Keywords
Contact for the resource
Provided by
Formats
Representation types
Update frequencies
status
-

Produced as part of the St. Lawrence Action Plan, the Atlas of Territories of Conservation Interest in the St. Lawrence Lowlands shows the sites where conservation needs are the most pressing. The conservation targets selected (coarse filter) are forest environments, wetlands, open environments (wastelands, perennial crops) and aquatic environments to which are added elements of the fine filter such as exceptional aquatic environments associated with the St. Lawrence corridor (e.g. spawning grounds), alvars, bird colonies, wildlife elements (e.g. nesting sites of Bank Swallows and Chimney Swift, etc.) and important floristic occurrences. Our objective is to determine the sites of interest until a representative threshold of 20% is reached. The geospatial data associated with sites of interest for conservation, the user guide, the methodological report, the metadata as well as the detailed mapping of land use in the St. Lawrence Lowlands, which was an essential basic data for producing this atlas, are available for download. Users can therefore more accurately consult the spatial distribution of sites of interest and the conservation value associated with each plot of habitat for conservation targets (forest environments, wetlands, wastelands, perennial crops, aquatic environments) using geographic information systems (e.g. ArcGIS). Users can also adapt the analysis of this data to their territorial reality and according to specific objectives specific to their interests. Since the conservation of natural environments and species in precarious situations is a shared responsibility, this Atlas will make it possible to meet the priorities of the many organizations involved in the conservation of natural environments in the St. Lawrence Lowlands.**This third party metadata element was translated using an automated translation tool (Amazon Translate).**
-

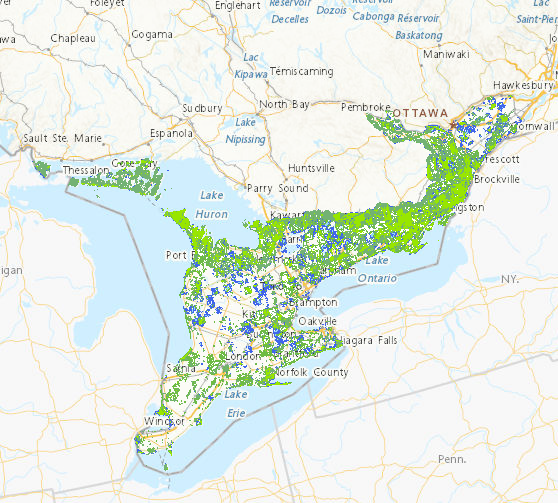
The Canadian Wildlife Service - Ontario Region Biodiversity Atlas represents the Canadian Wildlife Service biodiversity portfolio across the Ontario portions of the Boreal Hardwood Shield (Bird Conservation Region 12) and Mixedwood Plains (Bird Conservation Region 13) ecozones. These data are the derived product from an extensive landscape assessment that assessed the Canadian Wildlife Service biodiversity portfolio (Species at Risk, migratory birds, habitat) at various resolutions. Biodiversity is mapped by forest, grassland (open country) and wetland quality and quantity, and then progressively combined to identify local High Value Biodiversity Areas. At the finest resolution, scores were applied to each unit of analysis (5 hectare hexagon in Bird Conservation Region 12; 2 hectare hexagon in Bird Conservation Region 13), based on over 30 criteria for landscape habitat condition, Species at Risk and migratory birds. Habitat condition scores were derived from guidance in Environment and Climate Change Canada's existing How Much Habitat is Enough? and in Bird Conservation Region 12, where the landscape is less fragmented, habitat was also based on draft guidance in How Much Disturbance is too Much? Individual scores were summed and various combinations (e.g. top 25% of forest scores + top 25% of Species at Risk (SAR) scores) were calculated to identify areas with multiple conservation value. For each habitat type (forest, grassland and wetland), study units with more than one conservation value were aggregated into High Value Habitat which were subsequently aggregated into High Value Biodiversity Areas (HVBA). The results are areas on the landscape that have high value from a Canadian Wildlife Service specific lens; that is, they are high quality habitats that are important for Species at Risk and/or migratory birds. High value habitats are those forests, grasslands and wetlands with potential high conservation value (PHCV). They contain at least 1 of a possible 3 potential high conservation values: top 25% of overall habitat scores, top 25% of Species at Risk (SAR) scores, and/or top 25% of relevant migratory bird scores. High value forest, grassland and wetland were derived by combining landscape, Species at Risk (SAR) and migratory bird elements (see Table 1). Overall habitat scores were assigned to each study unit based on the combined scores for each forest, grassland and wetland. These overall habitat scores were divided into quartiles, and the top 25% of each total score (overall forest, overall grassland and overall wetland) are considered to be potential high conservation value. Similarly, SAR scores were assigned for each study unit, totalled and broken into quartiles. The top 25% of SAR scores that intersect each of forest, grassland and wetland are considered to be the highest quality habitats important to SAR and have potential high conservation value. Finally, relevant migratory bird scores were totalled within each study unit, divided into quartiles and the top 25% of migratory bird scores that intersect each of forest, grassland and wetland are considered to be the highest quality habitats important to migratory birds and have potential high conservation value. Study units with a PHCV greater than 0 (i.e., contains at least 1 of the possible 3 potential high conservation values) were aggregated together by 750 m to create High Value Habitats. High value biodiversity areas (HVBAs) are those study units that contain multiple high value habitats (high value forest and/or high value grassland and/or high value wetland). High value biodiversity areas (HVBA) were derived by aggregating high value forest, grassland and wetland. Study units with a potential high conservation value greater than 1 were aggregated together by 750 m. Biodiversity sites are areas greater than 20 ha, and secondary biodiversity sites are areas less than 20 ha in area.
-
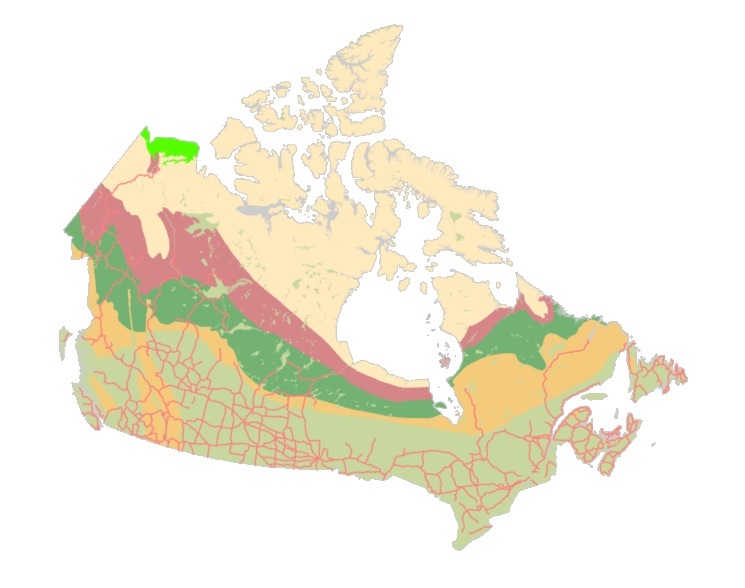
The "Starter Kits" of the Canadian Geospatial Data Infrastructure (CGDI) are curated bundles of geospatial data delivered as a service. These kits are the result of a user needs assessment commissioned by Natural Resources Canada (NRCan), with a primary focus on addressing the specific requirements of Indigenous Peoples. Within these kits, you'll discover a selection of data provided as a service from a collection of over 71,000 datasets falling under the "Nature and Environment" category sourced from CGDI's Federal and Provincial/Territorial partners. These Starter Kits have been thoughtfully crafted into four thematic or geographic areas of Canada: a) British Columbia, b) Northwest Territories, c) Climate Change across Canada, d) And Water Resources across Canada. Each of these kits represents diverse areas and data categories, offering new users a compact, comprehensive, and user-friendly gateway to explore a wide array of information provided by the CGDI.