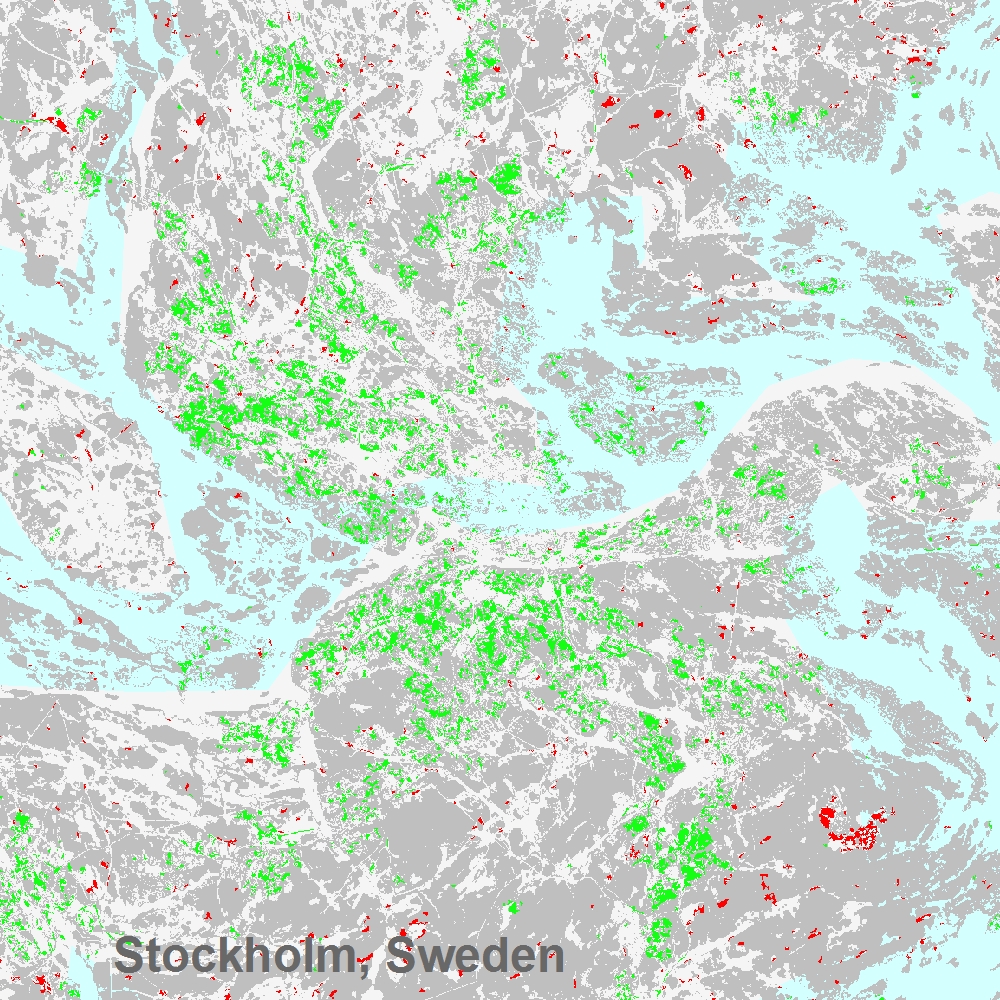
 Arctic SDI catalogue
GeoTIFF
Type of resources
Available actions
Topics
Keywords
Contact for the resource
Provided by
Years
Formats
Representation types
Update frequencies
status
Scale
Resolution
-

The Imperviousness Density (IMD) 2021 with a 100m pixel resolution, is part of the High Resolution Layer (HRL) Imperviousness and contains the approximate density of artificial sealing per pixel (range: 0-100%) for the reference year 2021 as derived from a pixel aggregation of the Imperviousness Density (IMD) 2021 (10m) layer. The production of the HRL Imperviousness is coordinated by EEA in the frame of Copernicus, the Earth observation component of the European Union’s Space programme. The product is a raster dataset with 100-meter grid spacing (spatial resolution) that covers the 38 Eionet member and cooperating countries as well as the United Kingdom (i.e. EEA38+UK). It is distributed as 100 x 100 km tiles that are fully conformant with the EEA reference grid.
-
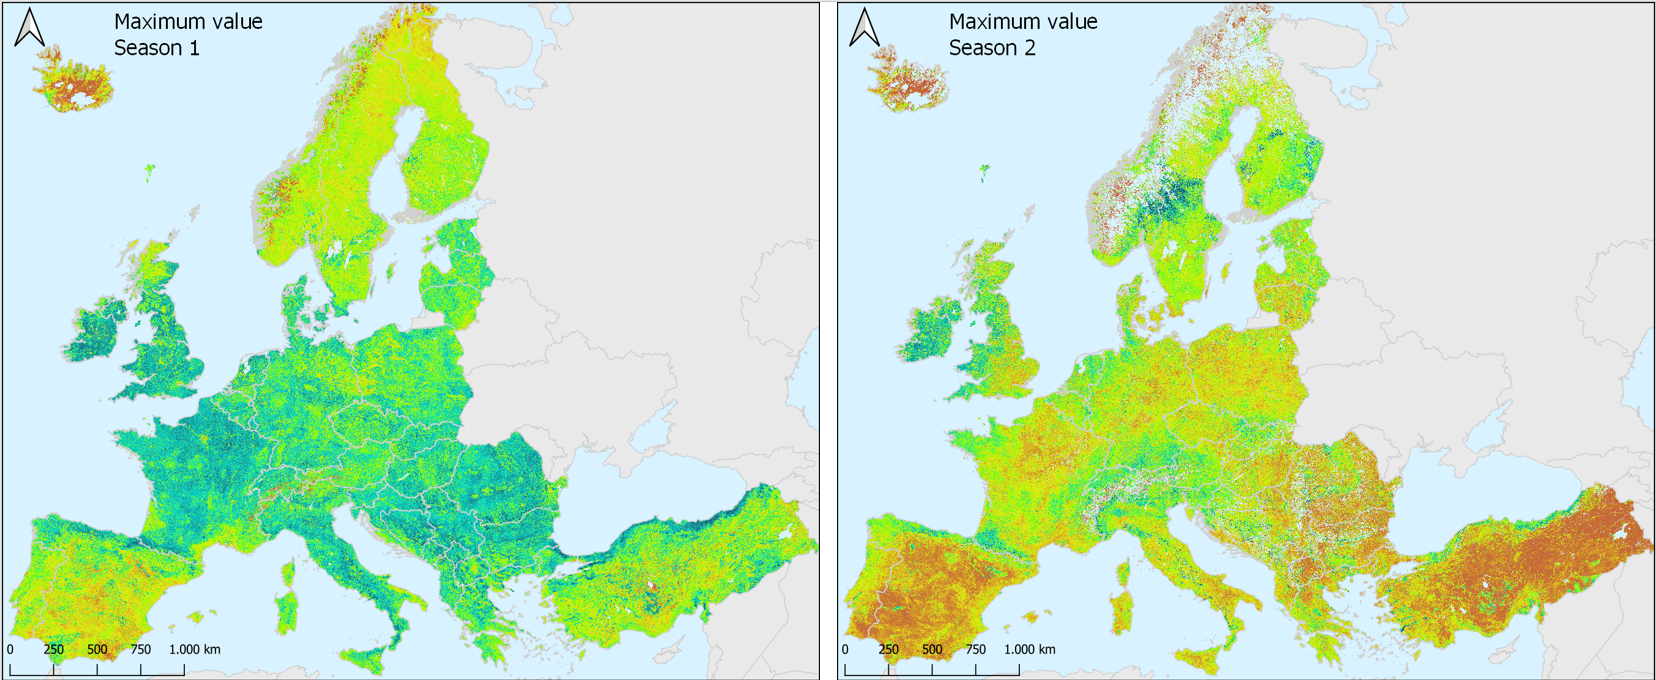
The Season Maximum Value (MAXV), one of the Vegetation Phenology and Productivity (VPP) parameters, is a product of the pan-European High Resolution Vegetation Phenology and Productivity (HR-VPP) component of the Copernicus Land Monitoring Service (CLMS). The Season Maximum Value (MAXV) provides the maximum (peak) value that the Plant Phenology Index (PPI) reaches during the vegetation growing season. The Plant Phenology Index (PPI) is a physically based vegetation index, developed for improving the monitoring of the vegetation growth cycle. The PPI index values, with 5-day satellite revisit cycle, are first used in a function fitting to derive the PPI Seasonal Trajectories, which is a filtered time series with regular 10-day time step. From these Seasonal Trajectories, a suite of 13 Vegetation Phenology and Productivity (VPP) parameters are then computed and provided, for up to two seasons each year. The Season Maximum Value is one of the 13 parameters. The full list is available in the table 3 of the Product User Manual in the below link section. A complementary quality indicator (QFLAG) provides a confidence level, that is described in table 4 of the same manual. The MAXV dataset is made available as raster files with 10 x 10m resolutionand 100 x 100m resolutions, in ETRS89-LAEA projection corresponding to the HRL grid, for those tiles that cover the EEA38 countries and the United Kingdom and for two seasons in each year from 2017 onwards. It is updated in the first quarter of each year.
-
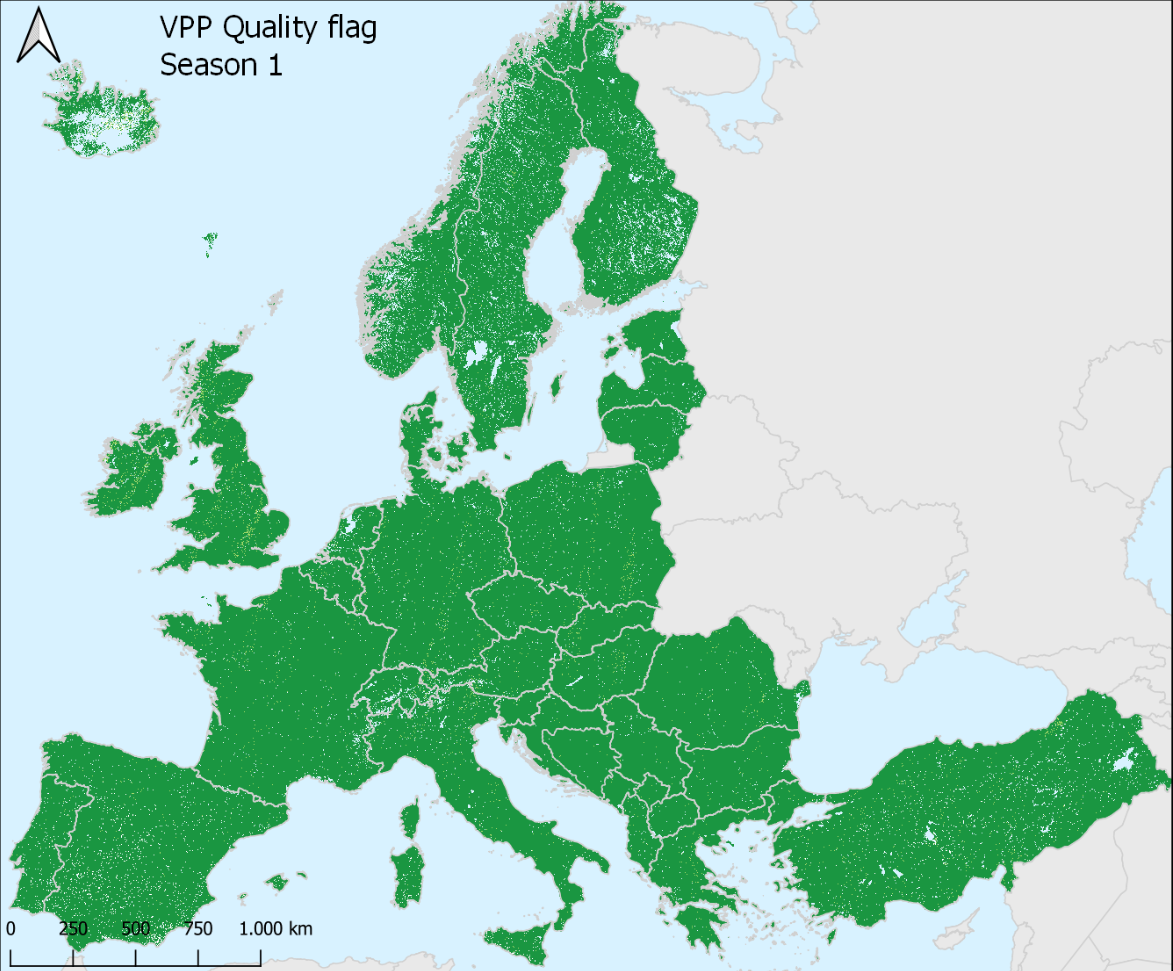
The Quality Flag (QFLAG), one of the Vegetation Phenology and Productivity (VPP) parameters, is a product of the pan-European High Resolution Vegetation Phenology and Productivity (HR-VPP) component of the Copernicus Land Monitoring Service (CLMS). The Plant Phenology Index (PPI) is a physically based vegetation index, developed for improving the monitoring of the vegetation growth cycle. The PPI index values, with 5-day satellite revisit cycle, are first used in a function fitting to derive the PPI Seasonal Trajectories, which is a filtered time series with regular 10-day time step. From these Seasonal Trajectories, a suite of 13 Vegetation Phenology and Productivity (VPP) parameters are then computed and provided, for up to two seasons each year. The Seasonal Productivity is one of the 13 parameters. The Quality Flag (QFLAG) is a quality indicator for the above set of 13 Vegetation Phenology and Productivity (VPP) parameters and provides a confidence level, that is described in table 4 of the same manual. The QFLAG dataset is made available as raster files with 10 x 10m resolution, in UTM/WGS84 projection corresponding to the Sentinel-2 tiling grid, for those tiles that cover the EEA38 countries and the United Kingdom and for two seasons in each year from 2017 onwards. It is updated in the first quarter of each year.
-
The High Resolution Layer Imperviousness Change (IMC) 2015-2018 is a 20m raster dataset showing change in imperviousness between 2015 and 2018 reference years, produced in the frame of the EU Copernicus programme. The high resolution imperviousness products capture the percentage and change of soil sealing. Built-up areas are characterized by the substitution of the original (semi-) natural land cover or water surface with an artificial, often impervious cover. These artificial surfaces are usually maintained over long periods of time. A series of high resolution imperviousness datasets (for the 2006, 2009, 2012, 2015 and 2018 reference years) with all artificially sealed areas was produced using automatic derivation based on calibrated Normalized Difference Vegetation Index (NDVI). This series of imperviousness layers constitutes the main status layers. They are per-pixel estimates of impermeable cover of soil (soil sealing) and are mapped as the degree of imperviousness (0-100%). Imperviousness change layers were produced as a difference between the reference years (2006-2009, 2009-2012, 2012-2015, 2015-2018 and additionally 2006-2012, to fully match the CORINE Land Cover production cycle) and are presented 1) as degree of imperviousness change (-100% -- +100%), in 20m and 100m pixel size, and 2) a classified (categorical) 20m change product. This dataset is provided as 20 meter rasters (fully conformant with EEA reference grid) in 100 x 100 km tiles grouped according to the EEA38 countries and the United Kingdom.
-
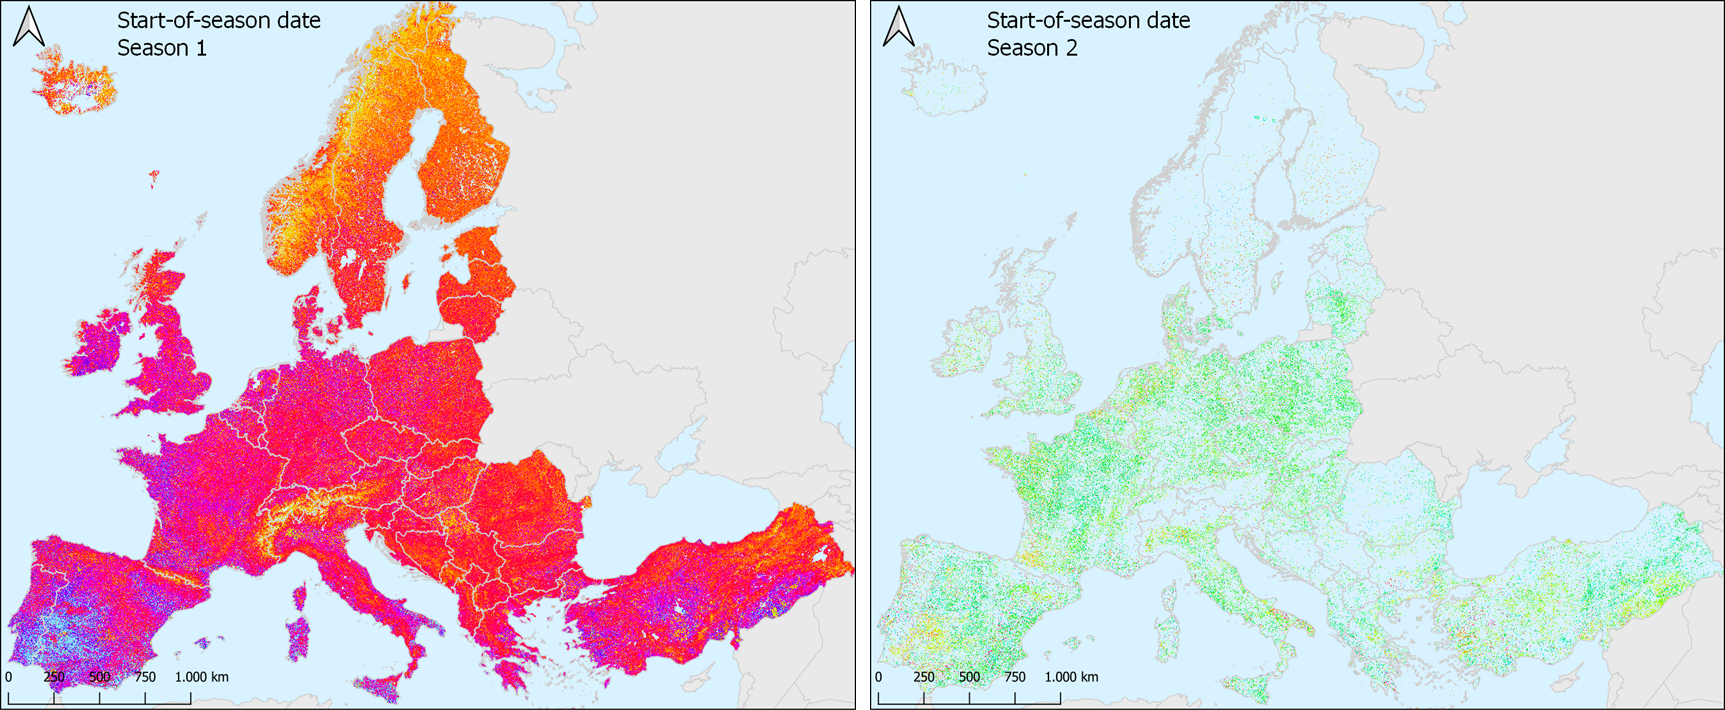
The Start-of-Season Date (SOSD), one of the Vegetation Phenology and Productivity (VPP) parameters, is a product of the pan-European High Resolution Vegetation Phenology and Productivity (HR-VPP) component of the Copernicus Land Monitoring Service (CLMS). The Start-of-Season Date (SOSD) marks the date when the vegetation growing season starts in the time profile of the Plant Phenology Index (PPI). The start-of-season occurs, by definition, when the PPI value reaches 25% of the season amplitude during the green-up period. The Plant Phenology Index (PPI) is a physically based vegetation index, developed for improving the monitoring of the vegetation growth cycle. The PPI index values, with 5-day satellite revisit cycle, are first used in a function fitting to derive the PPI Seasonal Trajectories, which is a filtered time series with regular 10-day time step. From these Seasonal Trajectories, a suite of 13 Vegetation Phenology and Productivity (VPP) parameters are then computed and provided, for up to two seasons each year. The Start-of-Season Date is one of the 13 parameters. The full list is available in the table 3 of the Product User Manual in the below link section. A complementary quality indicator (QFLAG) provides a confidence level, that is described in table 4 of the same manual. The SOSD dataset is made available as raster files with 10 x 10m and 100 x 100m resolutions, in ETRS89-LAEA projection corresponding to the HRL grid, for those tiles that cover the EEA38 countries and the United Kingdom and for two seasons in each year from 2017 onwards. It is updated in the first quarter of each year.
-

The Imperviousness Change (IMDC) 2018-2021 layer is part of the High Resolution Layer (HRL) Imperviousness. It contains the imperviousness change per pixel (increase or decrease in percentage) as derived from the difference between the Imperviousness Density (IMD) status layers for reference years 2018 and 2021, in an aggregated version of 20m spatial resolution. The production of the HRL Imperviousness is coordinated by EEA in the frame of Copernicus, the Earth observation component of the European Union’s Space programme. The product is a raster dataset with 20-meter grid spacing (spatial resolution) that covers the 38 Eionet member and cooperating countries as well as the United Kingdom (i.e. EEA38+UK). It is distributed as 100 x 100 km tiles that are fully conformant with the EEA reference grid.
-
The Copernicus High Resolution Forest Layer Tree Cover Change Mask (TCCM) 2012-2015 raster product provides information on the change between the reference years 2012 and 2015 and consists of 4 thematic classes (unchanged areas with no tree cover / new tree cover / loss of tree cover / unchanged areas with tree cover) at 20m spatial resolution and covers EEA38 area and the United Kingdom. The production of the High Resolution Forest layers was coordinated by the European Environment Agency (EEA) in the frame of the EU Copernicus programme. The High Resolution Forest product consists of three types of (status) products and additional change products. The status products are available for the 2012, 2015 and 2018 reference years: 1. Tree cover density providing level of tree cover density in a range from 0-100%; 2. Dominant leaf type providing information on the dominant leaf type: broadleaved or coniferous; 3. A Forest type product. The forest type product allows to get as close as possible to the FAO forest definition. In its original (20m) resolution it consists of two products: 1) a dominant leaf type product that has a MMU of 0.5 ha, as well as a 10% tree cover density threshold applied, and 2) a support layer that maps, based on the dominant leaf type product, trees under agricultural use and in urban context (derived from CLC and high resolution imperviousness 2009 data). For the final 100m product trees under agricultural use and urban context from the support layer are removed.
-
The high resolution forest product consists of three types of (status) products and additional change products. The status products are available for the 2012, 2015 and 2018 reference years: 1. Tree cover density providing level of tree cover density in a range from 0-100%; 2. Dominant leaf type providing information on the dominant leaf type: broadleaved or coniferous; 3. A Forest type product. The forest type product allows to get as close as possible to the FAO forest definition. In its original (20m) resolution it consists of two products: 1) a dominant leaf type product that has a MMU of 0.5 ha, as well as a 10% tree cover density threshold applied, and 2) a support layer that maps, based on the dominant leaf type product, trees under agricultural use and in urban context (derived from CLC and high resolution imperviousness 2009 data). For the final 100m product trees under agricultural use and urban context from the support layer are removed. The high resolution forest change products comprise a simple tree cover density change product for 2012-2015 (% increase or decrease of real tree cover density changes). The production of the high resolution forest layers was coordinated by the European Environment Agency (EEA) in the frame of the EU Copernicus programme.
-
The high resolution imperviousness products capture the percentage and change of soil sealing. Built-up areas are characterized by the substitution of the original (semi-) natural land cover or water surface with an artificial, often impervious cover. These artificial surfaces are usually maintained over long periods of time. A series of high resolution imperviousness datasets (for the 2006, 2009, 2012 and 2015 reference years) with all artificially sealed areas was produced using automatic derivation based on calibrated Normalized Difference Vegetation Index (NDVI). This series of imperviousness layers constitutes the main status layers. They are per-pixel estimates of impermeable cover of soil (soil sealing) and are mapped as the degree of imperviousness (0-100%). Imperviousness change layers were produced as a difference between the reference years (2006-2009, 2009-2012, 2012-2015 and additionally 2006-2012, to fully match the CORINE Land Cover production cycle) and are presented 1) as degree of imperviousness change (-100% -- +100%), in 20m and 100m pixel size, and 2) a classified (categorical) 20m change product.
-

Corine Land Cover Change 2012-2018 (CHA1218) is one of the Corine Land Cover (CLC) datasets produced within the frame the Copernicus Land Monitoring Service referring to changes in land cover / land use status between the years 2012 and 2018. CLC service has a long-time heritage (formerly known as "CORINE Land Cover Programme"), coordinated by the European Environment Agency (EEA). It provides consistent and thematically detailed information on land cover and land cover changes across Europe. CLC datasets are based on the classification of satellite images produced by the national teams of the participating countries - the EEA members and cooperating countries (EEA39). National CLC inventories are then further integrated into a seamless land cover map of Europe. The resulting European database relies on standard methodology and nomenclature with following base parameters: 44 classes in the hierarchical 3-level CLC nomenclature; minimum mapping unit (MMU) for status layers is 25 hectares; minimum width of linear elements is 100 metres. Change layers have higher resolution, i.e. minimum mapping unit (MMU) is 5 hectares for Land Cover Changes (CHA), and the minimum width of linear elements is 100 metres. The CLC service delivers important data sets supporting the implementation of key priority areas of the Environment Action Programmes of the European Union as e.g. protecting ecosystems, halting the loss of biological diversity, tracking the impacts of climate change, monitoring urban land take, assessing developments in agriculture or dealing with water resources directives. part of the European Copernicus Programme coordinated by the European Environment Agency, providing environmental information from a combination of air- and space-based observation systems and in-situ monitoring.