 Arctic SDI catalogue
250 m
Type of resources
Available actions
Topics
Keywords
Contact for the resource
Provided by
Formats
Representation types
Update frequencies
status
Resolution
-

This data publication contains two collections of raster maps of forest attributes across Canada, the first collection for year 2001, and the second for year 2011. The 2001 collection is actually an improved version of an earlier set of maps produced also for year 2001 (Beaudoin et al 2014, DOI: https://doi.org/10.1139/cjfr-2013-0401) that is itself available through the web site “http://nfi-nfis.org”. Each collection contains 93 maps of forest attributes: four land cover classes, 11 continuous stand-level structure variables such as age, volume, biomass and height, and 78 continuous values of percent composition for tree species or genus. The mapping was done at a spatial resolution of 250m along the MODIS grid. Briefly the method uses forest polygon information from the first version of photoplots database from Canada’s National Forest Inventory as reference data, and the non-parametric k-nearest neighbors procedure (kNN) to create the raster maps of forest attributes. The approach uses a set of 20 predictive variables that include MODIS spectral reflectance data, as well as topographic and climate data. Estimates are carried out on target pixels across all Canada treed landmass that are stratified as either forest or non-forest with 25% forest cover used as a threshold. Forest cover information was extracted from the global forest cover product of Hansen et al (2013) (DOI: https://doi.org/10.1126/science.1244693). The mapping methodology and resultant datasets were intended to address the discontinuities across provincial borders created by their large differences in forest inventory standards. Analysis of residuals has failed to reveal residual discontinuities across provincial boundaries in the current raster dataset, meaning that our goal of providing discontinuity-free maps has been reached. The dataset was developed specifically to address strategic issues related to phenomena that span multiple provinces such as fire risk, insect spread and drought. In addition, the use of the kNN approach results in the maintenance of a realistic covariance structure among the different variable maps, an important property when the data are extracted to be used in models of ecosystem processes. For example, within each pixel, the composition values of all tree species add to 100%. * Details on the product development and validation can be found in the following publication: Beaudoin, A., Bernier, P.Y., Villemaire, P., Guindon, L., Guo, X.-J. 2017. Tracking forest attributes across Canada between 2001 and 2011 using a kNN mapping approach applied to MODIS imagery, Canadian Journal of Forest Research 48: 85–93. DOI: https://doi.org/10.1139/cjfr-2017-0184 * Please cite this dataset as: Beaudoin A, Bernier PY, Villemaire P, Guindon L, Guo XJ. 2017. Species composition, forest properties and land cover types across Canada’s forests at 250m resolution for 2001 and 2011. Natural Resources Canada, Canadian Forest Service, Laurentian Forestry Centre, Quebec, Canada. https://doi.org/10.23687/ec9e2659-1c29-4ddb-87a2-6aced147a990 * This dataset contains these NFI forest attributes: ## LAND COVER : landbase vegetated, landbase non-vegetated, landcover treed, landcover non-treed ## TREE STRUCTURE : total above ground biomass, tree branches biomass, tree foliage biomass, stem bark biomass, stem wood biomass, total dead trees biomass, stand age, crown closure, tree stand heigth, merchantable volume, total volume ## TREE SPECIES : abies amabilis (amabilis fir), abies balsamea (balsam fir), abies lasiocarpa (subalpine fir), abies spp. (unidentified fir), acer macrophyllum (bigleaf maple), acer negundo (manitoba maple, box-elder), acer pensylvanicum (striped maple), acer rubrum (red maple), acer saccharinum (silver maple), acer saccharum (sugar maple), acer spicatum (mountain maple), acer spp. (unidentified maple), alnus rubra (red alder), alnus spp. (unidentified alder), arbutus menziesii (arbutus), betula alleghaniensis (yellow birch), betula papyrifera (white birch), betula populifolia (gray birch), betula spp. (unidentified birch), carpinus caroliniana (blue-beech), carya cordiformis (bitternut hickory), chamaecyparis nootkatensis (yellow-cedar), fagus grandifolia (american beech), fraxinus americana (white ash), fraxinus nigra (black ash), fraxinus pennsylvanica (red ash), juglans cinerea (butternut), juglans nigra (black walnut), juniperus virginiana (eastern redcedar), larix laricina (tamarack), larix lyallii (subalpine larch), larix occidentalis (western larch), larix spp. (unidentified larch), malus spp. (unidentified apple), ostrya virginiana (ironwood, hop-hornbeam), picea abies (norway spruce), picea engelmannii (engelmann spruce), picea glauca (white spruce), picea mariana (black spruce), picea rubens (red spruce), picea sitchensis (sitka spruce), picea spp. (unidentified spruce), pinus albicaulis (whitebark pine), pinus banksiana (jack pine), pinus contorta (lodgepole pine), pinus monticola (western white pine), pinus ponderosa (ponderosa pine), pinus resinosa (red pine), pinus spp. (unidentified pine), pinus strobus (eastern white pine), pinus sylvestris (scots pine), populus balsamifera (balsam poplar), populus grandidentata (largetooth aspen), populus spp. (unidentified poplar), populus tremuloides (trembling aspen), populus trichocarpa (black cottonwood), prunus pensylvanica (pin cherry), prunus serotina (black cherry), pseudotsuga menziesii (douglas-fir), quercus alba (white oak), quercus macrocarpa (bur oak), quercus rubra (red oak), quercus spp. (unidentified oak), salix spp. (unidentified willow), sorbus americana (american mountain-ash), thuja occidentalis (eastern white-cedar), thuja plicata (western redcedar), tilia americana (basswood), tsuga canadensis (eastern hemlock), tsuga heterophylla (western hemlock), tsuga mertensiana (mountain hemlock), tsuga spp. (unidentified hemlock), ulmus americana (white elm), unidentified needleaf, unidentified broadleaf, broadleaf species, needleaf species, unknown species
-
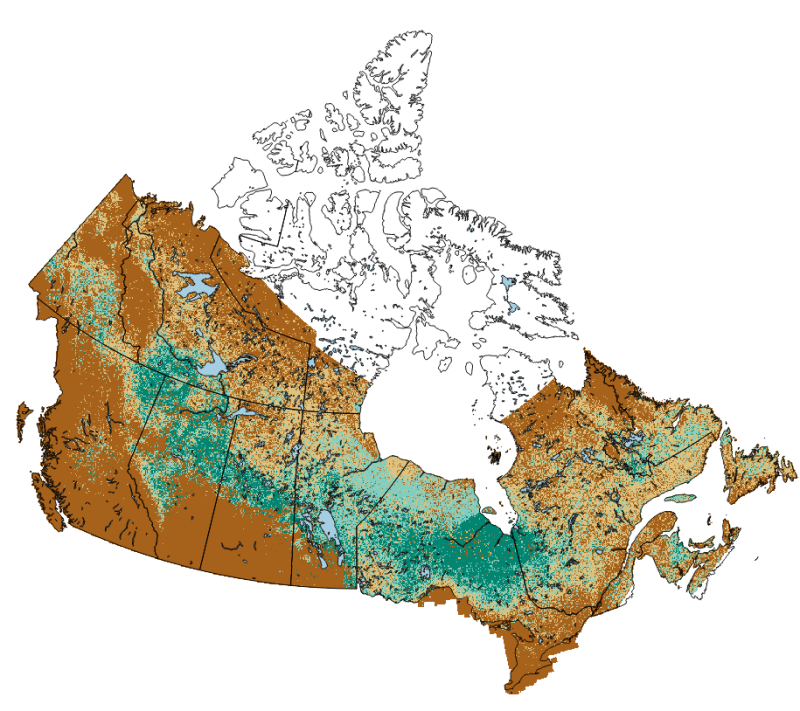
Organic soils in the boreal forest commonly store as much carbon as the vegetation above ground. While recent efforts through the National Forest Inventory has yielded new spatial datasets of forest structure across the vast area of Canada’s boreal forest, organic soils are poorly mapped. In this geospatial dataset, we produce a map primarily of forested and treed peatlands, those with more than 40 cm of peat accumulation and over 10% tree canopy cover. National Forest Inventory ground plots were used to identify the range of forest structure that corresponds to the presence of over 40 cm of peat soils. Areas containing that range of forest cover were identified using the National Forest Inventory k-NN forest structure maps and assigned a probability (0-100% as integer) of being a forested or treed peatland according to a statistical model. While this mapping product captures the distribution of forested and treed peatlands at a 250 m resolution, open, completely treeless peatlands are not fully captured by this mapping product as forest cover information was used to create the maps. The methodology used in the creation of this product is described in: Thompson DK, Simpson BN, Beaudoin A. 2016. Using forest structure to predict the distribution of treed boreal peatlands in Canada. Forest Ecology and Management, 372, 19-27. https://cfs.nrcan.gc.ca/publications?id=36751 This distribution uses an updated forest attribute layer current to 2011 from: Beaudoin A, Bernier PY, Villemaire P, Guindon L, Guo XJ. 2017. Species composition, forest properties and land cover types across Canada’s forests at 250m resolution for 2001 and 2011. Natural Resources Canada, Canadian Forest Service, Laurentian Forestry Centre, Quebec, Canada. https://doi.org/10.23687/ec9e2659-1c29-4ddb-87a2-6aced147a990 Additionally, this distribution varies slightly from the original published in 2016 in that here slope data is derived from the CDEM: https://open.canada.ca/data/en/dataset/7f245e4d-76c2-4caa-951a-45d1d2051333 The above peatland probability map was further processed to delineate bogs vs fens (based on mapped Larix content via the k-NN maps), as well as an approximation of the extent of open peatlands using EOSD data. The result is a 9-type peatland map with a more complete methodology as detailed in: Webster, K. L., Bhatti, J. S., Thompson, D. K., Nelson, S. A., Shaw, C. H., Bona, K. A., Hayne, S. L., & Kurz, W. A. (2018). Spatially-integrated estimates of net ecosystem exchange and methane fluxes from Canadian peatlands. Carbon Balance and Management, 13(1), 16. https://doi.org/10.1186/s13021-018-0105-5 In plain text, the legend for the 9-class map is as follows: value="0" label="not peat" alpha="0" value="1" label="Open Bog" alpha="255" color="#0a4b32" value="2" label="Open Poor Fen" alpha="255" color="#5c5430" value="3" label="Open Rich Fen" alpha="255" color="#792652" value="4" label="Treed Bog" alpha="255" color="#6a917b" value="5" label="Treed Poor Fen" alpha="255" color="#aba476" value="6" label="Treed Rich Fen" alpha="255" color="#af7a8f" value="7" label="Forested Bog" alpha="255" color="#aad7bf" value="8" label="Forested Poor Fen" alpha="255" color="#fbfabc" value="9" label="Forested Rich Fen" alpha="255" color="#ffb6db" This colour scale is given in qml/xml format in the resources below. The 9-type peatland map from Webster et al 2018 was further refined slightly following two simple conditions: (1) any 250-m raster cell with greater than 40% pine content is classified as upland (non-peat); (2) all 250-m raster cells classified as water or agriculture via the NRCan North American Land Cover Monitoring System (https://doi.org/10.3390/rs9111098) is also classified as non-peatland (value of zero in the 9-class map. This mapping scheme was used at a regional scale in the following paper: Thompson, D. K., Simpson, B. N., Whitman, E., Barber, Q. E., & Parisien, M.-A. (2019). Peatland Hydrological Dynamics as A Driver of Landscape Connectivity and Fire Activity in the Boreal Plain of Canada. Forests, 10(7), 534. https://doi.org/10.3390/f10070534 And is reproduced here at a national scale. Note that this mapping product does not fully capture all permafrost peatland features covered by open canopy spruce woodland with lichen ground cover. Nor are treeless peatlands near the northern treeline captured in the training data, resulting in unknown mapping quality in those regions.
-

This publication contains a raster maps at 250 m resolution of the merchantable volume (m3/ha) of the mature Canadian forest available for harvesting in the next 20 years (2011 to 2031). The maps were produced from remote sensing products at a spatial resolution of 250 m on the MODIS pixel grid and 30 m on the Landsat pixel grid. More specifically, we used forest attribute data at the 250 m pixel for the years 2001 and 2011 (Beaudoin et al 2014 and 2018) combined with forest cover changes for the years 1985 to 2015 at 30 m (Guindon et al. 2017 and 2018). The map of mature forests in Canada was prepared at the forest management unit (FMU) level and therefore exclude private lands. To be considered mature (i.e. available for cutting in the next 20 years), the forest pixels of Beaudoin et al. (2018) was to have a merchantable volume per ha equal to or greater than 80% of the average merchantable volume of the pixels that were harvested between 2001 and 2011 per forest management unit. A scientific article gives additional details on the methodology: Barrette J, Paré D, Manka F, Guindon L, Bernier P, Titus B. 2018. Forecasting the spatial distribution of logging residues in Canada’s managed forests. Can. J. For. Res. 48: http://www.nrcresearchpress.com/doi/10.1139/cjfr-2018-0080 Reference for this dataset: Barrette J, Paré D, Manka F, Guindon L, Bernier P, Titus B. 2018. Forecasting the spatial distribution of logging residues in Canada’s managed forests. Natural Resources Canada, Canadian Forest Service, Laurentian Forestry Centre, Quebec, Canada. https://doi.org/10.23687/dd94871a-9a20-47f5-825b-768518140f35