 Arctic SDI catalogue
Wetlands
Type of resources
Available actions
Topics
Keywords
Contact for the resource
Provided by
Formats
Representation types
Update frequencies
status
Resolution
-
The Great Lakes Coastal Wetland Monitoring Program (GLCWMP) involves the monitoring of Great Lakes coastal wetland biota and habitat to provide information on coastal wetland condition for use in conservation and management decision-making using fish, birds, anurans, vegetation, aquatic macroinvertebrates and water quality. The main outputs from this program are a thorough assessment of the condition of over 1000 Great Lakes coastal wetlands (that are larger than four hectares in size and have a surface water connection to the lake) and the implementation of a standardized long-term monitoring program for coastal wetlands across the Great Lakes basin. This program is funded under the Great Lakes Restoration Initiative by the U.S. Environmental Protection Agency, Great Lakes National Program Office (GLNPO). The Canadian Wildlife Service (CWS) of Environment and Climate Change Canada has been involved in the program since it began in 2011, and over that time has conducted fish, vegetation, aquatic macroinvertebrates and water quality surveys at 80 coastal wetland sites (as of 2025) primarily on the Canadian shore of Lake Ontario. Program data are available by request at: www.greatlakeswetlands.org. The data included here are a list of the 80 sites surveyed by CWS, spatial coordinates for each site, and the years that sites were surveyed.
-

The third generation of high resolution 10-m wetland inventory map of Canada, covering an approximate area of one billion hectares, was generated using multi-year (2016-2020), multi-source imagery (Sentinel-1, Sentinel-2, ALOS PALSAR-2, and SRTM) Earth Observation (EO) data as well as environmental features. Over 8800 wetland polygons were processed within an object-based random forest classification scheme on the Google Earth Engine cloud computing platform. The average overall accuracy of 90.5% is an increase of 4.7% over CWIM2. CWIM Versions: The Canadian Wetland Inventory Map (CWIM) is an extension of work started at Memorial University to produce a Newfoundland and Labrador wetland inventory during 2015-2018 which was significantly funded by Environment and Climate Change Canada. The first national CWIM was produced 2018-2019 as a collaboration between Memorial University, C-CORE, and Natural Resources Canada. Dr. Brian Brisco was instrumental in connecting ground truth from multiple sources to the project and providing guidance. Version 2 was produced in 2020 which included more training data and processing by Canada’s ecozones rather than provinces to take advantage of the commonality of landscape ecological features within ecozones to improve the accuracy. Version 3 produced in 2021 continued adding more data sources to further improve accuracy specifically an overestimation of wetland area as well as introducing a confidence map. Version 3A completed in 2022 updates only the arctic ecozones due to their relatively lower accuracy and added hydro-physiographic data layers. Currently work is underway to create a northern circumpolar wetland inventory map to be published in 2025. Paper on Newfoundland and Labrador Wetland Inventory: Mahdianpari, M.; Salehi, B.; Mohammadimanesh, F.; Homayouni, S.; Gill, E. The First Wetland Inventory Map of Newfoundland at a Spatial Resolution of 10 m Using Sentinel-1 and Sentinel-2 Data on the Google Earth Engine Cloud Computing Platform. Remote Sens. 2019, 11, 43. https://doi.org/10.3390/rs11010043 Paper on CWIM1: Mahdianpari, M., Salehi, B., Mohammadimanesh, F., Brisco, B., Homayouni, S., Gill, E., … Bourgeau-Chavez, L. (2020). Big Data for a Big Country: The First Generation of Canadian Wetland Inventory Map at a Spatial Resolution of 10-m Using Sentinel-1 and Sentinel-2 Data on the Google Earth Engine Cloud Computing Platform. Canadian Journal of Remote Sensing, 46(1), 15–33. https://doi.org/10.1080/07038992.2019.1711366 Paper on CWIM2: Mahdianpari, M., Brisco, B., Granger, J. E., Mohammadimanesh, F., Salehi, B., Banks, S., … Weng, Q. (2020). The Second Generation Canadian Wetland Inventory Map at 10 Meters Resolution Using Google Earth Engine. Canadian Journal of Remote Sensing, 46(3), 360–375. https://doi.org/10.1080/07038992.2020.1802584 Paper on CWIM3: M. Mahdianpari et al., "The Third Generation of Pan-Canadian Wetland Map at 10 m Resolution Using Multisource Earth Observation Data on Cloud Computing Platform," in IEEE Journal of Selected Topics in Applied Earth Observations and Remote Sensing, vol. 14, pp. 8789-8803, 2021, doi: 10.1109/JSTARS.2021.3105645. Paper on Arctic ecoregion enhancement for CWIM3A: Michael Merchant, et al., ”Leveraging google earth engine cloud computing for large-scale arctic wetland mapping,” in International Journal of Applied Earth Observation and Geoinformation, vol. 125, 2023, https://doi.org/10.1016/j.jag.2023.103589.
-
Location of the illustrated wetlands, as illustrated in the “Map 2-15: Natural Environments” of the revised land use and development plan of the City of Laval.**This third party metadata element was translated using an automated translation tool (Amazon Translate).**
-

The “Soil Landscapes of Canada (SLC) Version 3.2” dataset series provides a set of geo-referenced soil areas (polygons) that are linked to attribute data found in the associated Component Table (CMP), Component Rating Table (CRT), Soil Names Table (SNT), Soil Layer Table (SLT), Landscape Segmentation Table (LST), Landform Extent Table (LET), Landform Definition Table and Ecological Framework Table (EFT). Together, these datasets describe the spatial distribution of soils and associated landscapes for the agricultural areas of Canada. However, some provinces (Alberta, Nova Scotia, and Prince Edward Island) contain CMP, SNT and SLT data for the entire province (that is, beyond the agricultural areas). This version is complemented by the previous SLC version 2.2, which covers the entire country.
-

The Canadian National Wetlands Inventory (CNWI) is a comprehensive, publicly available national geodatabase developed by the Canadian Wildlife Service (CWS) of Environment and Climate Change Canada (ECCC), in collaboration with federal, provincial, and territorial governments, academia, Indigenous groups, and Non-Governmental Organizations (NGOs). It consists of the best available wetland mapping data, along with its metadata, published in a standardized manner. The CNWI is continuously updated through the compilation of existing data and the acquisition of new high-resolution datasets to address coverage gaps, with an emphasis on peatlands and coastal wetlands, which are key habitats for greenhouse gas (GHG) sequestration. ECCC plans to use the CNWI to train and validate machine-learning algorithms to delineate and classify wetlands at a national scale and to measure trends over time. This will directly support Canada’s Nature-Based Climate Solutions by informing biodiversity conservation, guiding climate change mitigation and adaptation strategies, and supporting GHG emissions reporting. The CNWI was initially released in February 2024 with 13 source datasets. In June 2025, the Inventory was updated to include 14 additional datasets. Collectively, these 27 source datasets comprise approximately 12.1 million wetland polygon features, covering a total area of roughly 640,000 square kilometers across ten provinces and territories (BC, MB, NB, NL, NS, PE, ON, QC, SK, YT). These source datasets were cross-walked into a standardized CNWI classification schema, which is based on two foundational documents: the Canadian Wetland Classification System (National Wetlands Working Group, 1997) and the Canadian Wetland Inventory Data Model (2016). The CNWI Schema contains five major wetland classes (Bog, Fen, Swamp, Marsh, and Shallow/Open Water) and eight subclasses (Rich Fen, Poor Fen, Organic Swamp, Mineral Swamp, Organic Marsh, Mineral Marsh, Shallow Water, and Open Water). Non-conforming wetlands can be categorized into three groups: Peatland, Mixed, and Unclassified. For more information on the CNWI and the related database, please refer to the CNWI User Manual and other supporting documents that accompany this publication. The User Manual provides detailed information on how data are collected, managed, and distributed to meet CNWI data standards.
-

Marsh inventory in the Chaleur Bay, the Estuary and the Gulf of St. Lawrence according to a literature review of documents produced between 1985 and 2002. Additional Information The marsh inventory was produced according to a literature review of the following documents: Bolduc, F. et P. Kaltenback. 1995. Caractérisation de l'habitat du poisson du banc de Portneuf et avenues de mise en valeur. Rapport présenté par Pro Faune à la Corporation de développement touristique de Rivière-Portneuf. 13 pages et annexes. Comité ZIP Baie des Chaleurs, 2002. Données numériques acquises suite à la cartographie de milieux humides Baie des Chaleurs pour le comité ZIP (printemps 2002). Comité ZIP Côte-Nord du Golfe. 2001. Inventaire du potentiel côtier et marin de la Basse-Côte-Nord. Version préliminaire de rapport sous forme de CD-ROM, Sept-Îles, mars 2001. Kedney, G. et P. Kaltenback. 1996. Acquisition de connaissances et mise en valeur des habitats du banc de Portneuf. Document réalisé par la firme Pro Faune pour le Comité touristique de Rivière-Portneuf. 50 pages et 5 annexes. Labrecque, J., G. Lavoie et F. Boudreau. 1995. Les plantes susceptibles d'être désignées menacées ou vulnérables du barachois de la rivière Malbaie, Barachois-Ouest, Gaspésie. Gouvernement du Québec, ministère de l'Environnement et de la Faune, Direction de la conservation et du patrimoine écologique, Québec. 20 p. Lemieux, C. 1995. Acquisition de connaissances des habitats côtiers dans la région de Rimouski (1995). Rapport du Groupe-Conseil GENIVAR présenté au Ministère des Pêches et des Océans du Canada, Division de la Gestion de l’Habitat du Poisson, 52 pages + 2 annexes. Lemieux, C. 2001. Projet de projection et de mise en valeur de la baie au Chêne et d'habitats côtiers de la région de Pointe-à-la-Croix (Gaspésie). Rapport du Groupe conseil Génivar inc. Présenté au Comité ZIP Baie des Chaleurs et au ministère de l'Environnement du Québec, direction du patrimoine écologique et du développement durable. 76 p. + 8 annexes. Lemieux, C. et R. Lalumière. 1995. Acquisition de connaissances des habitats côtiers du barachois de Saint-Omer. Rap. du Groupe conseil Genivar inc. pour la DGHP, MPO, 44 pages + 3 ann. Les consultants en environnement Argus inc. 1995a. Caractérisation physico-chimique et biologique de l'habitat du poisson du barachois de Malbaie: automne 1994. Rapport présenté au Club des ornithologues de la Gaspésie dans le cadre du programme Saint-Laurent Vision 2000. 62 p. + ann. Les consultants en environnement Argus inc. 1995b. Barachois de Malbaie: étude d'avant-projet de conservation et de mise en valeur. Rapport présenté au Club des ornithologues de la Gaspésie dans le cadre du programme Saint-Laurent Vision 2000. 71 p. + ann. Les consultants en environnement Argus inc. 1995c. Étude biophysique complémentaire de conservation et mise en valeur de la baie des Capucins. Rapport présenté à la corporation de développement de Les Capucins. 48 p. + ann. Les consultants en environnement Argus inc. 1998. Perspectives d'aménagement et de restauration des marais à spartine du Québec. Rapport final. En collaboration avec le Service canadien de la Faune (Environnement Canada), Pêches et Océans Canada, le Ministère des Transports du Québec et Canards Illimités inc. 123 pages + annexes et index cartographique. Létourneau, G. et M. Jean. 1996. Cartographie des marais, marécages et herbiers aquatiques le long du Saint-Laurent par télédétection aéroportée. Environnement Canada – Région du Québec, Conservation de l’environnement, Centre Saint-Laurent, Montréal. 101 pages Létourneau, Guy. 1991. Milieux humides, Base de données Létourneau 1991 (de Cornwall à Trois-Pistoles et les Îles-de-la-Madeleine. Logimer. 1985. Développement d'un programme de conservation et de reconstitution des habitats lagunaires gaspésiens. Rapport présenté à Pêches et Océans Canada, section Habitat du poisson. 306 p. et annexes. Procéan inc. 1996. Caractérisation du milieu physique et inventaire biologique du barachois de New Richmond : rapport final. Présenté à la Division de la gestion de l'habitat du poisson, Pêches et Océans Canada par Procéan inc. Vaillancourt, M.-A. et C. Lafontaine. 1999. Caractérisation de la Baie Mitis. Jardins de Métis et Pêches et Océans Canada. Grand-Métis. 185 p.
-

The Coastal Environmental Baseline Program is a multi-year Fisheries and Oceans Canada initiative designed to work with Indigenous and local communities and other key parties to collect coastal environmental data at six pilot sites across Canada (Port of Vancouver, Port of Prince Rupert, Lower St. Lawrence Estuary, Port of Saint John, Placentia Bay, and Iqaluit). The goal of the Program is to gather local information in these areas in effort to build a better understanding of marine ecological conditions. The Maritimes region has developed a physical oceanography program to align with the oceanographic interests and data needs of local communities and stakeholders, with the goal of sharing this information via open data. Starting in 2019, oceanographic parameters including temperature, salinity, depth, turbidity and currents have been continuously monitored at a series of locations covering a broad range of environments in the Port of Saint John and approaches vicinity, including the lower Saint John and Kennebecasis rivers, coastal fringe marshes and embayments, as well as the Musquash estuary Marine Protected Area (MPA). This dataset includes CTD data starting in 2019 and turbidity data from August 2020. Data collection methods range from bottom-mounted instruments in water depths of 10-50 meters, buoyant surface moorings, and hard-mounted instruments in intertidal zones. Intertidal data is interrupted during some low tide events, where the water level drops below the sensor, resulting in loss of functionality for periods up to 1-2 hours. Overall this dataset captures a dynamic balance between salt and fresh water on the highly tidal lower Saint John river, coastal seasonal dynamics in near-shore marine environments in the Musquash MPA, and the constant fluctuations of intertidal creeks and marshes. Update 2 - April 2025: included 2023-24 data Update 1 - Nov 2023: included 2022 data; removed daylight savings errors from 2019, 2020 and 2021; updated position for Evandale surface mooring.
-
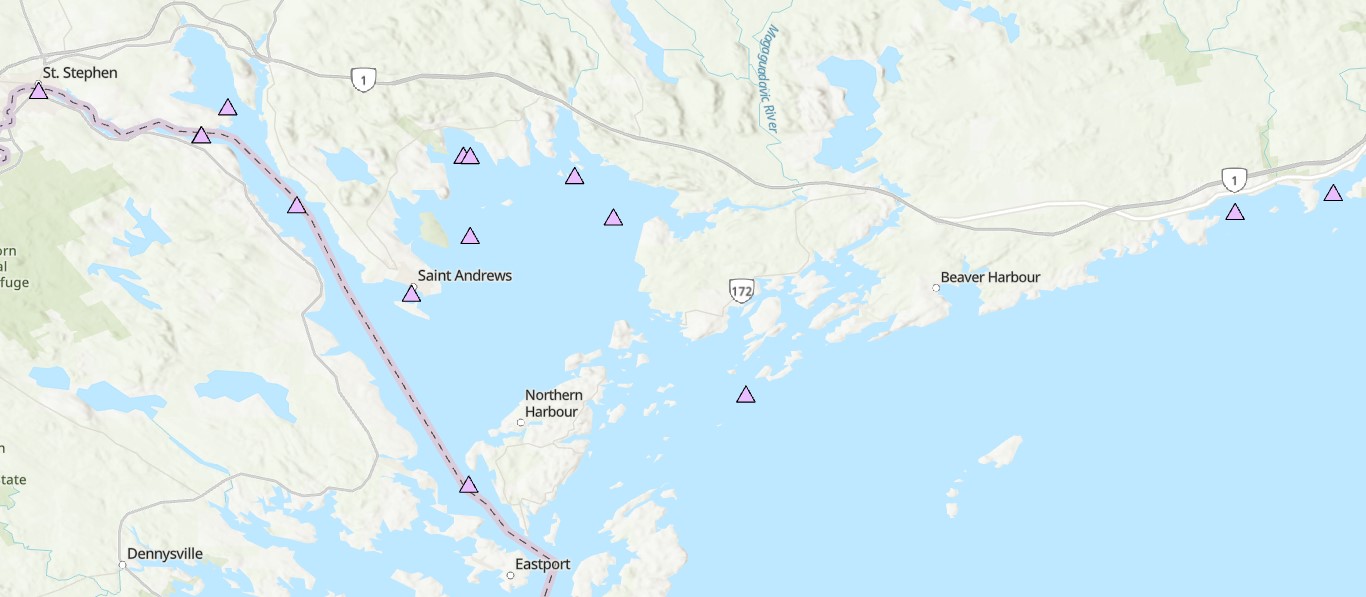
The Coastal Environmental Baseline Program is a multi-year Fisheries and Oceans Canada initiative designed to work with Indigenous and local communities and other key parties to collect coastal environmental data at a series of sites across Canada, to build a better understanding of existing marine ecological conditions. The program began data collection in 2019, and with the onset of Phase 2 in 2023, the Maritimes region study area was expanded and renamed ‘Northwest Fundy Shores’. A physical oceanography program was designed to align with the oceanographic interests and data needs of local interest holders. Starting in 2023, oceanographic parameters including water temperature, salinity, depth and turbidity have been monitored at a series of locations in Passamaquoddy Bay, the St. Croix River, and along the Bay of Fundy coast, including the Musquash estuary Marine Protected Area (MPA). This dataset includes seasonal CTD (conductivity, temperature and depth) and turbidity data starting in spring 2023. Instruments are maintained through the winter months at a limited number of sites. Data collection methods are primarily moored instruments on the bottom in water depths of 5-90 meters, and a few buoyant surface floats. Overall, this dataset captures seasonal dynamics in near-shore marine environments in Passamaquoddy Bay, the St Croix River, the Bay of Fundy and the Musquash MPA. Cite this data as: Coastal Environmental Baseline Program (Maritimes Region), Northwest Fundy Shores conductivity, temperature and depth data. Published in May 2025. Coastal Environmental Baseline Program. Coastal Ecosystems Science Division, Fisheries and Oceans Canada, St. Andrews, N.B. 14-02-2025
-
The Coastal Environmental Baseline Program is a multi-year Fisheries and Oceans Canada initiative designed to work with Indigenous and local communities and other key parties to collect coastal environmental data at six pilot sites across Canada (Port of Vancouver, Port of Prince Rupert, Lower St. Lawrence Estuary, Port of Saint John, Placentia Bay, and Iqaluit). The goal of the Program is to gather local information in these areas in effort to build a better understanding of marine ecological conditions. The Maritimes region has developed a habitat classification program to align with the oceanographic interests and data needs of local communities and stakeholders, with the goal of sharing this information via open data. In 2020, a habitat survey in the lower Musquash Marine Protected Area (MPA) was undertaken to further develop this project, using an Autonomous Underwater Vehicle (AUV) equipped with high-frequency (450 kHz) side scan sonar to build a habitat map of the MPA. This dataset includes mosaicked series of sonar images (raw & position-corrected versions), covering roughly 6 km2 of marine and intertidal areas in the Musquash MPA. Doppler Velocity logs and mission-specific files for each survey are also included, along with detailed methodological documentation. These data were generated from 17 separate survey missions that were completed in August, September and October 2020.
-
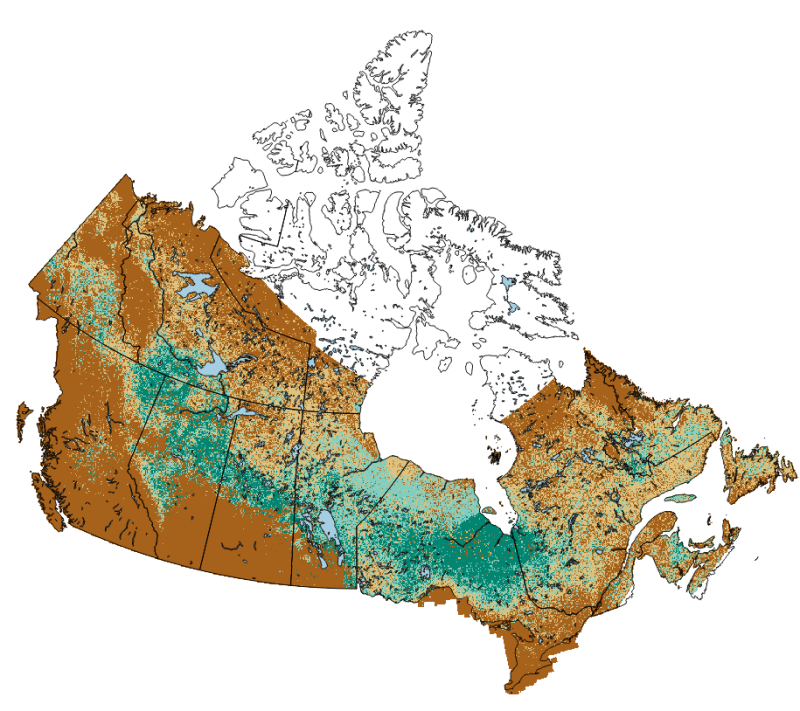
Organic soils in the boreal forest commonly store as much carbon as the vegetation above ground. While recent efforts through the National Forest Inventory has yielded new spatial datasets of forest structure across the vast area of Canada’s boreal forest, organic soils are poorly mapped. In this geospatial dataset, we produce a map primarily of forested and treed peatlands, those with more than 40 cm of peat accumulation and over 10% tree canopy cover. National Forest Inventory ground plots were used to identify the range of forest structure that corresponds to the presence of over 40 cm of peat soils. Areas containing that range of forest cover were identified using the National Forest Inventory k-NN forest structure maps and assigned a probability (0-100% as integer) of being a forested or treed peatland according to a statistical model. While this mapping product captures the distribution of forested and treed peatlands at a 250 m resolution, open, completely treeless peatlands are not fully captured by this mapping product as forest cover information was used to create the maps. The methodology used in the creation of this product is described in: Thompson DK, Simpson BN, Beaudoin A. 2016. Using forest structure to predict the distribution of treed boreal peatlands in Canada. Forest Ecology and Management, 372, 19-27. https://cfs.nrcan.gc.ca/publications?id=36751 This distribution uses an updated forest attribute layer current to 2011 from: Beaudoin A, Bernier PY, Villemaire P, Guindon L, Guo XJ. 2017. Species composition, forest properties and land cover types across Canada’s forests at 250m resolution for 2001 and 2011. Natural Resources Canada, Canadian Forest Service, Laurentian Forestry Centre, Quebec, Canada. https://doi.org/10.23687/ec9e2659-1c29-4ddb-87a2-6aced147a990 Additionally, this distribution varies slightly from the original published in 2016 in that here slope data is derived from the CDEM: https://open.canada.ca/data/en/dataset/7f245e4d-76c2-4caa-951a-45d1d2051333 The above peatland probability map was further processed to delineate bogs vs fens (based on mapped Larix content via the k-NN maps), as well as an approximation of the extent of open peatlands using EOSD data. The result is a 9-type peatland map with a more complete methodology as detailed in: Webster, K. L., Bhatti, J. S., Thompson, D. K., Nelson, S. A., Shaw, C. H., Bona, K. A., Hayne, S. L., & Kurz, W. A. (2018). Spatially-integrated estimates of net ecosystem exchange and methane fluxes from Canadian peatlands. Carbon Balance and Management, 13(1), 16. https://doi.org/10.1186/s13021-018-0105-5 In plain text, the legend for the 9-class map is as follows: value="0" label="not peat" alpha="0" value="1" label="Open Bog" alpha="255" color="#0a4b32" value="2" label="Open Poor Fen" alpha="255" color="#5c5430" value="3" label="Open Rich Fen" alpha="255" color="#792652" value="4" label="Treed Bog" alpha="255" color="#6a917b" value="5" label="Treed Poor Fen" alpha="255" color="#aba476" value="6" label="Treed Rich Fen" alpha="255" color="#af7a8f" value="7" label="Forested Bog" alpha="255" color="#aad7bf" value="8" label="Forested Poor Fen" alpha="255" color="#fbfabc" value="9" label="Forested Rich Fen" alpha="255" color="#ffb6db" This colour scale is given in qml/xml format in the resources below. The 9-type peatland map from Webster et al 2018 was further refined slightly following two simple conditions: (1) any 250-m raster cell with greater than 40% pine content is classified as upland (non-peat); (2) all 250-m raster cells classified as water or agriculture via the NRCan North American Land Cover Monitoring System (https://doi.org/10.3390/rs9111098) is also classified as non-peatland (value of zero in the 9-class map. This mapping scheme was used at a regional scale in the following paper: Thompson, D. K., Simpson, B. N., Whitman, E., Barber, Q. E., & Parisien, M.-A. (2019). Peatland Hydrological Dynamics as A Driver of Landscape Connectivity and Fire Activity in the Boreal Plain of Canada. Forests, 10(7), 534. https://doi.org/10.3390/f10070534 And is reproduced here at a national scale. Note that this mapping product does not fully capture all permafrost peatland features covered by open canopy spruce woodland with lichen ground cover. Nor are treeless peatlands near the northern treeline captured in the training data, resulting in unknown mapping quality in those regions.