Marine Mammal
Type of resources
Available actions
Topics
Keywords
Contact for the resource
Provided by
Formats
Representation types
Update frequencies
status
-
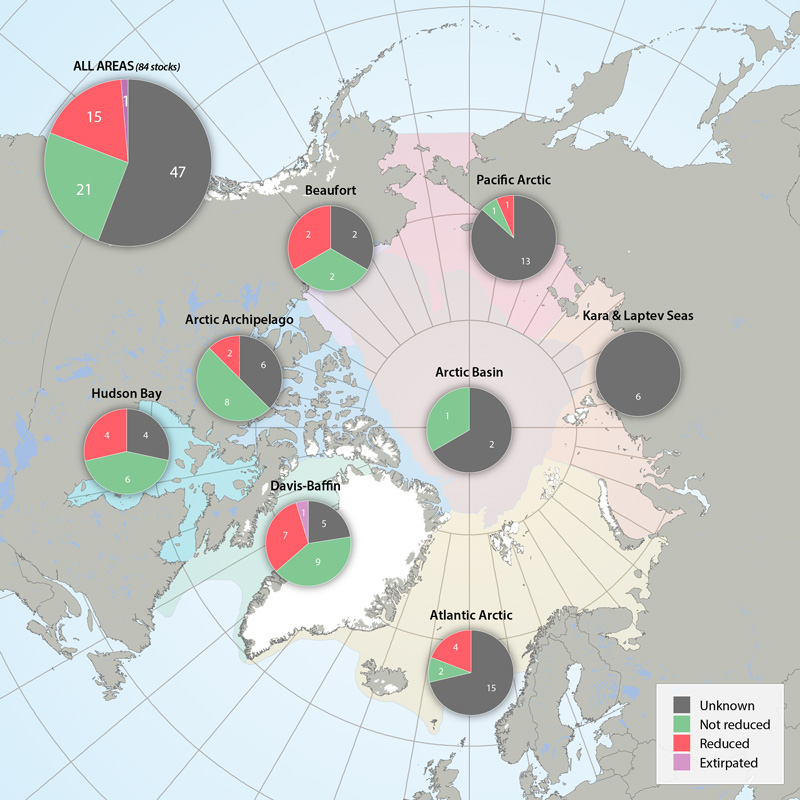
Status of marine mammal Focal Ecosystem Component stocks by Arctic Marine Area. STATE OF THE ARCTIC MARINE BIODIVERSITY REPORT - <a href="https://arcticbiodiversity.is/findings/marine-mammals" target="_blank">Chapter 3</a> - Page 157 - Figure 3.6.3
-
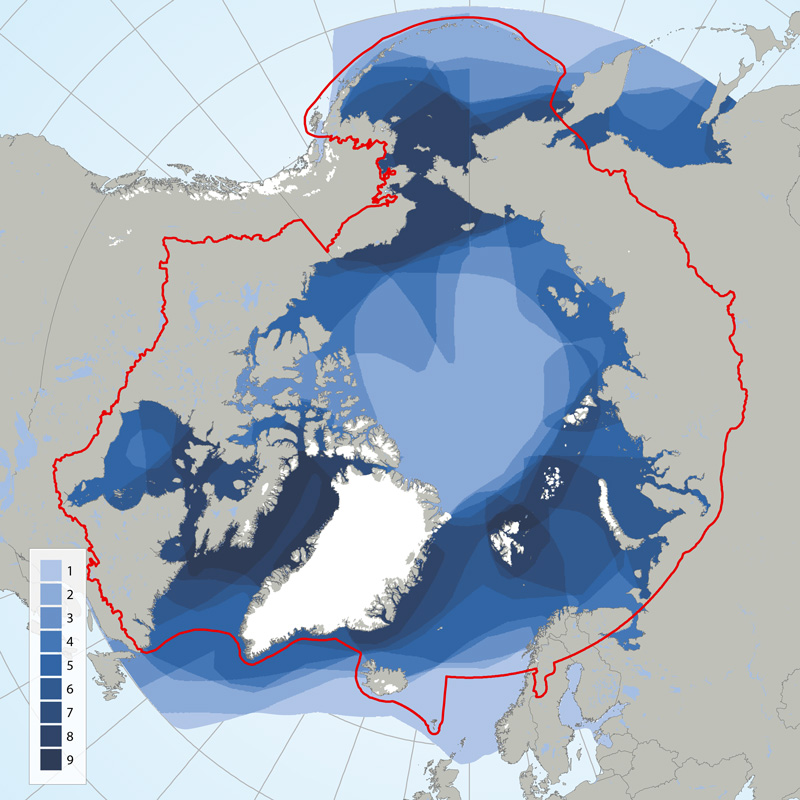
Circumpolar depiction of species richness based on the distributions of the 11 ice-associated Focal Ecosystem Components (according to the distributions reported in IUCN Red List species accounts). A maximum of nine species occur in any one geographic location. The Arctic gateways in both the Atlantic and Pacific regions have the highest species diversity. STATE OF THE ARCTIC MARINE BIODIVERSITY REPORT - <a href="https://arcticbiodiversity.is/findings/marine-mammals" target="_blank">Chapter 3</a> - Page 152 - Figure 3.6.1
-
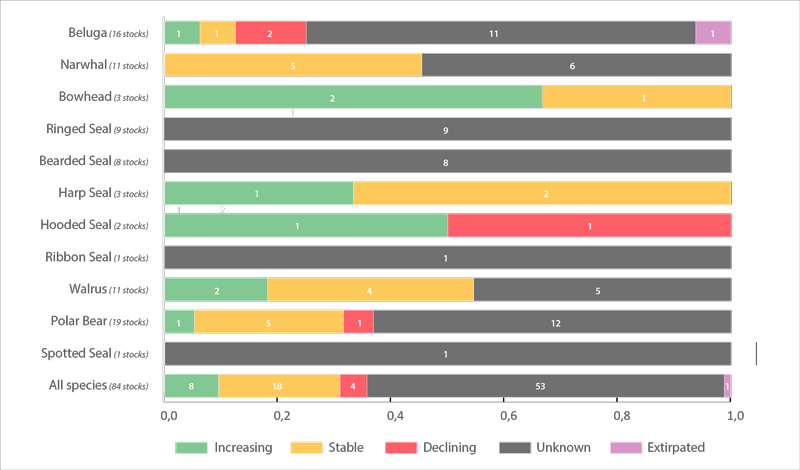
Trends in abundance of Arctic marine mammal Focal Ecosystem Components based on the most recent assessment for each recognized subpopulation of a species (red, declining trend; yellow, stable trend; green, increasing trend; grey, unknown trend). Number of subpopulations is given after species name. Each column is divided into equal segments, the sizes of which are not proportional to the size of the subpopulation. Ringed seal and bearded seal segments represent subspecies. Walrus segments represent subpopulations within subspecies. See Table 3.6.1 for details on abundance. STATE OF THE ARCTIC MARINE BIODIVERSITY REPORT - <a href="https://arcticbiodiversity.is/findings/marine-mammals" target="_blank">Chapter 3</a> - Page 156 - Figure 3.6.2
-

Species characterization by environmental DNA (eDNA) is a method that allows the use of DNA released into the environment by organisms from various sources (secretions, faeces, gametes, tissues, etc.). It is a complementary tool to standard sampling methods for the identification of biodiversity. This project provides a list of fish and marine mammal species whose DNA has been detected in water samples collected between 2019 and 2021 using the mitochondrial marker MiFish (12S). The surveys were carried out in the summer of 2019 (July 14-18) and (July 30 - August 5), in the fall of 2020 (October 27-28) and in the summer-fall of 2021 (May 31 - June 3 ) and (August 24-25) between Forestville and Godbout (Haute-Côte-Nord). Sampling was carried out between 1-50 meters depth in 91 stations, with 1 to 3 replicates per station. Two liters of water were filtered through a 1.2 µm fiberglass filter. DNA extractions were performed with the DNeasy Blood and Tissues or PowerWater extraction kit (Qiagen). Negative field, extraction and PCR controls were added at the different stages of the protocol. The libraries were prepared either by Génome Québec (2019, 2020) or by the Genomics Laboratory of the Maurice-Lamontagne Institute (2021), then sequenced on a NovaSeq 4000 PE250 system by Génome Québec. The bioinformatics analysis of the sequences obtained was carried out using an analysis pipeline developed in the genomics laboratory. A first step made it possible to obtain a table of molecular operational taxonomic units (MOTU) using the cutadapt software for the removal of the adapters and the R package DADA2 for the filtration, the fusion, removal of chimeras and compilation of data. The MOTUs table was then corrected using the R package metabaR to eliminate the tag-jumping and take contaminants into consideration. Samples showing a strong presence of contaminating MOTUs were removed from the dataset. The MOTUs were also filtered to remove all remaining adapter sequences and also retain only those of the expected size (around 170 bp). Finally, taxonomic assignments were made on the MOTUs using the BLAST+ program and the NCBI-nt database. Taxonomic levels (species, genus or family) were assigned using a best match method (Top hit), with a threshold of 95%. Only assignments at the level of fish and marine mammals were considered, and the taxa detected were compared to a list of regional species, and corrected if necessary. The species detections of the different replicas have been combined. The file provided includes generic activity information, including site, station name, date, marker type, assignment types used for taxa identification, and a list of taxa or species. The list of taxa has been verified by a biodiversity expert from the Maurice-Lamontagne Institute. This project was funded by Fisheries and Oceans Canada's Coastal Environmental Baseline Data Program under the Oceans Protection Plan. This initiative aims to acquire baseline environmental data that contributes to the characterization of significant coastal areas and supports evidence-based assessments and management decisions to preserve marine ecosystems. Data were also published on SLGO platform : https://doi.org/10.26071/ogsl-2239bca5-c24a
-
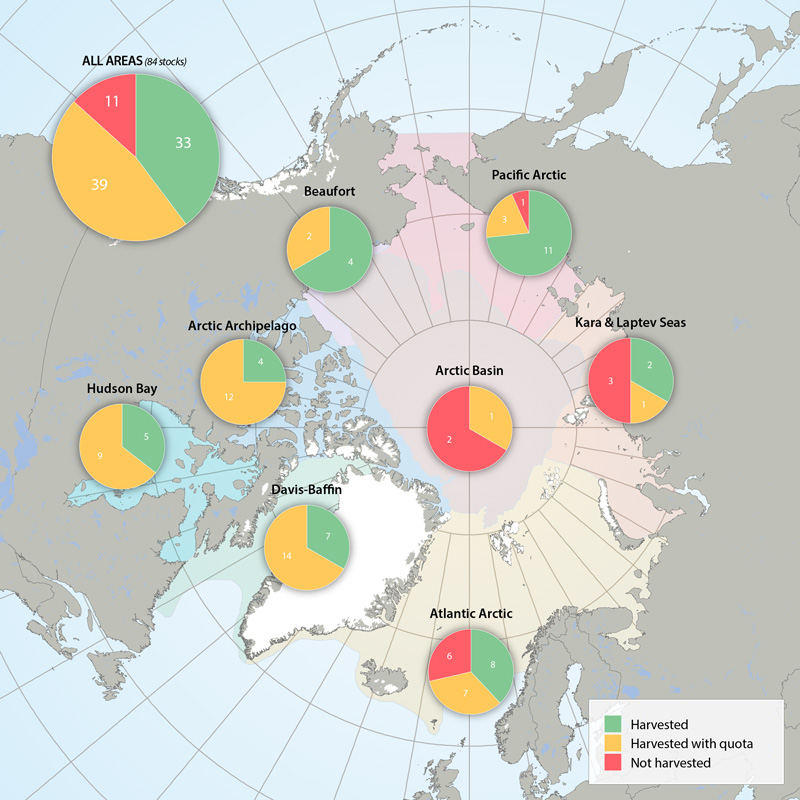
Harvest marine mammal Focal Ecosystem Component stocks in Arctic Marine Areas. Harvested without quotas, with quotas or not harvested. STATE OF THE ARCTIC MARINE BIODIVERSITY REPORT - <a href="https://arcticbiodiversity.is/findings/marine-mammals" target="_blank">Chapter 3</a> - Page 158 - Figure 3.6.4
-
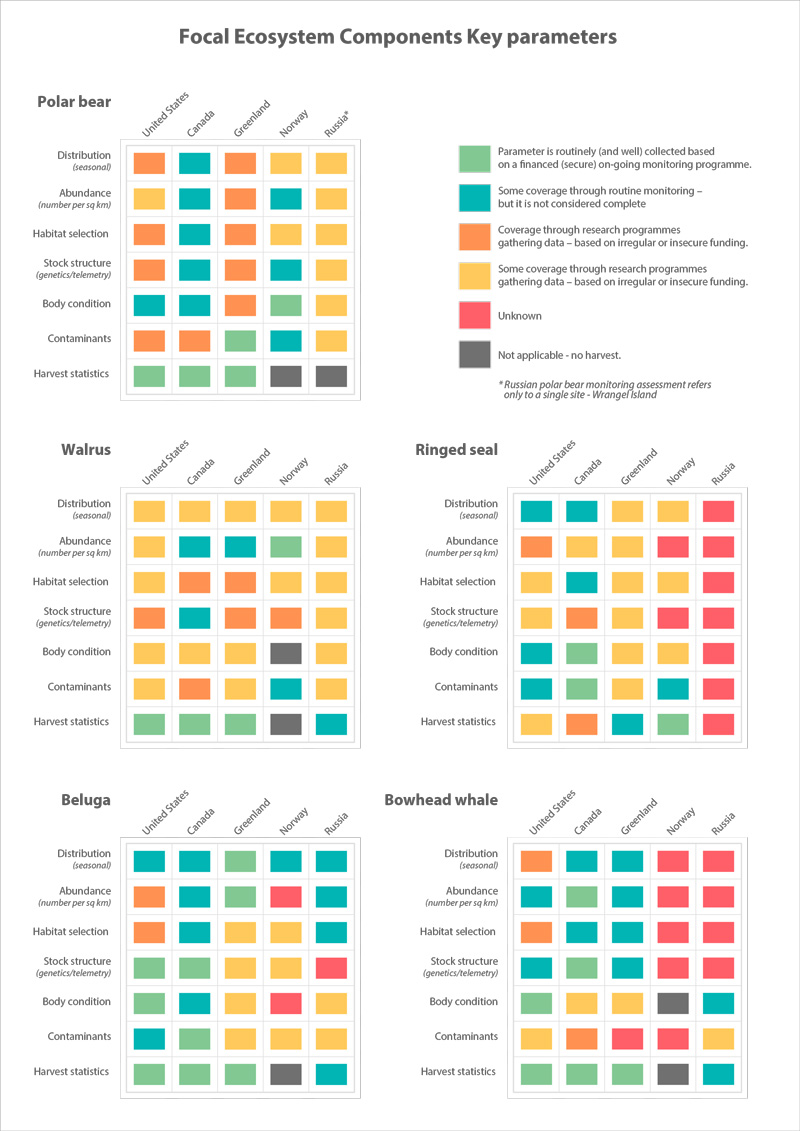
Assessment of monitoring implementation STATE OF THE ARCTIC MARINE BIODIVERSITY REPORT - <a href="https://arcticbiodiversity.is/findings/marine-mammals" target="_blank">Chapter 3</a> - Page 168 - Table 3.6.2
-
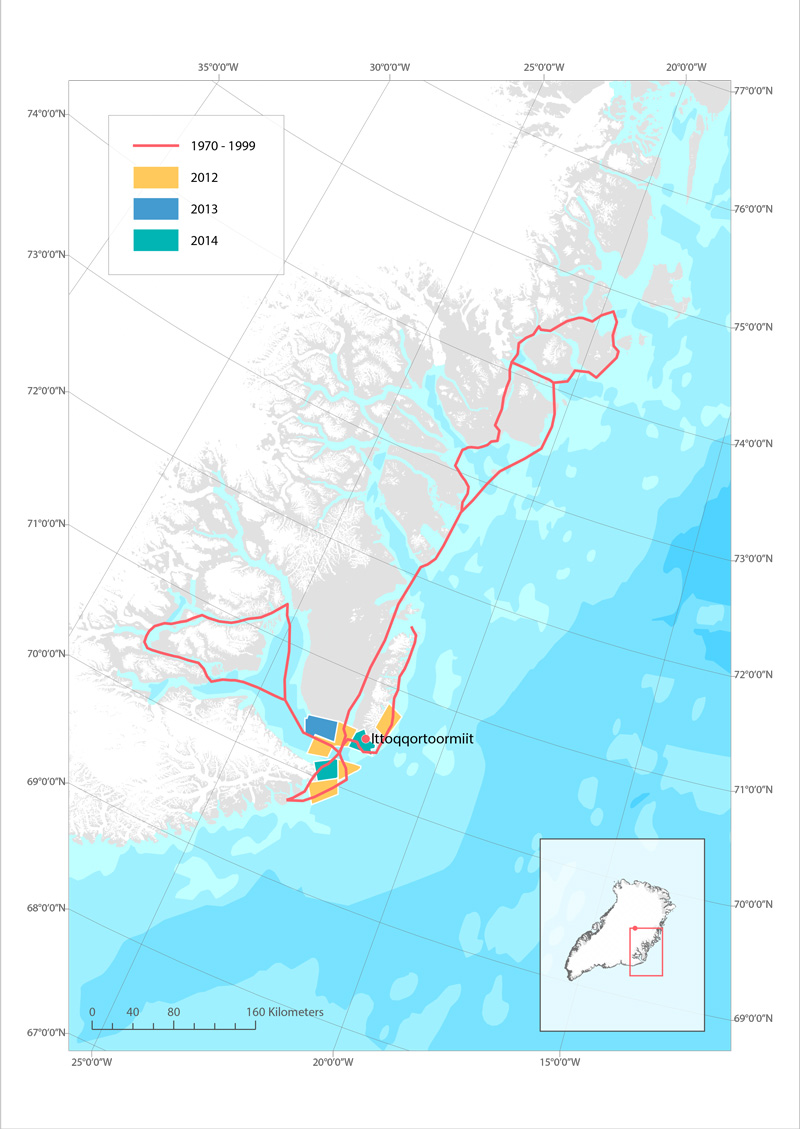
Routes used for hunting polar bear in Ittoqqoortoormiit, East Greenland before 1999 (red line), and in 2012 (yellow), 2013 (blue) and 2014 (green). STATE OF THE ARCTIC MARINE BIODIVERSITY REPORT - <a href="https://arcticbiodiversity.is/findings/marine-mammals" target="_blank">Chapter 3</a> - Page 159 - Box figure 3.6.1
-
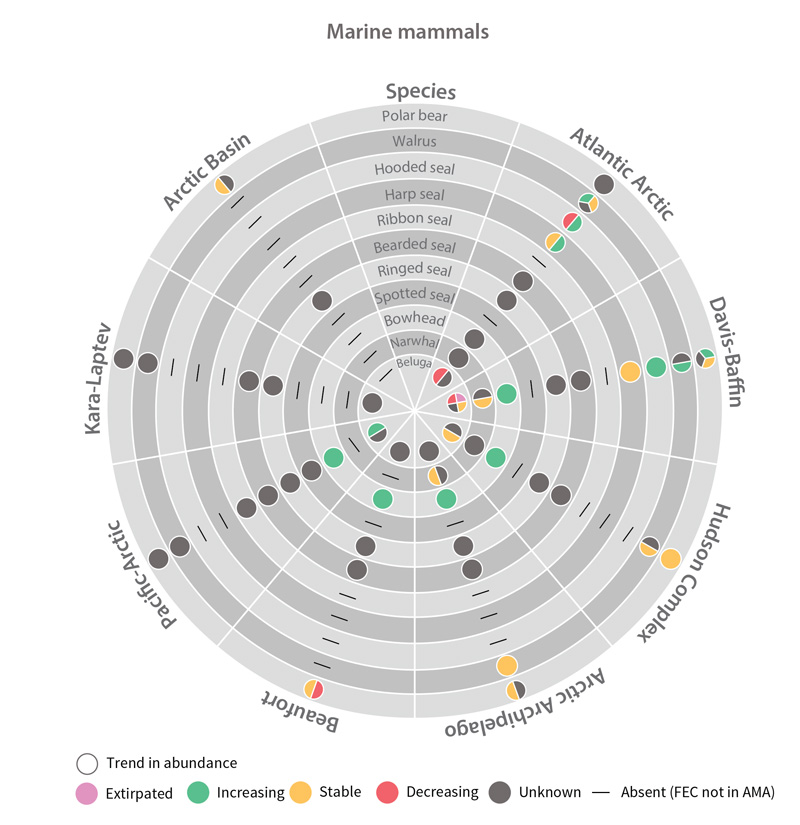
Trends in abundance of marine mammal Focal Ecosystem Components across each Arctic Marine Area. STATE OF THE ARCTIC MARINE BIODIVERSITY REPORT - Chapter 4 - Page 182 - Figure 4.6
 Arctic SDI catalogue