 Arctic SDI catalogue
CSV
Type of resources
Available actions
Topics
Keywords
Contact for the resource
Provided by
Years
Formats
Representation types
Update frequencies
status
Scale
Resolution
-

Summary The Quebec region of the Department of Fisheries and Oceans (DFO) is responsible for the assessment of several fish and invertebrate stocks exploited in the Estuary and the northern Gulf of St. Lawrence. The commercial catches sampling program is one of the sources of information used to complete these assessments. The data collected by this program, at wharf or at sea, offers among other things the advantage of a relatively large spatio-temporal coverage and provides some of the necessary knowledge to assess the demography and the structure of the exploited populations. This program is implemented by specialized DFO staff whose main mandate is to collect biological data on groundfish, pelagic fish and marine invertebrate species that are commercially exploited in the various marine communities. Data This dataset on the winter flounder (Pseudopleuronectes americanus) includes the metadata, sample weight, fish length, the sex and the number of specimens measured. This dataset covers the periods of 1992, 1997-2019. In order to protect the confidentiality of the sources, some informations (such as those concerning the vessel) have been excluded and others (such as the date of capture) have been simplified. Entries where there was only one vessel in a fishing area for a given year were also excluded. Further information including the fishing areas coordinates can be found by clicking on the «Atlantic and Arctic commercial fisheries» and «Fishing areas» links below.
-

PURPOSE: Monitor commercial landings of NAFO Division 4T Atlantic herring. DESCRIPTION: This dataset contains Atlantic herring landings (in metric tonnes) by year, spawning stock (spring and fall spawners), fishing season (spring and fall), and gear type (fixed and mobile). Stock identification (spring or fall spawners) is determined through port sampling. Two fish samples are collected per week in each herring fishing area for this purpose. Daily landings data are obtained from the DFO Statistics Branch. USE LIMITATION: To ensure scientific integrity and appropriate use of the data, we would encourage you to contact the data custodian.
-

This dataset provides projected 30-year, 50-year, and 100-year return levels for harbours in British Columbia by 2050 and 2100 under an intermediate emission scenario SSP245, relative to the mean sea level over 1993-2020. The return levels are a combination of estimated present extreme sea levels and projected mean sea level rise. The present extreme sea levels are derived from hourly coastal sea levels for the period from 1993 to 2020, simulated using a high-resolution Northeast Pacific Ocean Model (NEPOM). The projected mean sea level rise is derived from the regional mean sea level rise data of the IPCC 6th Assessment Report under SSP245, adjusted for the local vertical land motion.
-

This dataset provides projected 30-year, 50-year, and 100-year return levels for harbours in British Columbia by 2050 and 2100 under a high emission scenario SSP585, relative to the mean sea level over 1993-2020. The return levels are a combination of estimated present extreme sea levels and projected mean sea level rise. The present extreme sea levels are derived from hourly coastal sea levels for the period from 1993 to 2020, simulated using a high-resolution Northeast Pacific Ocean Model (NEPOM). The projected mean sea level rise is derived from the regional mean sea level rise data of the IPCC 6th Assessment Report under SSP585, adjusted for the local vertical land motion.
-

This dataset contains the data reported in Wesley R Ogloff, Randi A Anderson, David J Yurkowski, Cassandra D Debets, W Gary Anderson, Steven H Ferguson, Spatiotemporal variation of ringed seal blubber cortisol levels in the Canadian Arctic, Journal of Mammalogy, 2022;, gyac047, https://doi.org/10.1093/jmammal/gyac047 Cite this data as: Wesley R Ogloff, Randi A Anderson, David J Yurkowski, Cassandra D Debets, W Gary Anderson, Steven H Ferguson. 2022 Spatiotemporal variation of ringed seal blubber cortisol levels in the Canadian Arctic. Arctic and Aquatic Research Division, Fisheries and Oceans Canada, Winnipeg, MB. https://open.canada.ca/data/en/dataset/e1c6b350-0159-11ed-8212-1860247f53e3
-
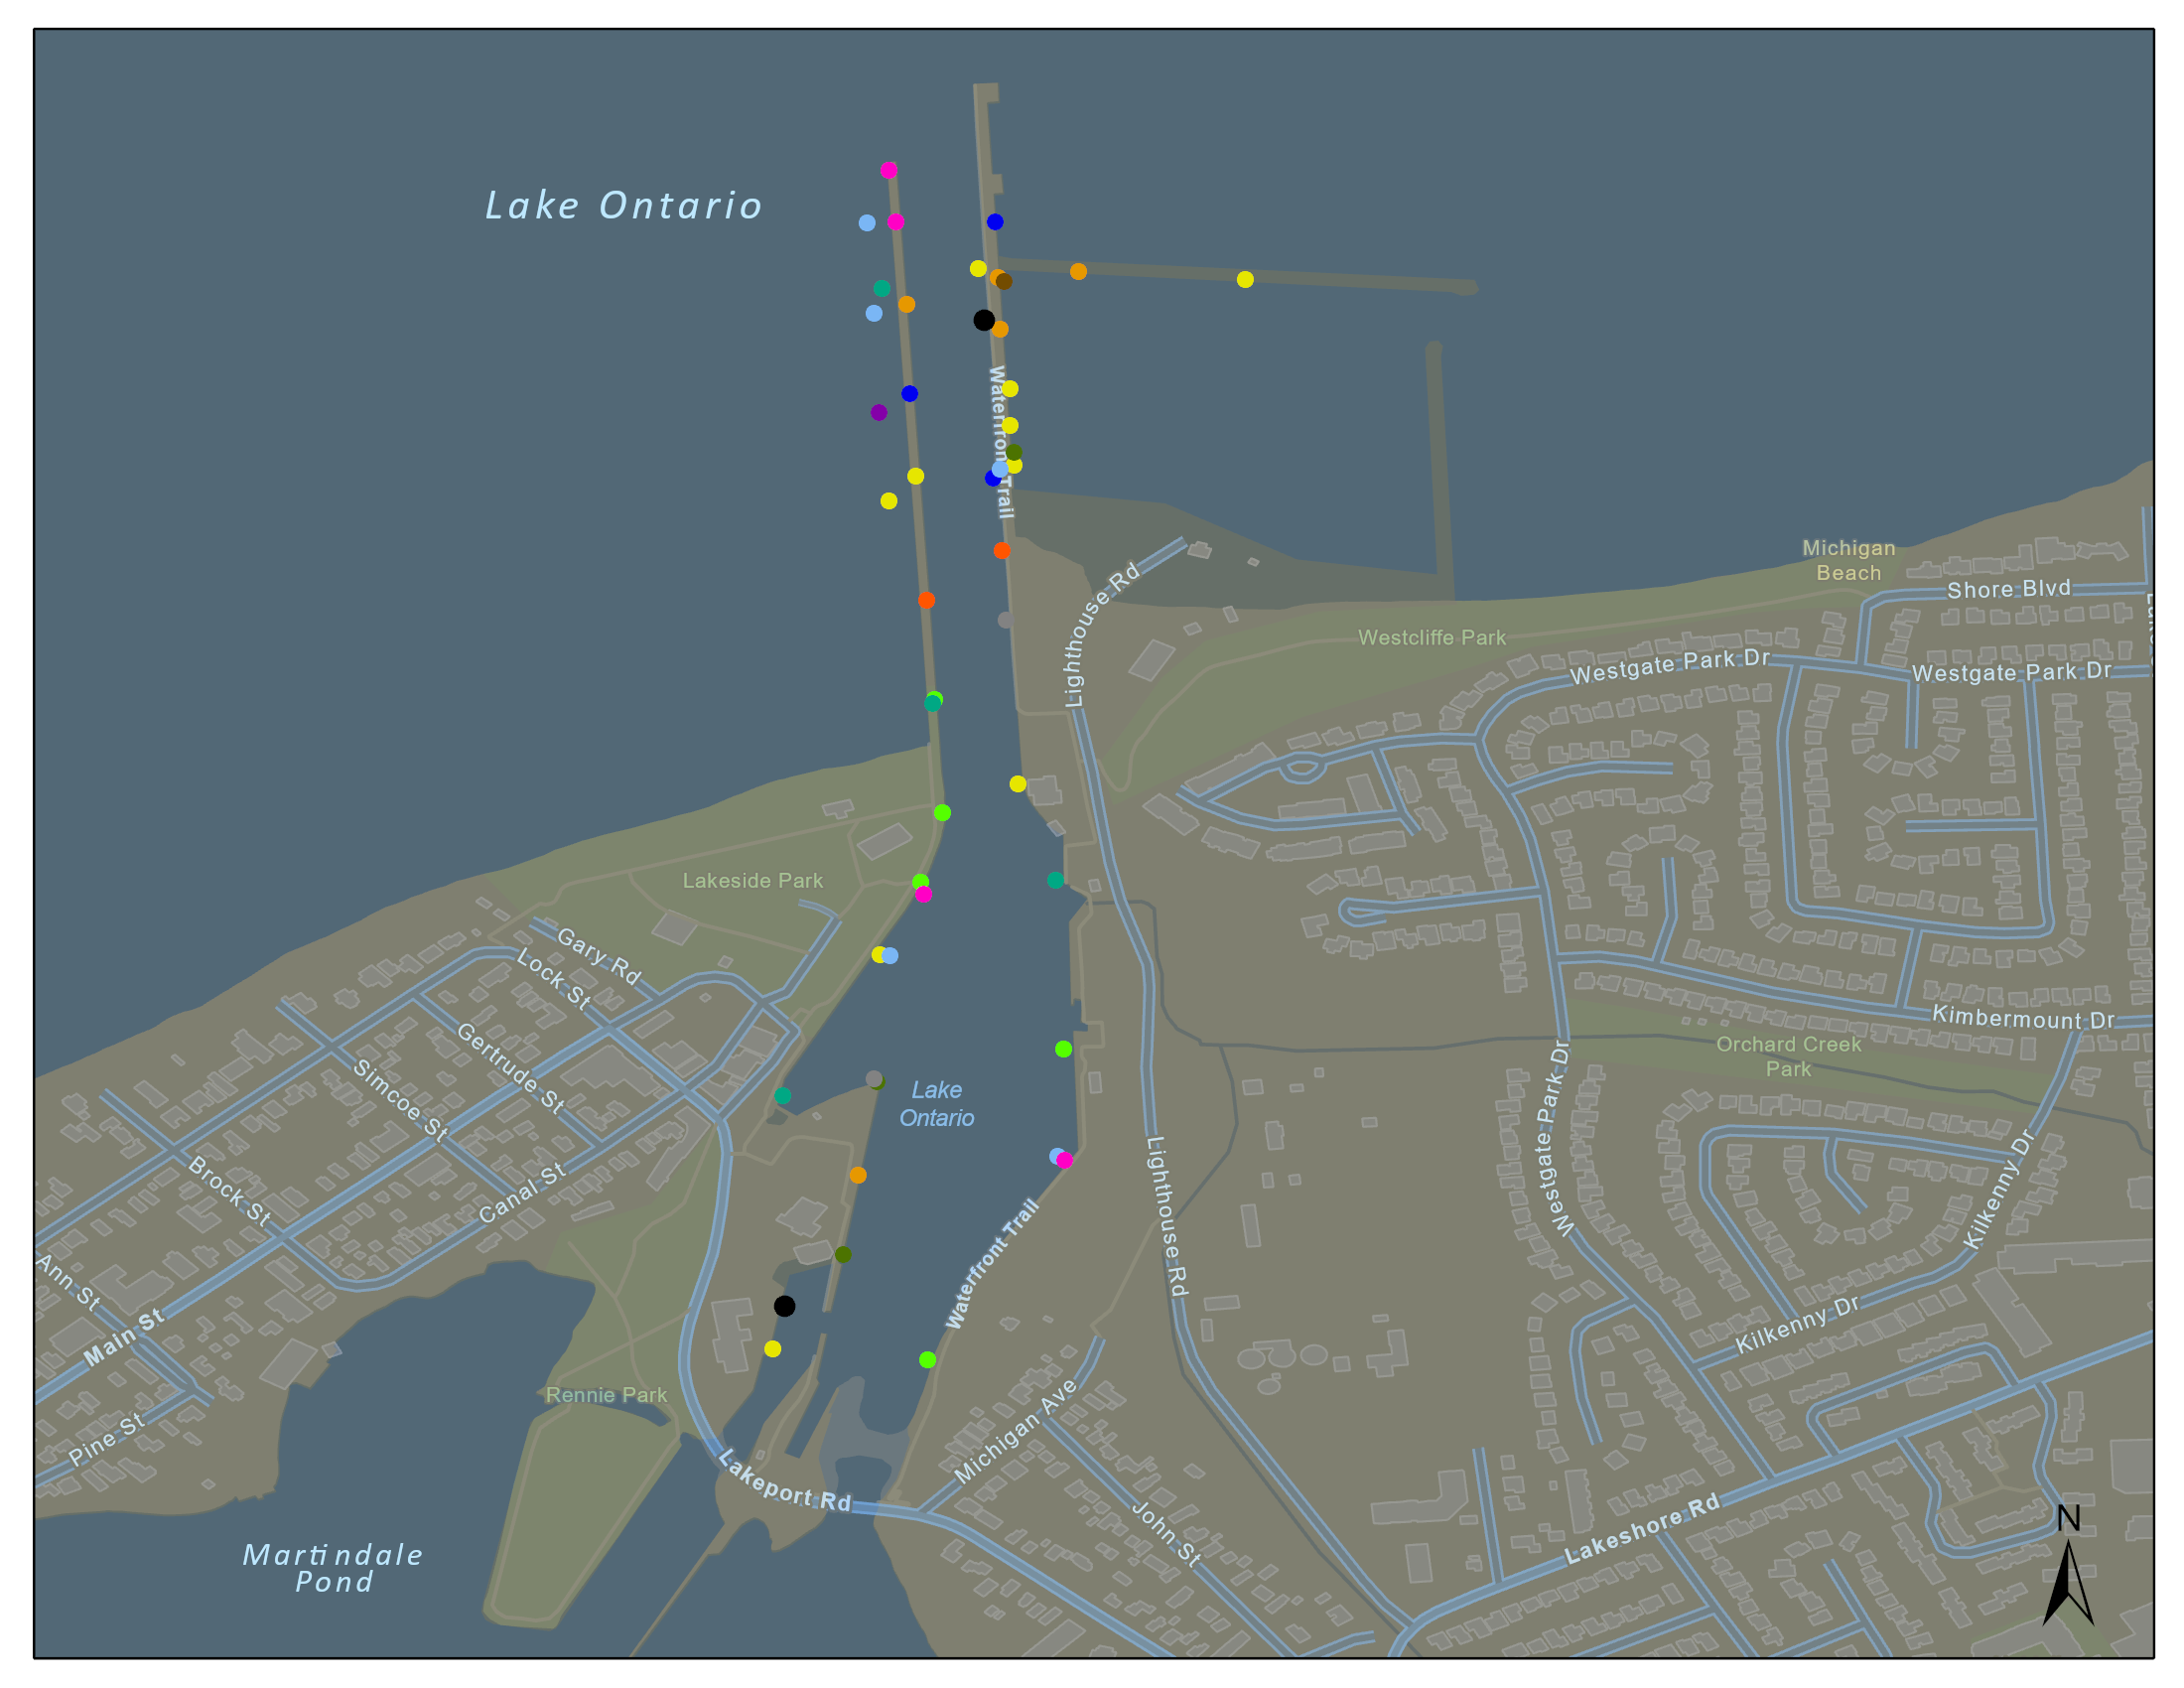
In 2018 and 2019 Fisheries and Oceans Canada conducted a project to relocate American Eel (Anguilla rostrata) from Port Dalhousie Harbour to mitigate potential impacts of in-water construction prior to and during an essential harbour revitalization project. American Eel are designated as Endangered under the Province of Ontario’s Endangered Species Act and were confirmed to be present in the area during initial sampling efforts of this project. While a combination of passive eel traps and boat electrofishing were used to capture eels, this dataset includes passive capture data only. A total of four eels were captured using eel traps and all individuals were relocated to Hamilton Harbour. Only two of the four eels captured were large enough to be tagged with acoustic transmitters, both of which eventually returned to Port Dalhousie from Hamilton Harbour. All other fish species captured in the traps were identified, counted and released at Port Dalhousie.
-
With the changing climate conditions, marine traffic along Canada’s coastal regions has increased over the past couple of decades and the need to improve our state of preparedness for oil-spill-related emergencies is critical. Baseline coastal information, such as shoreline form, substrate, and vegetation type, is required for prioritizing operations, coordinating onsite spill response activities (i.e. Shoreline Cleanup Assessment Technique [SCAT]), and providing information for wildlife and ecosystem management. Between 2010 and 2016, georeferenced high-definition videography and photos were collected for various study sites along the north coast of Canada. The study areas include Beaufort Sea, Mackenzie Delta channels and Banks Island in the western Canadian Arctic and James Bay, Hudson Bay, Nunavik, Resolute Bay, Victoria Strait, Baffin Island and Coronation Gulf in the eastern Canadian Arctic. Data was collected during ice-free and low tide conditions (where applicable) between July and September. Low-altitude helicopter surveys were conducted at each study site to capture video of the shoreline characteristics. In addition to acquiring videography, ground-based observations were recorded in several locations for validation. Shoreline segmentation was then carried out by manual interpretation of the oblique videography and the photos aided by ancillary data. This involved splitting and classifying the shoreline vectors based on homogeneity of the upper intertidal zone. Detailed geomorphological information (i.e. shoreline type, substrate, slope, height, accessibility etc.) describing the upper intertidal, lower intertidal, supratidal and backshore zones was extracted from the video and entered into a geospatial database using a customized data collection form. In addition, biological characteristics like biobands, water features, fauna, human use etc. observed along the coast were recorded. The data was also validated through ground observations (when available) and a second interpreter QA (quality analysis) was performed on each dataset (excluding Nunavik) to ensure high quality and consistency. The final dataset contains segments ranging in length from 150 metres to 2500 metres. In total, from 2010 to 2016, within the 8 study sites, about 16,800 km of shoreline were segmented.
-
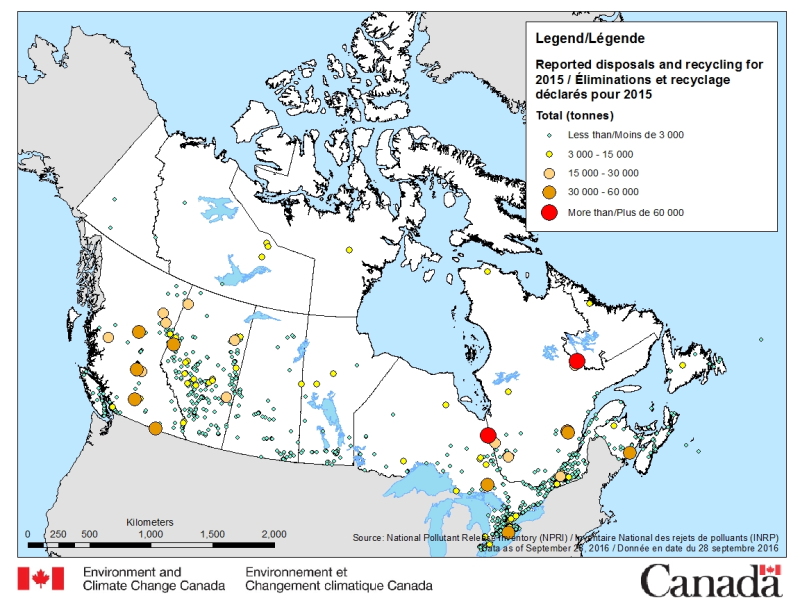
The National Pollutant Release Inventory (NPRI) is Canada's public inventory of pollutant releases (to air, water and land), disposals and transfers for recycling. The files below contain a map of Canada showing the locations of all facilities that reported disposals and transfers to the NPRI in the most recent reporting year, by reported total quantities. The map is available in both ESRI REST (to use with ARC GIS) and WMS (open source) formats. For more information about the individual reporting facilities, a dataset is available in an csv format. Please consult the following resources to enhance your analysis: - Guide on using and Interpreting NPRI Data: https://www.canada.ca/en/environment-climate-change/services/national-pollutant-release-inventory/using-interpreting-data.html - Access additional data from the NPRI, including datasets and mapping products: https://www.canada.ca/en/environment-climate-change/services/national-pollutant-release-inventory/tools-resources-data/exploredata.html
-
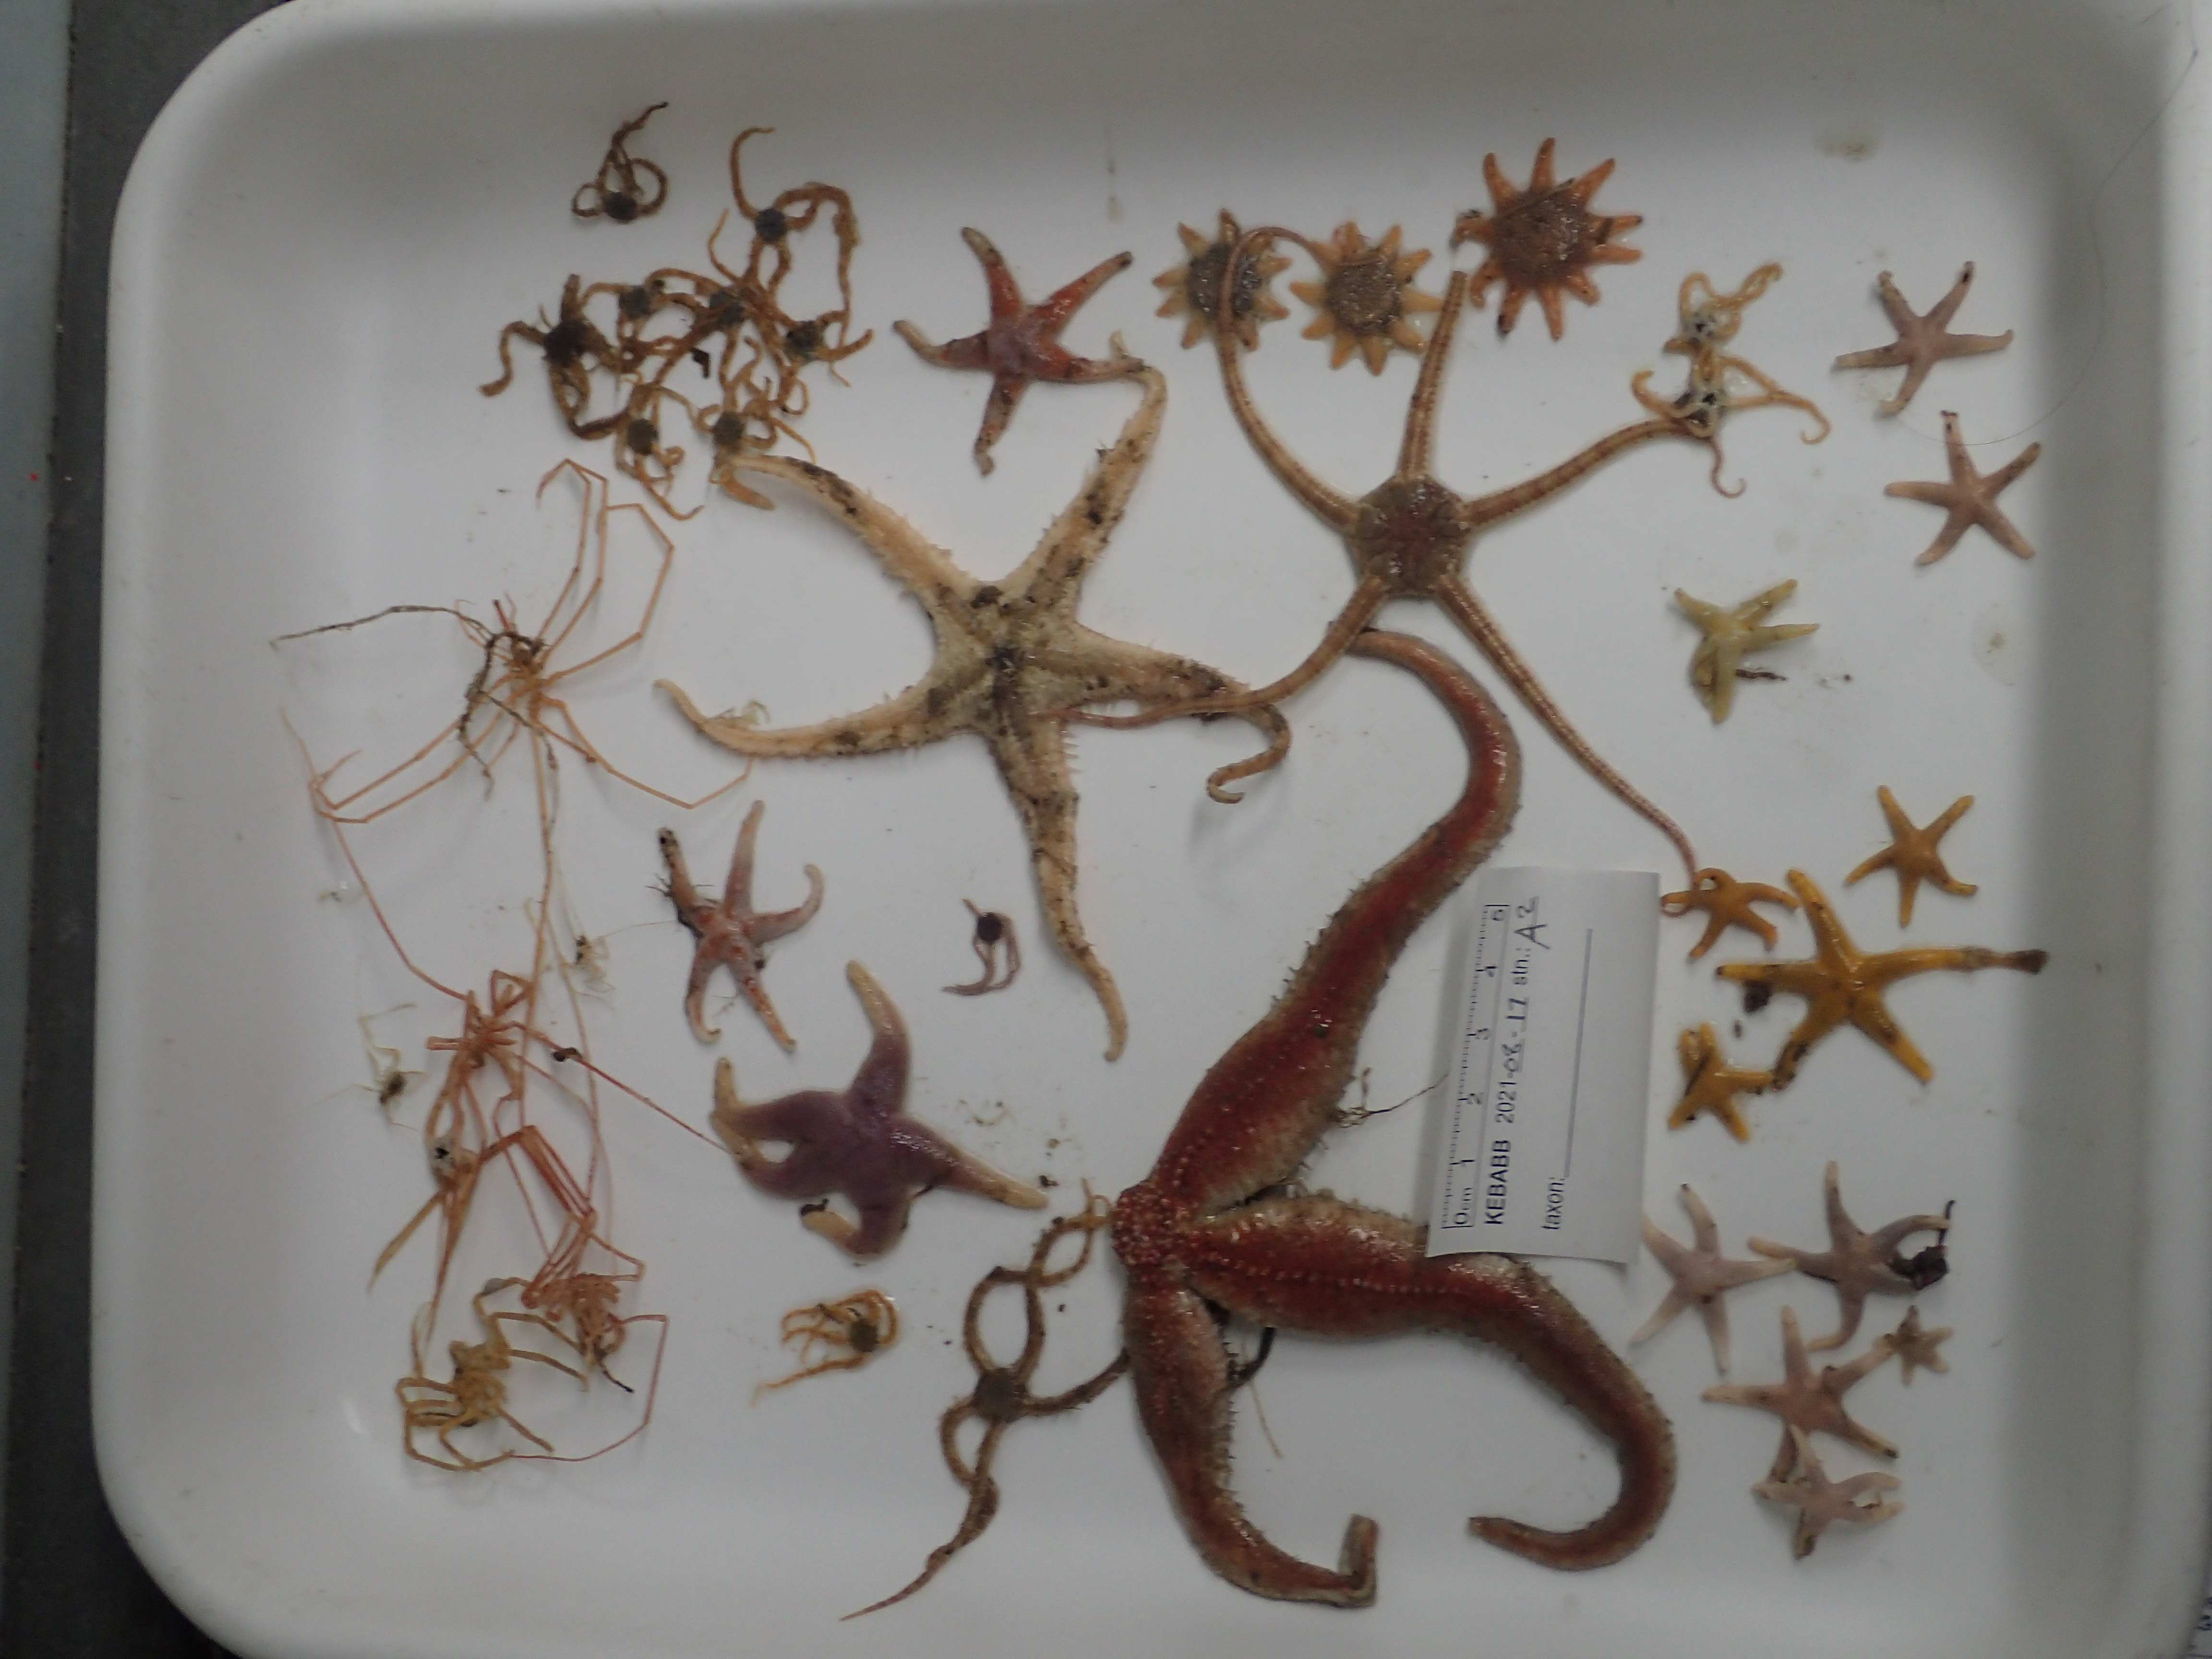
This resource documents a dataset of epifauna occurrences collected in 2021 during The Knowledge and Ecosystem-Based Approach in Baffin Bay (KEBABB) program developed by the Department of Fisheries and Oceans Canada (DFO) in collaboration with university partners. The overall objective of KEBABB is to characterize the variability and trends in physical, chemical, and biological oceanographic conditions and food webs supporting fisheries in the connected ecosystems of western Baffin Bay and Lancaster Sound. In 2021, DFO expanded the KEBABB program to Barrow Strait (KEBABS-Knowledge and Ecosystem-Based Approach in Barrow Strait), a key productive area of the Tallurutiup Imanga National Marine Conservation Area. The study took place in the Eastern Canadian Arctic (mainly in Baffin Bay, Davis Strait and Barrow Strait). Sampling is done along transects at fixed stations in the study area. Catches are collected with a 1.5 m Agassiz trawl (5 mm mesh net) for 3 minutes bottom-contact time at a target speed of 1.5 knots and with a 3 m benthic beam trawl (6.4 mm mesh net) for 15 minutes bottom-contact time at a target speed of 3 knots. A total of 16 stations were sampled for epifauna in 2021 between 85-850 m depth. Epibenthic invertebrates are identified to the lowest possible taxonomic level and photographed. All unknown specimens are frozen. In the lab, the identifications are validated or refined with the photos and the frozen specimens. The data are presented in Darwin Core and are separated in two files: The “Activité_épifaune_KEBABB_epifauna_event_en” file which contains information about missions, stations and deployments, which are presented under a hierarchical activity structure. The “Occurrence_épifaune_KEBABB_epifauna_en” file that contains the taxonomic occurrences. Further details on sampling can be found in the following report: Pućko, M., Charette, J., Tremblay P., Brulotte S., St-Denis B., Ciastek S., Hedges, K., Kuzyk, Z., Roy V., and Michel, C. 2022. An ecosystem-based approach in the eastern Arctic: KEBABB/S (Knowledge and Ecosystem-Based Approach in Baffin Bay/Barrow Strait) 2021 expedition report. Can. Manuscr. Rep. Fish. Aquat. Sci. 3250: viii + 58 p. https://publications.gc.ca/collections/collection_2022/mpo-dfo/Fs97-4-3250-eng.pdf USE LIMITATION: To ensure scientific integrity and appropriate use of the data, we would encourage you to contact the data custodian.
-

An exploratory project on the taxonomic and genetic diversity of decapods in three ocean subregions (Northeast Pacific, Canadian Arctic, and Northwest Atlantic), which were sampled in 2022, was undertaken by the Arctic Working Group under the Canada-U.S. Fisheries and Climate Collaboration between Fisheries and Oceans Canada (DFO) and the National Marine Fisheries Service (NMFS) of the National Oceanic and Atmospheric Administration (NOAA). This collaboration framework aims to pool Canadian and U.S. data to explore the impacts of broad-scale climate change on marine biodiversity. In early summer 2022, a sampling protocol with the selection of targeted decapods was provided to DFO and NOAA collaborators. Targeted genera were collected from a total of 10 research programs across three ocean subregions and four marine regions. The Northeast Pacific samples were collected in the Bering Sea during the Northern Bering Sea Ecosystem and Surface Trawl Survey, and the Eastern and Northern Bering Sea Continental Shelf Bottom Trawl Survey of Groundfish and Invertebrate Fauna onboard the F/V Northwest Explorer, F/V Alaska Knight and F/V Vesteraalen. In the Western Canadian Arctic (mainly from Beaufort Sea and Amundsen Gulf), specimens were collected during DFO’s Canadian Beaufort Sea – Marine Ecosystem Assessment (CBS-MEA) survey onboard the F/V Frosti. In Eastern Canadian Arctic (mainly from Baffin Bay and Davis Strait), specimens were collected during DFO’s Knowledge and Ecosystem-Based Approach in Baffin Bay (KEBABB) survey onboard the CCGS Amundsen and DFO’s North Atlantic Fisheries Organization (NAFO) Subarea 0B survey onboard the R/V Tarajoq. In the Estuary and Gulf of St. Lawrence (EGSL), specimens were collected from coastal surveys (scallops, sea cucumber, snow crab, and whelk surveys) onboard the CCGS Leim and offshore during the Ecosystemic Survey onboard the CCGS Teleost. Decapods were collected from various sampling gears (benthic beam trawl, modified Atlantic Western IIA otter trawl, Bacalao trawl, shrimp trawl, Digby scallop dredge, or modified sea cucumber dredge) and identified to the lowest possible taxonomic level and photographed, when possible. All specimens were frozen at sea (n = 995). In the lab, the identifications were validated or refined with the photos and the frozen specimens. DNA was extracted for 87 specimens and a section of COI gene was amplified in order to be sequenced using Sanger method. Sequences were compared with existing data using The Basic Local Alignment Search Tool (BLAST) in the National Center for Bio-technology Information Nucleotide database (NCBI-nt, including the GenBank database) to compare scientific names, where available. The present dataset includes 391 decapod species occurrences. DNA was extracted for a subset of 87 specimens (COI gene); sequences are publicly available on BOLD data portal under project code DDAO (see supporting document "citations_references.csv" for more information). The data are presented in Darwin Core format and are separated in three files: The "Activité_décapodes_DDAO_decapods_event_en" file contains information about missions, stations and deployments, which are presented under a hierarchical activity structure. The "Occurrence_décapodes_DDAO_decapods_en" file contains the taxonomic occurrences. The "ADN_décapodes_DDAO_decapods_DNA_en" file contains the DNA derived data. For further details, please refer to the technical report available in the supporting document named "citations_references.csv". USE LIMITATION: To ensure scientific integrity and appropriate use of the data, we would encourage you to contact the data custodian.