 Arctic SDI catalogue
Species at Risk (SAR)
Type of resources
Topics
Keywords
Contact for the resource
Provided by
Formats
Representation types
Update frequencies
status
-

This dataset displays the geographic areas within which critical habitat (CH) for terrestrial species at risk, listed on Schedule 1 of the federal Species at Risk Act (SARA), occurs in Canada. Note that this includes only terrestrial species and species for which Environment and Climate Change Canada (ECCC) and Parks Canada Agency (PCA) lead. Under SARA, critical habitat is “the habitat that is necessary for the survival or recovery of a listed wildlife species and that is identified as the species’ critical habitat in the recovery strategy or action plan for the species.” To precisely define what constitutes critical habitat for a particular species it is essential that this geospatial information be considered in conjunction with complementary information provided in a species’ recovery document. Recovery documents are available from the Species at Risk (SAR) Public Registry (https://www.canada.ca/en/environment-climate-change/services/species-risk-public-registry.html) for two posting stages (proposed and final posting). The recovery documents contain important information about the interpretation of the geospatial information, especially regarding the biological and environmental features (“biophysical attributes”) that complete the definition of a species’ critical habitat. Within any defined critical habitat geospatial boundary, not all of the area is necessarily critical habitat. It is important to note that recovery planning documents (and, therefore, critical habitat) may be amended from time to time as new information becomes available, which may occur after a document has been posted as proposed or final on the SAR Public Registry. The SAR Public Registry should always be considered as the main source for critical habitat information. In cases where the data are sensitive, the geographic area within which critical habitat occurs may be represented as grids. These are coarse grids (1, 10, 50 or 100 square kilometres) that serve as indicators to locate critical habitat in the recovery planning document. More detailed information on critical habitat may be made available on a need-to-know basis by contacting Environment and Climate Change Canada – Canadian Wildlife Service at ec.planificationduretablissement-recoveryplanning.ec@canada.ca. The data is current as of the date of the most recent revision.
-

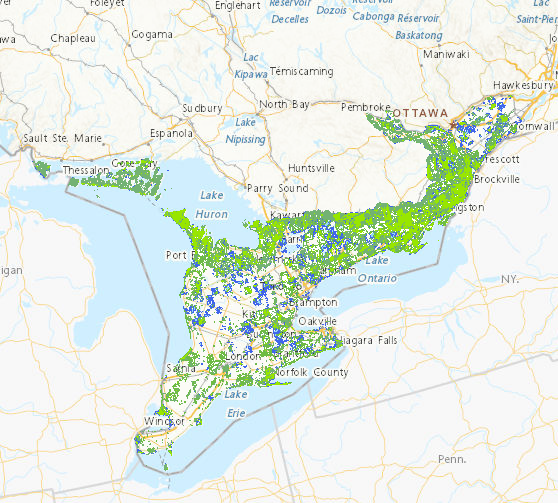
The Canadian Wildlife Service - Ontario Region Biodiversity Atlas represents the Canadian Wildlife Service biodiversity portfolio across the Ontario portions of the Boreal Hardwood Shield (Bird Conservation Region 12) and Mixedwood Plains (Bird Conservation Region 13) ecozones. These data are the derived product from an extensive landscape assessment that assessed the Canadian Wildlife Service biodiversity portfolio (Species at Risk, migratory birds, habitat) at various resolutions. Biodiversity is mapped by forest, grassland (open country) and wetland quality and quantity, and then progressively combined to identify local High Value Biodiversity Areas. At the finest resolution, scores were applied to each unit of analysis (5 hectare hexagon in Bird Conservation Region 12; 2 hectare hexagon in Bird Conservation Region 13), based on over 30 criteria for landscape habitat condition, Species at Risk and migratory birds. Habitat condition scores were derived from guidance in Environment and Climate Change Canada's existing How Much Habitat is Enough? and in Bird Conservation Region 12, where the landscape is less fragmented, habitat was also based on draft guidance in How Much Disturbance is too Much? Individual scores were summed and various combinations (e.g. top 25% of forest scores + top 25% of Species at Risk (SAR) scores) were calculated to identify areas with multiple conservation value. For each habitat type (forest, grassland and wetland), study units with more than one conservation value were aggregated into High Value Habitat which were subsequently aggregated into High Value Biodiversity Areas (HVBA). The results are areas on the landscape that have high value from a Canadian Wildlife Service specific lens; that is, they are high quality habitats that are important for Species at Risk and/or migratory birds. High value habitats are those forests, grasslands and wetlands with potential high conservation value (PHCV). They contain at least 1 of a possible 3 potential high conservation values: top 25% of overall habitat scores, top 25% of Species at Risk (SAR) scores, and/or top 25% of relevant migratory bird scores. High value forest, grassland and wetland were derived by combining landscape, Species at Risk (SAR) and migratory bird elements (see Table 1). Overall habitat scores were assigned to each study unit based on the combined scores for each forest, grassland and wetland. These overall habitat scores were divided into quartiles, and the top 25% of each total score (overall forest, overall grassland and overall wetland) are considered to be potential high conservation value. Similarly, SAR scores were assigned for each study unit, totalled and broken into quartiles. The top 25% of SAR scores that intersect each of forest, grassland and wetland are considered to be the highest quality habitats important to SAR and have potential high conservation value. Finally, relevant migratory bird scores were totalled within each study unit, divided into quartiles and the top 25% of migratory bird scores that intersect each of forest, grassland and wetland are considered to be the highest quality habitats important to migratory birds and have potential high conservation value. Study units with a PHCV greater than 0 (i.e., contains at least 1 of the possible 3 potential high conservation values) were aggregated together by 750 m to create High Value Habitats. High value biodiversity areas (HVBAs) are those study units that contain multiple high value habitats (high value forest and/or high value grassland and/or high value wetland). High value biodiversity areas (HVBA) were derived by aggregating high value forest, grassland and wetland. Study units with a potential high conservation value greater than 1 were aggregated together by 750 m. Biodiversity sites are areas greater than 20 ha, and secondary biodiversity sites are areas less than 20 ha in area.
-
The Canadian Wildlife Service - Ontario Region Biodiversity Atlas represents the Canadian Wildlife Service biodiversity portfolio across the Ontario portions of the Boreal Hardwood Shield (Bird Conservation Region 12) and Mixedwood Plains (Bird Conservation Region 13) ecozones. These data are the derived product from an extensive landscape assessment that assessed the Canadian Wildlife Service biodiversity portfolio (Species at Risk, migratory birds, habitat) at various resolutions. Biodiversity is mapped by forest, grassland (open country) and wetland quality and quantity, and then progressively combined to identify local High Value Biodiversity Areas. At the finest resolution, scores were applied to each unit of analysis (5 hectare hexagon in Bird Conservation Region 12; 2 hectare hexagon in Bird Conservation Region 13), based on over 30 criteria for landscape habitat condition, Species at Risk and migratory birds. Habitat condition scores were derived from guidance in Environment and Climate Change Canada's existing How Much Habitat is Enough? and in Bird Conservation Region 12, where the landscape is less fragmented, habitat was also based on draft guidance in How Much Disturbance is too Much? Individual scores were summed and various combinations (e.g. top 25% of forest scores + top 25% of Species at Risk (SAR) scores) were calculated to identify areas with multiple conservation value. For each habitat type (forest, grassland and wetland), study units with more than one conservation value were aggregated into High Value Habitat which were subsequently aggregated into High Value Biodiversity Areas (HVBA). The results are areas on the landscape that have high value from a Canadian Wildlife Service specific lens; that is, they are high quality habitats that are important for Species at Risk and/or migratory birds. High value habitats are those forests, grasslands and wetlands with potential high conservation value (PHCV). They contain at least 1 of a possible 3 potential high conservation values: top 25% of overall habitat scores, top 25% of Species at Risk (SAR) scores, and/or top 25% of relevant migratory bird scores. High value forest, grassland and wetland were derived by combining landscape, Species at Risk (SAR) and migratory bird elements (see Table 1). Overall habitat scores were assigned to each study unit based on the combined scores for each forest, grassland and wetland. These overall habitat scores were divided into quartiles, and the top 25% of each total score (overall forest, overall grassland and overall wetland) are considered to be potential high conservation value. Similarly, SAR scores were assigned for each study unit, totalled and broken into quartiles. The top 25% of SAR scores that intersect each of forest, grassland and wetland are considered to be the highest quality habitats important to SAR and have potential high conservation value. Finally, relevant migratory bird scores were totalled within each study unit, divided into quartiles and the top 25% of migratory bird scores that intersect each of forest, grassland and wetland are considered to be the highest quality habitats important to migratory birds and have potential high conservation value. Study units with a PHCV greater than 0 (i.e., contains at least 1 of the possible 3 potential high conservation values) were aggregated together by 750 m to create High Value Habitats. High value biodiversity areas (HVBAs) are those study units that contain multiple high value habitats (high value forest and/or high value grassland and/or high value wetland). High value biodiversity areas (HVBA) were derived by aggregating high value forest, grassland and wetland. Study units with a potential high conservation value greater than 1 were aggregated together by 750 m. Biodiversity sites are areas greater than 20 ha, and secondary biodiversity sites are areas less than 20 ha in area.