ZIP
Type of resources
Available actions
Topics
Keywords
Contact for the resource
Provided by
Years
Formats
Representation types
Update frequencies
status
Scale
Resolution
-
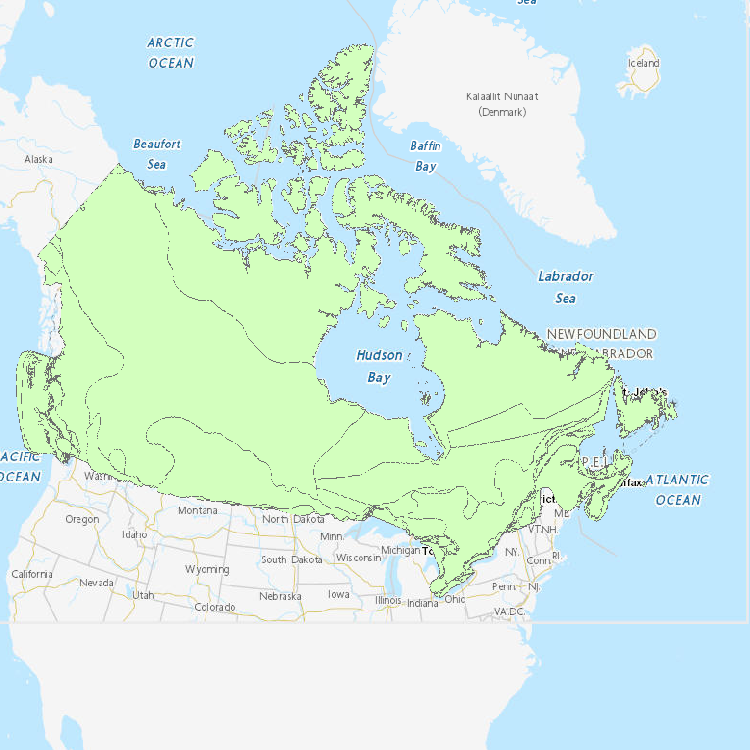
The Canadian National Wetlands Inventory (CNWI) is a comprehensive publicly available national geodatabase developed by the Canadian Wildlife Services (CWS) of Environment and Climate Change Canada (ECCC), in collaboration with federal, provincial, territorial, academia, indigenous groups and Non-governmental organizations (NGOs). It consists of the best available wetland mapping and ground-truth data, along with its metadata, published in a standardized manner. Over time, not only existing data being complied but also new high-resolution data will be acquired to fill priority gaps in coverage, with an emphasis on peatlands and coastal wetlands. ECCC plans to use the CNWI to train and validate machine-learning algorithms to delineate and classify wetlands at a national scale and measure trends over time. This will support Canada’s Nature-Based Climate Solutions by informing biodiversity conservation, climate change mitigation and adaptation, and reporting on greenhouse gas (GHG) emission reduction. In 2022-2023, CWS selected 30 candidate datasets to include in the CNWI, out of over 50 datasets where an initial assessment was completed. As of December 2023, the CNWI includes 13 source datasets as depicted in Figure 1, gathered from seven provinces/territories (BC, NB, NS, PEI, ON, QC, YK), which comprise approximately 4.1 million wetland polygon features and covers approximately 40 million hectares. The source datasets are available by province/territory. These source datasets were cross-walked into a standardized CNWI Classification Schema, which was built on two foundational documents: the Canadian Wetland Classification System (National Wetlands Working Group, 1997) and Canadian Wetland Inventory (Data Model, 2016). The CNWI Schema contains five major wetland classes: Bog, Fen, Swamp, Marsh, Shallow / Open Water, and eight subclasses: Rich Fen, Poor Fen, Organic Swamp, Mineral Swamp, Organic Marsh, Mineral Marsh, Shallow Water, and Open Water. Non-conforming wetlands can be categorized into three groups: Peatland, Mixed, and Unclassified. For more information on the CNWI and related database, please refer to the CNWI User Manual and other supporting documents that accompanies this publication.
-
This index identifies project areas on provincial highways where aerial photography and photogrammetric mapping has been collected.
-
This entry provides access to the figures and data tables that feature in the CSAS Research Document titled 'Optical, chemical, and biological oceanographic conditions on the Scotian Shelf and in the eastern Gulf of Maine in 2015'. Please consult the meta-data text file that accompanies the zip file download for the figure on the data usage policy and appropriate citation. The meta-data file also provides field descriptors and any other information that may be useful in interpreting the data provided in relation to the accompanying imagery. Abstract: As warm and variable ocean conditions persisted in the Maritimes Region in 2015, there was increasing evidence of a shift in both phytoplankton and zooplankton communities away from the dominance of large phytoplankton and copepods toward smaller phytoplankton and copepod species. Although deep-water nitrate inventories were mainly higher than average in 2015, deep silicate and phosphate inventories were lower than average on the Scotian Shelf for the third year in a row. The spring bloom started later than normal and was weaker in magnitude and shorter in duration than usual. Phytoplankton biomass anomalies were mixed across the Shelf, but the abundance of large phytoplankton, particularly diatoms, was lower than average, continuing a pattern started in 2009. The abundance of the biomass-dominant copepod species Calanus finmarchicus and zooplankton biomass overall were lower than average overall in 2015, as was the abundance of Arctic Calanus species, continuing a pattern started during the last 4-7 years. In contrast, the abundances of offshore copepods were higher than average. Changes in phytoplankton and zooplankton communities observed in recent years indicate poor feeding conditions for planktivorous fish, birds, and mammals. Continuous Plankton Recorder sampling, the reporting of which lags Atlantic Zone Monitoring Program sampling by one year, indicated that in 2014 the spring phytoplankton bloom occurred earlier and was of shorter duration than normal over the entire Scotian Shelf and that the springtime peaks in abundance of the dominant zooplankton taxa Calanus I-IV and C. finmarchicus V-VI were also relatively early and relatively short-lived. 2014 annual abundance anomalies were unusually high for hyperiid amphipods and foraminifera over the entire Scotian Shelf in 2014, and unusually low for euphausiids. Annual abundance anomalies for most other taxa were at near normal levels on the western Scotian Shelf and below normal levels on the eastern Scotian Shelf. http://www.dfo-mpo.gc.ca/csas-sccs/Publications/ResDocs-DocRech/2017/2017_012-eng.html
-
Geographic information for Ontario Health (OH) Regions, and Home and Community Care Support Services (HCCSS) boundaries. The HCCSS boundary file is maintained by Statistics Canada. A link is provided to the Statistics Canada website where you can download the HCCSS boundary file in a variety of formats. Data includes: * Ontario Health Region boundaries * HCCSS boundaries * LHIN office locations (historical)
-
Geographic Information System (GIS) data with the following mapping layers from the Greenbelt Plan: * outer boundaries * protected countryside and urban river valley designations * specialty crop areas (Niagara tender fruit, grape area and Holland Marsh) * settlement areas (towns, villages and hamlets) * river valley connections. The data also contains associated policy designation mapping.
-
A database of verified tornado occurrences across Canada has been created covering the 30-year period from 1980 to 2009. The tornado data have undergone a number of quality control checks and represent the most current knowledge of past tornado events over the period. However, updates may be made to the database as new or more accurate information becomes available. The data have been converted to a geo-referenced mapping file that can be viewed and manipulated using GIS software.
-
This data set includes the locations of all known seabird colonies along the coast of British Columbia, and provides a compilation of the population estimates of seabirds breeding at those colonies since 1980, and historical estimates prior to 1980 for some colonies. It does not include an estimate of the numbers of juvenile birds or non-breeders in the population. The rationale for developing this inventory was the recognized need for a product that could assist with: coastal zone and conservation area planning; emergency response to environmental emergencies and identifying areas of potential interactions between seabirds and anthropogenic activities. In addition, the data used to develop the document provides a baseline to compare with future seabird population estimates in order to measure the impacts of shifts in composition, abundance and/or distribution of prey, and climatic and oceanographic changes. The database is not a substitute for on-site surveys usually required for environmental assessment. Here we present data on the breeding colony population estimates of the 15 species of seabirds (including two storm petrels, three cormorants, one gull and nine alcids) and one shorebird (Black Oystercatcher Haematopus bachmani) that breed on the coast of British Columbia. Over 5.5 million colonial birds are currently estimated to nest at 627 sites, based on surveys primarily conducted in the 1980’s. Five species (Cassin's Auklets Ptychoramphus aleuticus, Fork-tailed Storm-petrels Oceanodroma furcata, Leach's Storm-petrels Oceanodroma leucorhoa, Rhinoceros Auklets Cerorhinca monocerata, and Ancient Murrelets Synthliboramphus antiquus) comprise the vast majority of that population, although Glaucous-winged Gulls (Larus glaucescens) and Pigeon Guillemots (Cepphus columba) nest at the most sites. Marbled Murrelets (Brachyramphus marmoratus), which nest on the mossy limbs of mature and old-growth trees within the coastal forests, are not included in this database, due to their dispersed nesting habit. The population estimates presented in this database are compiled from the results of several surveys. Many of the seabird breeding colonies in British Columbia have been known for more than 50 years, but because of the remoteness of the sites, visits to them have been rare. The majority of the data are the results of a comprehensive inventory of colonial nesting seabirds along the British Columbia coastline conducted between 1980 and 1989 by the Canadian Wildlife Service of Environment and Climate Change Canada. The goal of that program was to establish baseline estimates of breeding seabird populations in BC using standardized survey techniques to allow future comparisons and monitoring of those populations. A few colonies on small remote islands were not visited during that survey. Therefore, for some colonies the most current population estimates are from the first complete survey of the BC coastline, carried out by the Royal British Columbia Museum in the mid 1970’s. That survey identified colony sites and provided rough assessments of the population sizes of breeding seabirds. Since 1989, surveys have been conducted on some alcid, cormorant and gull colonies along the BC coast, and results have been included in the dataset (data entry ongoing). As well as data from Canadian Wildlife Service surveys, we have attempted to obtain recent data from all other sources including Parks Canada, the Ministry of Forests, Lands, Natural Resource Operations and Rural Development, the Bamfield Marine Station and the Laskeek Bay Conservation Society. Since 2000, inventories of nesting Black Oystercatchers have been conducted in some regions of the coast by Parks Canada and partners (Gulf Islands National Park Reserve, Pacific Rim National Park Reserve, and Gwaii Haanas National Park Reserve) and results have been included in the dataset (data entry ongoing). A long time series of nesting Black Oystercatcher data collected by Laskeek Bay Conservation Society in the Laskeek Bay area of the East Coast of Moresby Island has also been included in this dataset.
-
Description: These commercial whale watching data are comprised of two datasets. First, the ‘whale_watching_trips_jun_sep_british_columbia’ data layer summarizes commercial whale watching trips that took place in 2019, 2020 and 2021 during the summer months (June to September). The second data layer, ‘wildlife_viewing_events_jun_sep_british_columbia’ contains estimated wildlife viewing events carried out by commercial whale watching vessels for the same years (2019, 2020 and 2021) and months (June to September). Commercial whale watching trips and wildlife viewing events are summarized using the same grid, and they can be related using the unique cell identifier field ‘cell_id’. The bulk of this work was carried out at University of Victoria and was funded by the Marine Environmental Observation, Prediction and Response (MEOPAR) Network under the ‘Whale watching AIS Vessel movement Evaluation’ or WAVE project (2018 – 2022). The aim of the WAVE project was to increase the understanding of whale watching activities in Canada’s Pacific region using vessel traffic data derived from AIS (Automatic Identification System). The work was finalized by DFO Science in the Pacific Region. These spatial data products of commercial whale watching operations can be used to inform Marine Spatial Planning, conservation planning activities, and threat assessments involving vessel activities in British Columbia. Methods: A list of commercial whale watching vessels based in British Columbia and Washington State and their corresponding MMSIs (Maritime Mobile Service Identity) was compiled from the whale watching companies and Marine Traffic (www.marinetraffic.com). This list was used to query cleaned CCG AIS data to extract AIS positions corresponding to commercial whale watching vessels. A commercial whale watching trip was defined as a set of consecutive AIS points belonging to the same vessel departing and ending in one of the previously identified whale watching home ports. A classification model (unsupervised Hidden Markov Model) using vessel speed as the main variable was developed to classify AIS vessel positions into wildlife-viewing and non wildlife viewing events. Commercial whale watching trips in the south and north-east of Vancouver Island were limited to a duration of minimum 1 hour and maximum 3.5 hours. For trips in the west coast of Vancouver island the maximum duration was set to 6 hours. Wildlife-viewing events duration was set to minimum of 10 minutes to a maximum of 1 hour duration. For more information on methodology, consult metadata pdf available with the Open Data record. References: Nesdoly, A. 2021. Modelling marine vessels engaged in wildlife-viewing behaviour using Automatic Identification Systems (AIS). Available from: https://dspace.library.uvic.ca/handle/1828/13300. Data Sources: Oceans Network Canada (ONC) provided encoded AIS data for years 2019, 2020 and 2021, within a bounding box including Vancouver Island and Puget Sound used to generate these products. This AIS data was in turn provided by the Canadian Coast Guard (CCG) via a licensing agreement between the CCG and ONC for the non-commercial use of CCG AIS Data. More information here: https://www.oceannetworks.ca/science/community-based-monitoring/marine-domain-awareness-program/ Molly Fraser provided marine mammal sightings data collected on board a whale watching vessels to develop wildlife-viewing events classification models. More information about this dataset here: https://www.sciencedirect.com/science/article/pii/S0308597X20306709?via%3Dihub Uncertainties: The main source of uncertainty is with the conversion of AIS point locations into track segments, specifically when the distance between positions is large (e.g., greater than 1000 meters).
-
A database of verified tornado occurrences across Canada has been created covering the 30-year period from 1980 to 2009. The tornado data have undergone a number of quality control checks and represent the most current knowledge of past tornado events over the period. However, updates may be made to the database as new or more accurate information becomes available. The data have been converted to a geo-referenced mapping file that can be viewed and manipulated using GIS software.
-
A borehole is a general term for any narrow shaft drilled in the ground, either vertically or horizontally. A borehole may be constructed for many different purposes, including: * extraction of water or fluid (e.g., oil) or gases (e.g., natural gas or methane) * for a geotechnical investigation * for an environmental site assessment * for mineral exploration * as a pilot hole for installing piers or underground utilities This data contains a continuous log of strata for each borehole as well as for geocolumns. A geocolumn is a collection of information from an examination of exposed substrate, such as in a quarry wall or along a roadway passage.