 Arctic SDI catalogue
flood susceptibility
Type of resources
Available actions
Topics
Keywords
Contact for the resource
Provided by
Formats
Representation types
Update frequencies
status
-

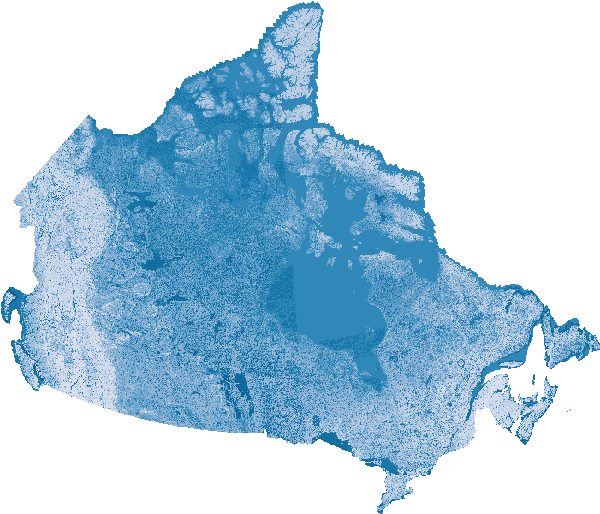
Flood Susceptibility Mapping is a national map series that shows how likely different areas in Canada are to experience flooding. This updated version improves on an earlier one-time map by incorporating yearly and seasonal data, along with a larger set of known flood locations used for model training. These enhancements make it possible to assess how flood susceptibility varies from year to year, identify long-term trends, and detect years that were unusually wet or dry. The system integrates a wide range of information, including land characteristics such as elevation, soil type, land cover, and vegetation, as well as seasonal weather variables such as rainfall and temperature. It also incorporates geographic context so the model can better capture spatial patterns. Several artificial intelligence (AI) models were evaluated, and the XGBoost algorithm was selected for its accuracy and reliability. The model was further calibrated so that the probabilities it produces better align with real-world conditions, with notable improvements in areas where flood susceptibility is moderate. To characterize uncertainty, the model was repeatedly tested using slightly different samples of the data. Annual flood susceptibility maps are available for the years 2000 to 2023, along with some maps that show possible future climate conditions. Using the yearly maps, “wet” and “dry” scores can be calculated for each watershed (drainage area) in Canada, and changes in flood susceptibility over time were assessed. Across the country, the number of areas showing higher wet conditions has generally increased. Many of the most significant changes occurred between 2009 and 2020, with 2017 emerging as a frequent turning point. This collection contains: - **[Historic](https://open.canada.ca/data/en/dataset/ea1384df-bf4a-4743-97bb-870dc43f8d77)** yearly maps (2000–2023) showing the calibrated probability of flood susceptibility. - **[Future](https://open.canada.ca/data/en/dataset/c00f95a3-7bab-4d28-b9cc-b30f06b5afd2)** climate scenarios of flood susceptibility. - A variety of **[decision ready maps](https://open.canada.ca/data/en/dataset/3202e0a0-0afb-4120-b102-b0c41f0fb9eb)**, showing trends of increasing or decreasing flood susceptibility, (processed by NHN Work Unit), extreme wet and dry years and a 'flood envelope' and probable present day flood susceptibility. Future development plans include extending the maps back to 1980 and examining how flood susceptibility may change under future climate scenarios. Overall, this dataset provides a consistent, Canada-wide view of where and when flood susceptibility has changed over the past two decades. It is intended for analyzing patterns and trends at regional and national scales, rather than predicting flooding at individual properties or supporting engineering or building design decisions.
-
This series of projected future flood susceptibility maps were generated using an XGBoost machine learning model trained on major floods from 2005 to 2023. The trained model was applied to future climate scenarios for 2050, 2070, and 2100, under two SSP scenarios: 245 and 585. The model uses temperature and precipitation time series to estimate potential future flood susceptibility. These maps represent model projections and should be interpreted as indicators of potential flood susceptibility, not precise forecasts. This dataset forms part of a broader collection of flood susceptibility datasets, offering related information and analyses. The collection includes an overview page with associated publications, historic susceptibility values, temporal trends, and future projections. - [Collection – Flood Susceptibility Mapping]( https://open.canada.ca/data/en/dataset/1074f781-85d3-4c86-86cb-fd1c339197dc) - [Historic - Flood Susceptibility Mapping]( https://open.canada.ca/data/en/dataset/ea1384df-bf4a-4743-97bb-870dc43f8d77) - [Trends and Extremes – Flood Susceptibility Mapping]( https://open.canada.ca/data/en/dataset/3202e0a0-0afb-4120-b102-b0c41f0fb9eb)
-
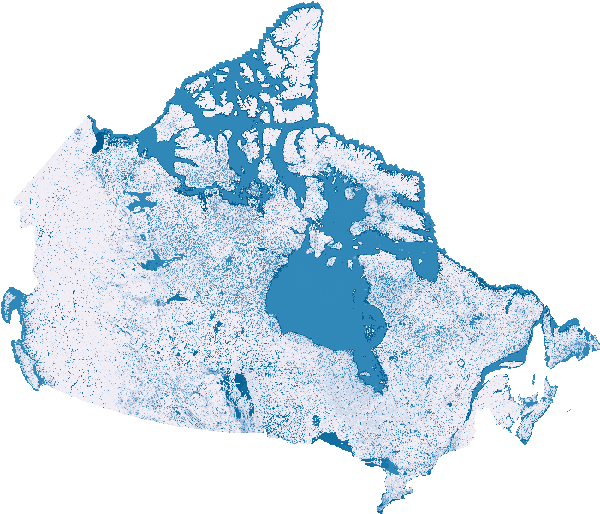
This series of historic flood susceptibility maps comes from an XGBboost machine learning model trained on major floods from 2005 to 2023. The trained model is then run for each year from 2000 to 2023, including unique temporal characteristics of temperature, precipitation, land use land cover and Normalized Difference Vegetation Index (NDVI), to predict the flood susceptibility of any given year. This dataset forms part of a broader collection of flood susceptibility datasets, offering related information and analyses. The collection includes an overview page with associated publications, historic susceptibility values, temporal trends, and future projections. - [Collection – Flood Susceptibility Mapping]( https://open.canada.ca/data/en/dataset/1074f781-85d3-4c86-86cb-fd1c339197dc) - [Trends and Extremes – Flood Susceptibility Mapping]( https://open.canada.ca/data/en/dataset/3202e0a0-0afb-4120-b102-b0c41f0fb9eb) - [Future - Flood Susceptibility Mapping]( https://open.canada.ca/data/en/dataset/c00f95a3-7bab-4d28-b9cc-b30f06b5afd2)
-
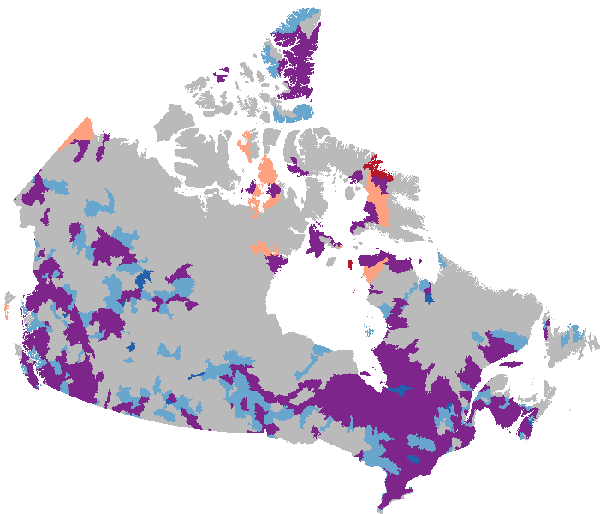
This collection of flood susceptibility products captures temporal patterns of historic flood events from 2000 to 2023, derived from flood susceptibility maps. The layers are designed to support decision-making by providing easily interpretable information for planning, screening, and other management purposes. This collection contains several datasets which explore the suite of rasters from 2000 to 2023: - Extreme wet and extreme dry years and the associated average flood susceptibility, processed by NHN WU, as found by Generalized Extreme Value (GEV) analysis - Flood susceptibility envelope, which is derived from the above wet and dry years - Trend slope, for each pixel the value for each year is extracted and the linear trend is computed, greater than 1000 is increasing flood susceptibility and below 1000 is decreasing flood susceptibility. - Trend Class, as identified by wet and dry scores, applied to NHN WU - Current flood susceptibility, which represents the estimated average value of present-day flood susceptibility - Current interquartile range, which provides and indication of the temporal variability of a given pixel under the current regime. This dataset forms part of a broader collection of flood susceptibility datasets, offering related information and analyses. The collection includes an overview page with associated publications, historic susceptibility values, temporal trends, and future projections. - **[Collection - Flood Susceptibility Mapping](https://open.canada.ca/data/en/dataset/1074f781-85d3-4c86-86cb-fd1c339197dc)** - **[Historic - Flood Susceptibility Mapping](https://open.canada.ca/data/en/dataset/ea1384df-bf4a-4743-97bb-870dc43f8d77)** - **[Future - Flood Susceptibility Mapping](https://open.canada.ca/data/en/dataset/c00f95a3-7bab-4d28-b9cc-b30f06b5afd2)**