 Arctic SDI catalogue
COG
Type of resources
Categories
Available actions
Topics
Keywords
Contact for the resource
Provided by
Formats
Representation types
Update frequencies
status
-
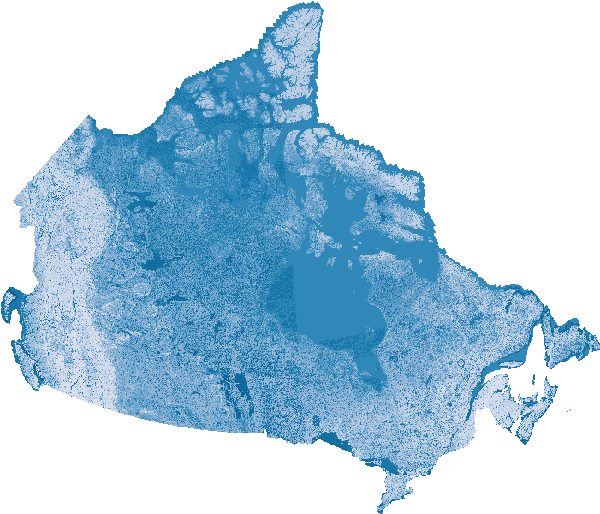
This series of projected future flood susceptibility maps were generated using an XGBoost machine learning model trained on major floods from 2005 to 2023. The trained model was applied to future climate scenarios for 2050, 2070, and 2100, under two SSP scenarios: 245 and 585. The model uses temperature and precipitation time series to estimate potential future flood susceptibility. These maps represent model projections and should be interpreted as indicators of potential flood susceptibility, not precise forecasts. This dataset forms part of a broader collection of flood susceptibility datasets, offering related information and analyses. The collection includes an overview page with associated publications, historic susceptibility values, temporal trends, and future projections. - [Collection – Flood Susceptibility Mapping]( https://open.canada.ca/data/en/dataset/1074f781-85d3-4c86-86cb-fd1c339197dc) - [Historic - Flood Susceptibility Mapping]( https://open.canada.ca/data/en/dataset/ea1384df-bf4a-4743-97bb-870dc43f8d77) - [Trends and Extremes – Flood Susceptibility Mapping]( https://open.canada.ca/data/en/dataset/3202e0a0-0afb-4120-b102-b0c41f0fb9eb)
-
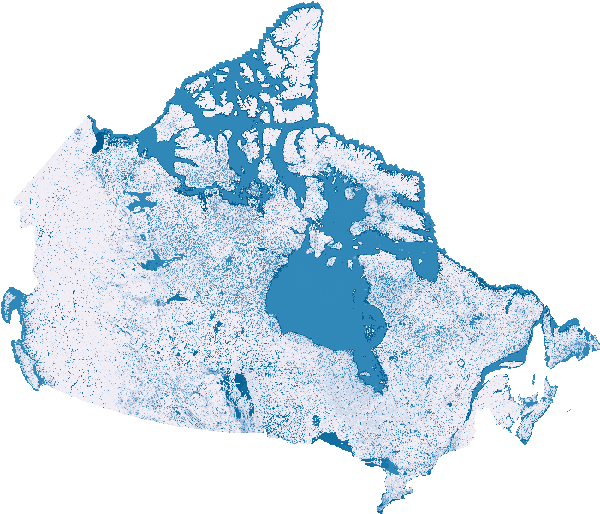
This series of historic flood susceptibility maps comes from an XGBboost machine learning model trained on major floods from 2005 to 2023. The trained model is then run for each year from 2000 to 2023, including unique temporal characteristics of temperature, precipitation, land use land cover and Normalized Difference Vegetation Index (NDVI), to predict the flood susceptibility of any given year. This dataset forms part of a broader collection of flood susceptibility datasets, offering related information and analyses. The collection includes an overview page with associated publications, historic susceptibility values, temporal trends, and future projections. - [Collection – Flood Susceptibility Mapping]( https://open.canada.ca/data/en/dataset/1074f781-85d3-4c86-86cb-fd1c339197dc) - [Trends and Extremes – Flood Susceptibility Mapping]( https://open.canada.ca/data/en/dataset/3202e0a0-0afb-4120-b102-b0c41f0fb9eb) - [Future - Flood Susceptibility Mapping]( https://open.canada.ca/data/en/dataset/c00f95a3-7bab-4d28-b9cc-b30f06b5afd2)
-

The MODIS Surface Albedo and Surface Reflectance Dataset (or simply Albedo) includes times series of 10-day composite products derived at 250-m spatial resolution over Canadian territory and neighboring areas produced at the Canada Centre for Remote Sensing (CCRS) since February 2000.The datasets contain spectral and broadband reflectance’s and albedo for MODIS bands B1-B7 designed primarily for land applications. The imagery for all spectral bands was downscaled and re-projected into the Lambert Conformal Conic (LCC) projection at 250-m spatial resolution. The area size is 5,700 km × 4,800 km. The specialized MODIS processing system was developed at CCRS to fully utilize the high quality of MODIS L2 swath imagery over the northern latitudes. As such, the CCRS Albedo product is different from the standard NASA product. The differences are related to temporal and spatial scaling, shape of kernel functions employed to fit data, as well as details of scene identification, atmospheric correction, and data fitting methodology. The data is hosted on AWS; users can follow the tutorial (https://github.com/OpsCCRS/AWS-Open-Data-Registry-Preparation/blob/main/CCRSMODISAlbedo/get-to-know-adataset-CCRSMODISAlbedo.ipynb) to access the data or via the URL in Data Resources for each year.
-
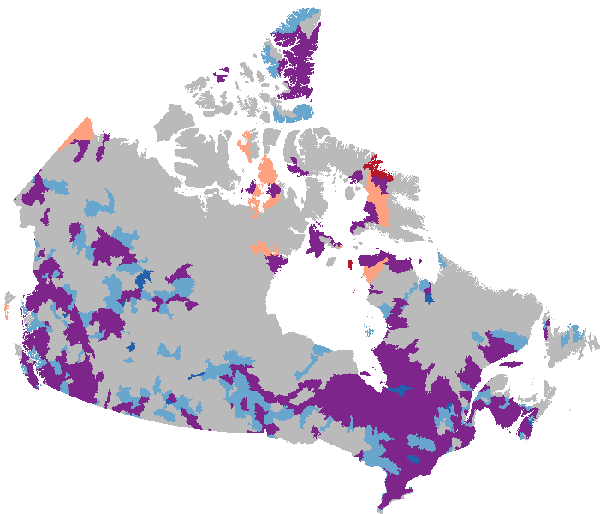
This collection of flood susceptibility products captures temporal patterns of historic flood events from 2000 to 2023, derived from flood susceptibility maps. The layers are designed to support decision-making by providing easily interpretable information for planning, screening, and other management purposes. This collection contains several datasets which explore the suite of rasters from 2000 to 2023: - Extreme wet and extreme dry years and the associated average flood susceptibility, processed by NHN WU, as found by Generalized Extreme Value (GEV) analysis - Flood susceptibility envelope, which is derived from the above wet and dry years - Trend slope, for each pixel the value for each year is extracted and the linear trend is computed, greater than 1000 is increasing flood susceptibility and below 1000 is decreasing flood susceptibility. - Trend Class, as identified by wet and dry scores, applied to NHN WU - Current flood susceptibility, which represents the estimated average value of present-day flood susceptibility - Current interquartile range, which provides and indication of the temporal variability of a given pixel under the current regime. This dataset forms part of a broader collection of flood susceptibility datasets, offering related information and analyses. The collection includes an overview page with associated publications, historic susceptibility values, temporal trends, and future projections. - **[Collection - Flood Susceptibility Mapping](https://open.canada.ca/data/en/dataset/1074f781-85d3-4c86-86cb-fd1c339197dc)** - **[Historic - Flood Susceptibility Mapping](https://open.canada.ca/data/en/dataset/ea1384df-bf4a-4743-97bb-870dc43f8d77)** - **[Future - Flood Susceptibility Mapping](https://open.canada.ca/data/en/dataset/c00f95a3-7bab-4d28-b9cc-b30f06b5afd2)**
-
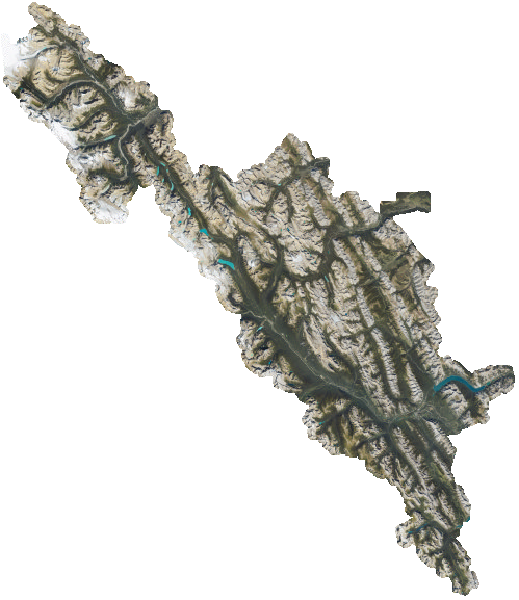
This 15 cm RGB-NIR aerial orthophoto imagery was collected on August 21–23, 2025. It covers the full extent of Banff National Park, Ya Ha Tinda Ranch, and a 1 km buffer surrounding these areas.
-

The Canadian long term satellite data record (LTDR) derived from 1-km resolution Advanced Very High Resolution Radiometer (AVHRR) data was produced by the Canada Center for Remote Sensing (CCRS). Processing included: geolocation, calibration, and compositing using Earth Observation Data Manager (Latifovic et al. 2005), cloud screening (Khlopenkov and Trishchenko, 2006), BRDF correction (Latifovic et. al., 2003), atmosphere and other corrections as described in Cihlar et. al. (2004). For temporal analysis of vegetation cross-sensor correction of Latifovic et al. (2012) is advised. Data collected by the AVHRR instrument on board the National Oceanic and Atmospheric Administration (NOAA) 9,11,14,16,17,18 and 19 satellites were used to generate Canada-wide 1-km 10-day AVHRR composites. Data are available starting in 1985. It is important to note that there are three types of AVHRR sensors: (i) AVHRR-1 flown onboard TIROS-N, NOAA-6, NOAA-8, and NOAA-10; (ii) AVHRR-2 flown onboard NOAA-7, NOAA-9, NOAA-11, NOAA-12, and NOAA-14; and (iii) AVHRR-3 currently operational onboard NOAA-15, NOAA-16, NOAA-17, NOAA-18 and NOAA-19. The AVHRR-1 has four channels, AVHRR-2 has five channels and the AVHRR-3 has six channels, although only five channels of AVHRR-3 can be operational at any one time. As such, channels 3A (1.6 m) and 3B (3.7 m) work interchangeably. The processing procedure was designed to minimize artefacts in AVHRR composite images. There are thirty six 10-day image composites per year. The following three processing levels are provided: P1) top of atmosphere reflectance and brightness temperature, P2) reflectance at surface and surface temperature and P3) reflectance at surface normalized to a common viewing geometry (BRDF normalization). The processing level P1 and P2 are provided for all 36 composites while level P3 is provided for 21 composites from April – October.
-

Landsat Thematic Mapper (TM) and Enhanced Thematic Mapper (ETM+) sensors were used to generate the circa 2010 Mosaic of Canada at 30 m spatial resolution. All scenes were processed to Standard Terrain Correction Level 1T by the United States Geological Survey (USGS). Further processing performed by the Canada Centre for Remote Sensing included conversion of sensor measurements to top of atmosphere reflectance, cloud and cloud shadow detection, re-projection, selection of best measurements, mosaic generation ,noise removal and quality control. To provide a clear sky measurement for each location in Canada, data from the years 2009, 2010, and 2011 were used, but 2010 was preferentially selected. Bands 3 (0.63-0.69 µm), 4 (0.76-0.90 µm), 5 (1.55-1.75 µm), and 7 (2.08-2.35 µm) are provided in this version as significant atmosphere effects strongly limit the quality of the blue (0.45-0.52 µm) and green (0.52-0.60 µm) bands. Multi-criteria compositing was used for the selection of the most representative pixel. For ETM+ onboard Landsat 7 a scan line malfunction caused missing lines of data in all scenes collected after May 2003. Atmosphere and target variability between scenes cause these lines to have significant radiometric differences in some cases. A Fourier transformation approach was applied to correct this occurrence. This mosaic was developed for land cover and biophysical mapping applications across Canada. Other applications of these data are also possible, but should consider the temporal and spectral limitations of the product.
-

The Government of Canada acquired a national image coverage from the Systeme Pour l'Observation de la Terre (SPOT 4 - 5) satellites that includes four multispectral bands in the visible to shortwave infrared region at 20m spatial resolution. Five years from 2005 - 2010 were necessary to image all of Canada under clear-sky conditions, while acquisition anniversary dates were less important provided the data were imaged during the snow-free period. These data were downloaded from the GeoBase Orthoimage 2005 - 2010 dataset (http://www.geobase.ca/geobase/en/data/imagery/imr/description.html) and used to map 2005 - 2010 land cover south of treeline. Northern Canada has not currently been remapped since circa 2000 due to technical challenges associated with land cover variability and image acquisition dates relative to short summers. This land cover product includes 16 generic classes based on plant functional and a minimum mapping unit of 20m. Radiometric normalization was applied to balance images acquired near mid-summer during the 'peak-of-season' temporal window. The combined Enhancement and Classification by Progressive Generalization methods were used to classify large-area balanced mosaics over twenty mapping zones. Image interpretation was guided using high resolution imagery and other content in Google Earth. Knowledge of land cover spectral signatures, field experience and published reports were also used to assist interpretation in many regions. Remaining images acquired outside the peak-of-season window in early spring or late fall were subsequently classified using decision trees trained on data from overlapping classified peak-of-season images. Accuracy was assessed using ground truth data acquired during several field campaigns conducted with other government departments such as Parks Canada and the Geological Survey. This sample was enhanced using points interpreted in Google Earth as described above to provide a more even spatial coverage of Canada. Overall accuracy assessed at 71% using 1566 reference points, more than half of which were acquired in the field. When assessed using only land cover that was homogeneous within 3 by 3 pixels to account for potential geolocation errors, accuracy increased to 85% for 349 points that were biased towards easily classified classes such as water.
-

Data include a collection of annual land cover maps derived from MODIS 250 m spatial resolution remotely sensed imagery for the period 2000 to 2011. Processing of the time series was designed to reduce the occurrence of false change between maps. The method was based on change updating as described in Pouliot et al. (2011, 2013). Change detection accounted for both abrupt changes such as forest harvesting and more gradual changes such as recurrent insect defoliation. To determine the new label for a pixel identified as change, an evidential reasoning approach was used to combine spectral and contextual information. The 2005 MODIS land cover of Canada at 250 m spatial resolution described in Latifovic et al. (2012) was used as the base map. It contains 39 land cover classes, which for time series development was considered too detailed and was reduced to 25 and 19 class versions. The 19 class version corresponds to the North America Land Change Monitoring System (NALCMS) Level 2 legend as described in Latifovic et al. (2012). Accuracy assessment of time series is difficult due to the need to assess many maps. For areas of change in the time series accuracy was found to be 70% based on the 19 class thematic legend. This time series captures the spatial distribution of dominant land cover transitions. It is intended for use in modeling, development of remote sensing products such as leaf area index or land cover based albedo retrievals, and other exploratory analysis. It is not appropriate for use in any rigorous reporting or inventory assessments due to the accuracy of the land cover classification and uncertainty as to the capture of all relevant changes for an application. NOTE: To see this entire product in the map viewer, use a base map in the "World" section (EPSG: 3857).
-

This dataset corresponds to daily snow cover percentage at 1km resolution grid over land areas of Canada from 2006-2010. The data are subsampled by 4km to reduce data volumes and considering the geolocation uncertainty of the input satellite imagery. The daily maps are generated by assimilation of daily cloud screened NOAA AVHRR satellite imagery and Canadian Meteorological Centre (CMC) snow depth analysis snow depth and density fields within an off-line version of the CMC daily snow depth model. The snow depth model is modified to include snowpack reflectance model and a surface radiative transfer scheme that relates vegetation and snowpack reflectance to top-of-canopy bi-directional reflectance. A logistic vegetation phenology model is used to parameterize temporal dynamics of canopy leaf area index. A per-pixel particle filter with a 30 day moving window is applied to assimilation observations corresponding to 1km resolution visible band directional reflectance and normalized difference vegetation index and 24km CMC daily snow depth and monthly snow density fields. The assimilation is forced using daily air temperature and precipitation fields. Validation of the datasets has been performed by comparison to MODIS snow cover maps and in-situ snow depth stations across Canada. Validation suggests similar accuracy to MODIS snow cover products over relatively flat terrain.