 Arctic SDI catalogue
inlandWaters
Type of resources
Available actions
Topics
Keywords
Contact for the resource
Provided by
Years
Formats
Representation types
Update frequencies
status
Scale
Resolution
-

Hydrography (HY) Iceland is one of 12 themes in the European Location Project (ELF). The purpose of ELF is to create harmonised cross-border, cross-theme and cross-resolution pan-European reference data from national contributions. The goal is to provide INSPIRE-compliant data for Europe. A description of the ELF (European Location Project) is here: http://www.elfproject.eu/content/overview Encoding: INSPIRE version 4
-

Fisheries Information Summary System (FISS) layer of Historic (pre 2001) Fish Distribution Points of BC Streams. Points represent site locations where a fish species is rearing, spawning or observed or where a point is located at the mouth of a stream it indicates the presence of a fish species somewhere in the stream as a whole. Georeferenced to the stream centreline network layer of the 1:50,000 scale BC Watershed Atlas.
-
Normal Annual Runoff for 1961 - 1990, in mm
-
10 year peak flow isolines in cubic metres per second (m3/s) for 100 square kilometre watersheds and 10 year return period
-
Existing flood protection works appurtenances on or near dikes, for example, pump house, floodbox, culvert, gate, gauge, weir, etc. Updated from available Provincial dike survey project data from 2019/2020. If 2019/2020 dike survey project data is unavailable, appurtenance data based on previous data from 2004 and prior. May include periodic updates depending on data provided by Diking Authorities and other sources. See Data Source under selected appurtenance for details. For more information on dike management and safety, please see: https://www2.gov.bc.ca/gov/content/environment/air-land-water/water/drought-flooding-dikes-dams/integrated-flood-hazard-management/dike-management For contact names regarding regional diking issues, please see: https://www2.gov.bc.ca/assets/gov/environment/air-land-water/water/integrated-flood-hazard-mgmt/dike_safety_program_contact_list.pdf
-
Hydrographic Annotation based on the 1:50,000 scale Canadian National Topographic Series of Maps.
-
Winter limnologoy (mean oxygen) sites in the Cariboo Region
-
Stream Macro-Reaches delineated through interpretation of Topographic features from the 1:50,000 scale Canadian National Topographic Series of Maps.
-
BC active and discontinued hydrometric stations (surface water level and flow data) that are part of the provincial hydrometric network managed under a national program jointly administered under a federal-provincial cost-sharing agreement with Environment and Climate Change Canada (ECCC).
-
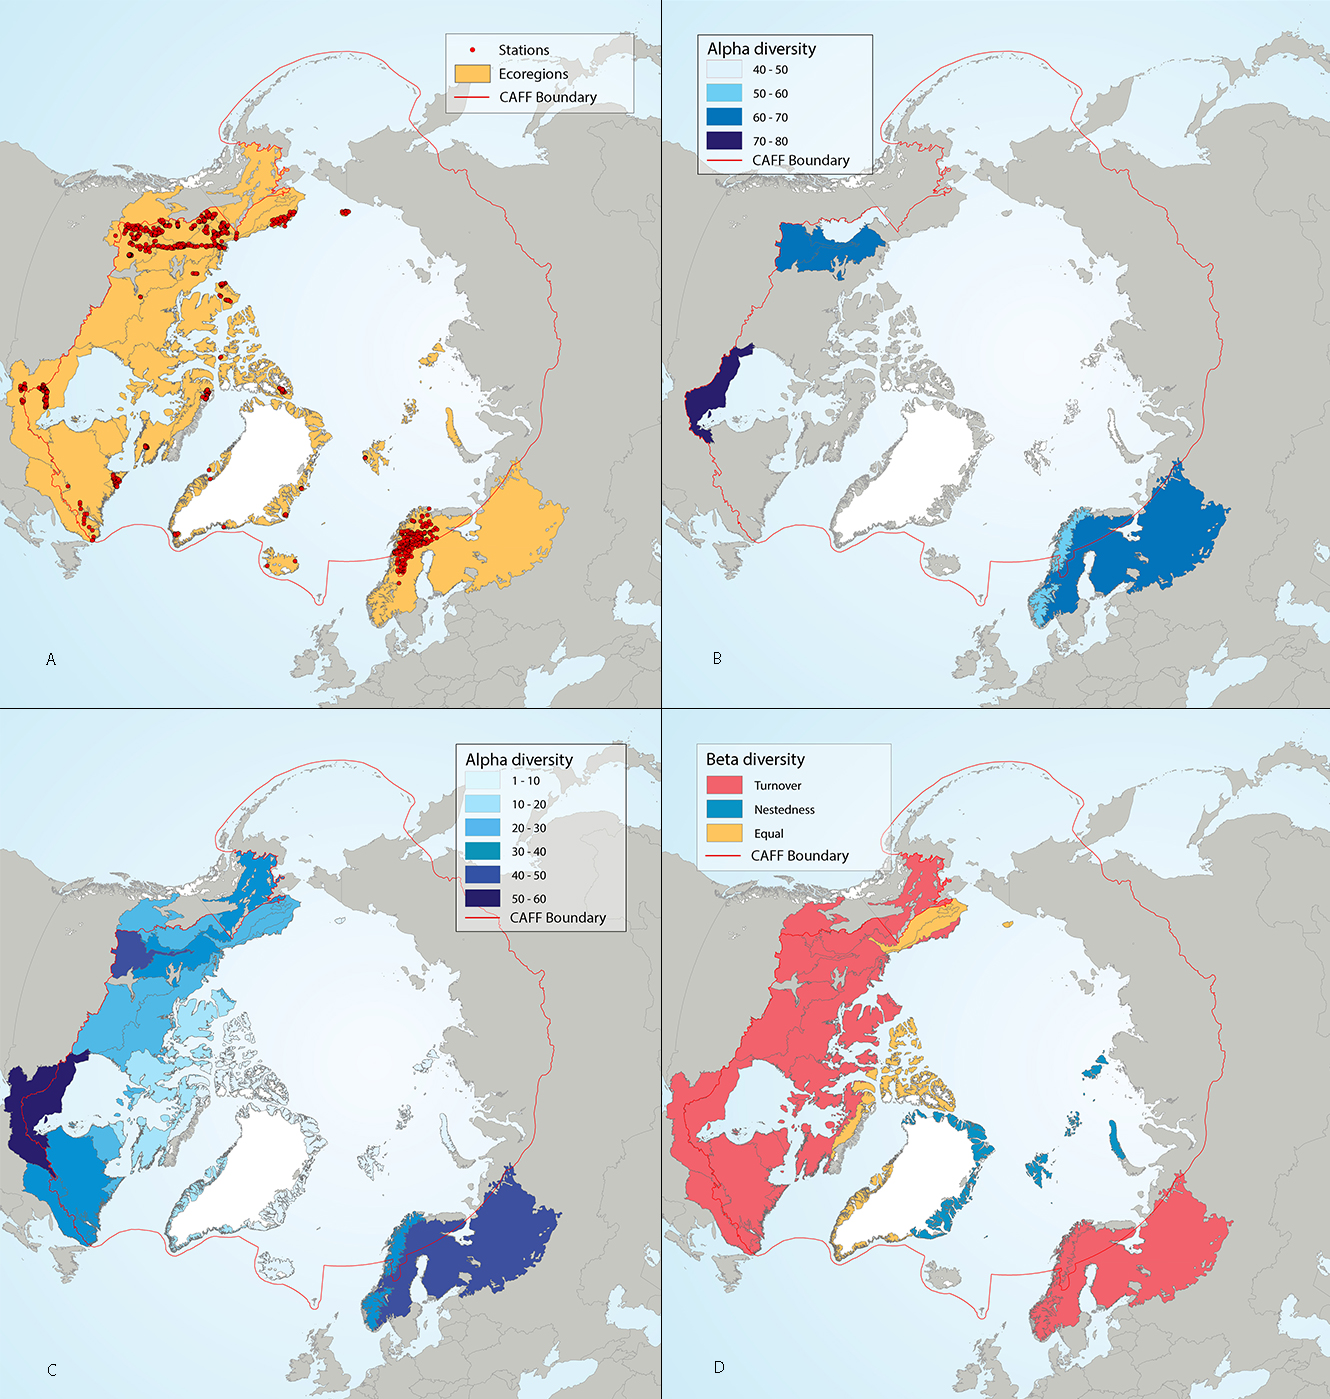
Results of circumpolar assessment of river benthic macroinvertebrates, indicating (a) the location of river benthic macroinvertebrate stations, underlain by circumpolar ecoregions; (b) ecoregions with many river benthic macroinvertebrate stations, colored on the basis of alpha diversity rarefied to 100 stations; (c) all ecoregions with river benthic macroinvertebrate stations, colored on the basis of alpha diversity rarefied to 10 stations; (d) ecoregions with at least two stations in a hydrobasin, colored on the basis of the dominant component of beta diversity (species turnover, nestedness, approximately equal contribution, or no diversity) when averaged across hydrobasins in each ecoregion. State of the Arctic Freshwater Biodiversity Report - Chapter 4 - Page 67 - Figure 4-30