Université Laval
Type of resources
Available actions
Topics
Keywords
Contact for the resource
Provided by
Years
Formats
Resolution
-
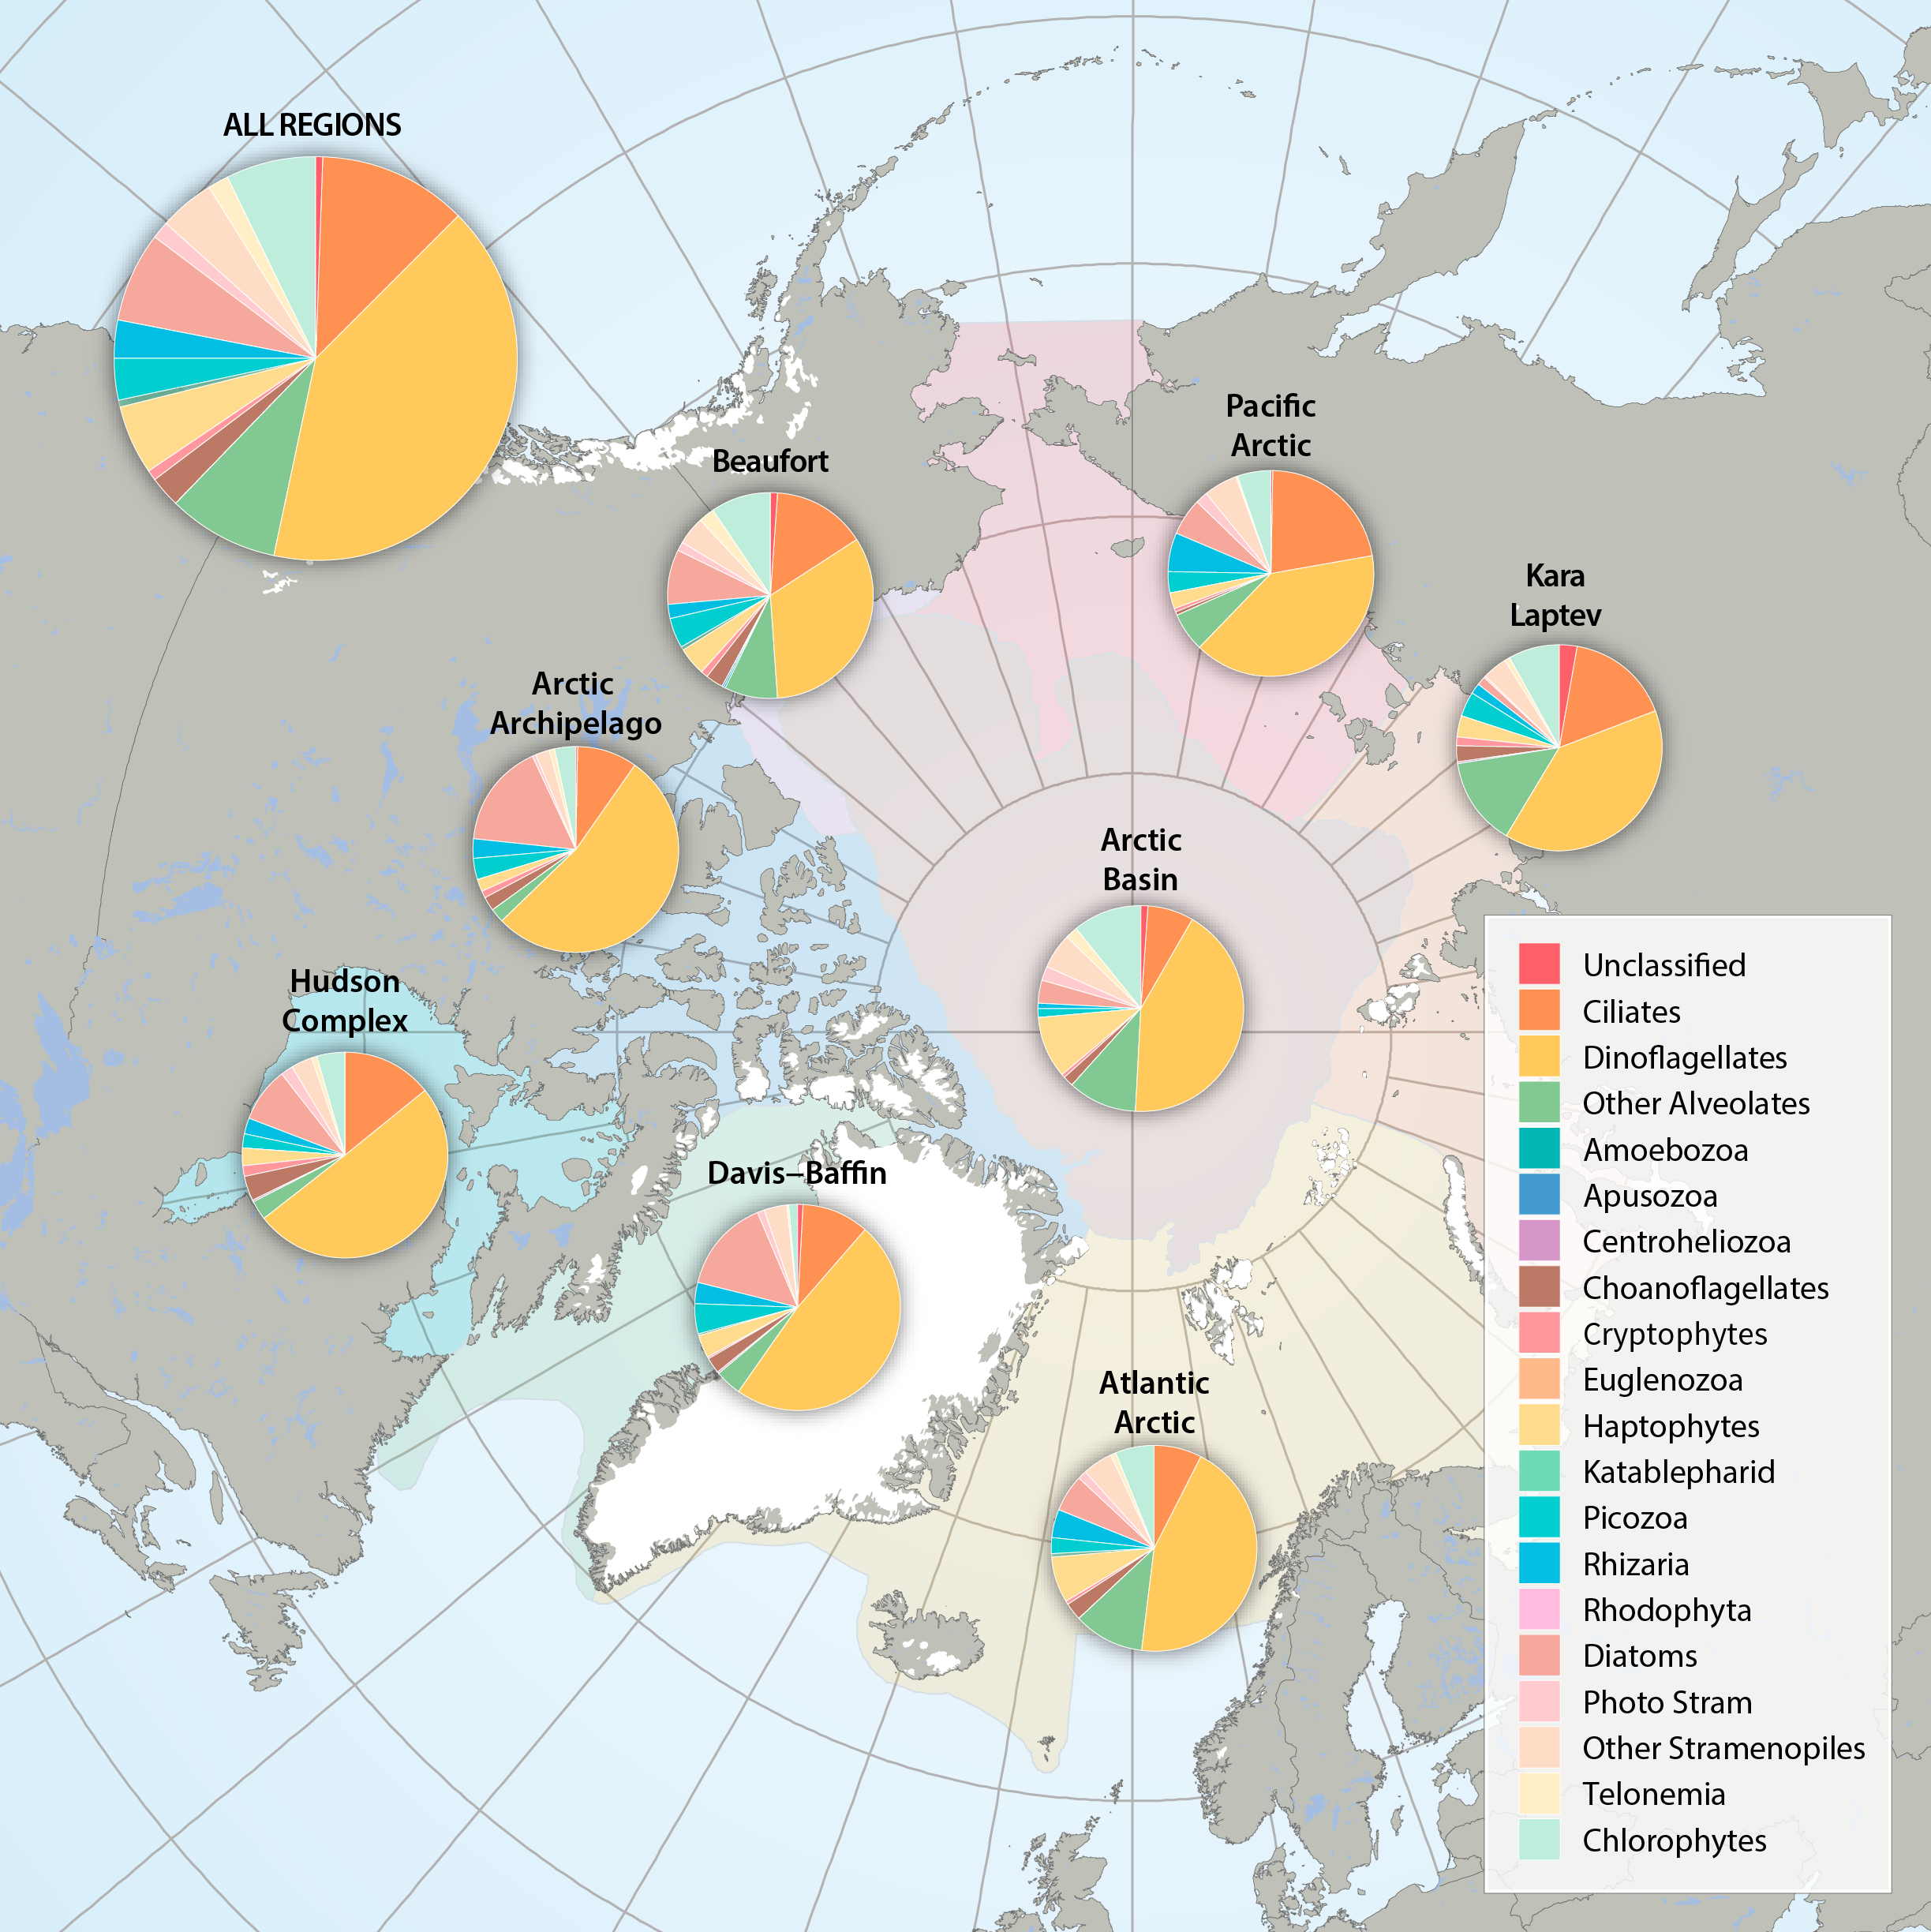
Figure 3.2.2a: Relative abundance of major eukaryote taxonomic groups found by high throughput sequencing of the small-subunit (18S) rRNA gene across Arctic Marine Areas. Figure 3.2.2b: Relative abundance of major eukaryote functional groups found by microscopy in the Arctic Marine Areas. STATE OF THE ARCTIC MARINE BIODIVERSITY REPORT - <a href="https://arcticbiodiversity.is/findings/plankton" target="_blank">Chapter 3</a> - Page 70 - Figures 3.2.2a and 3.2.2b
-
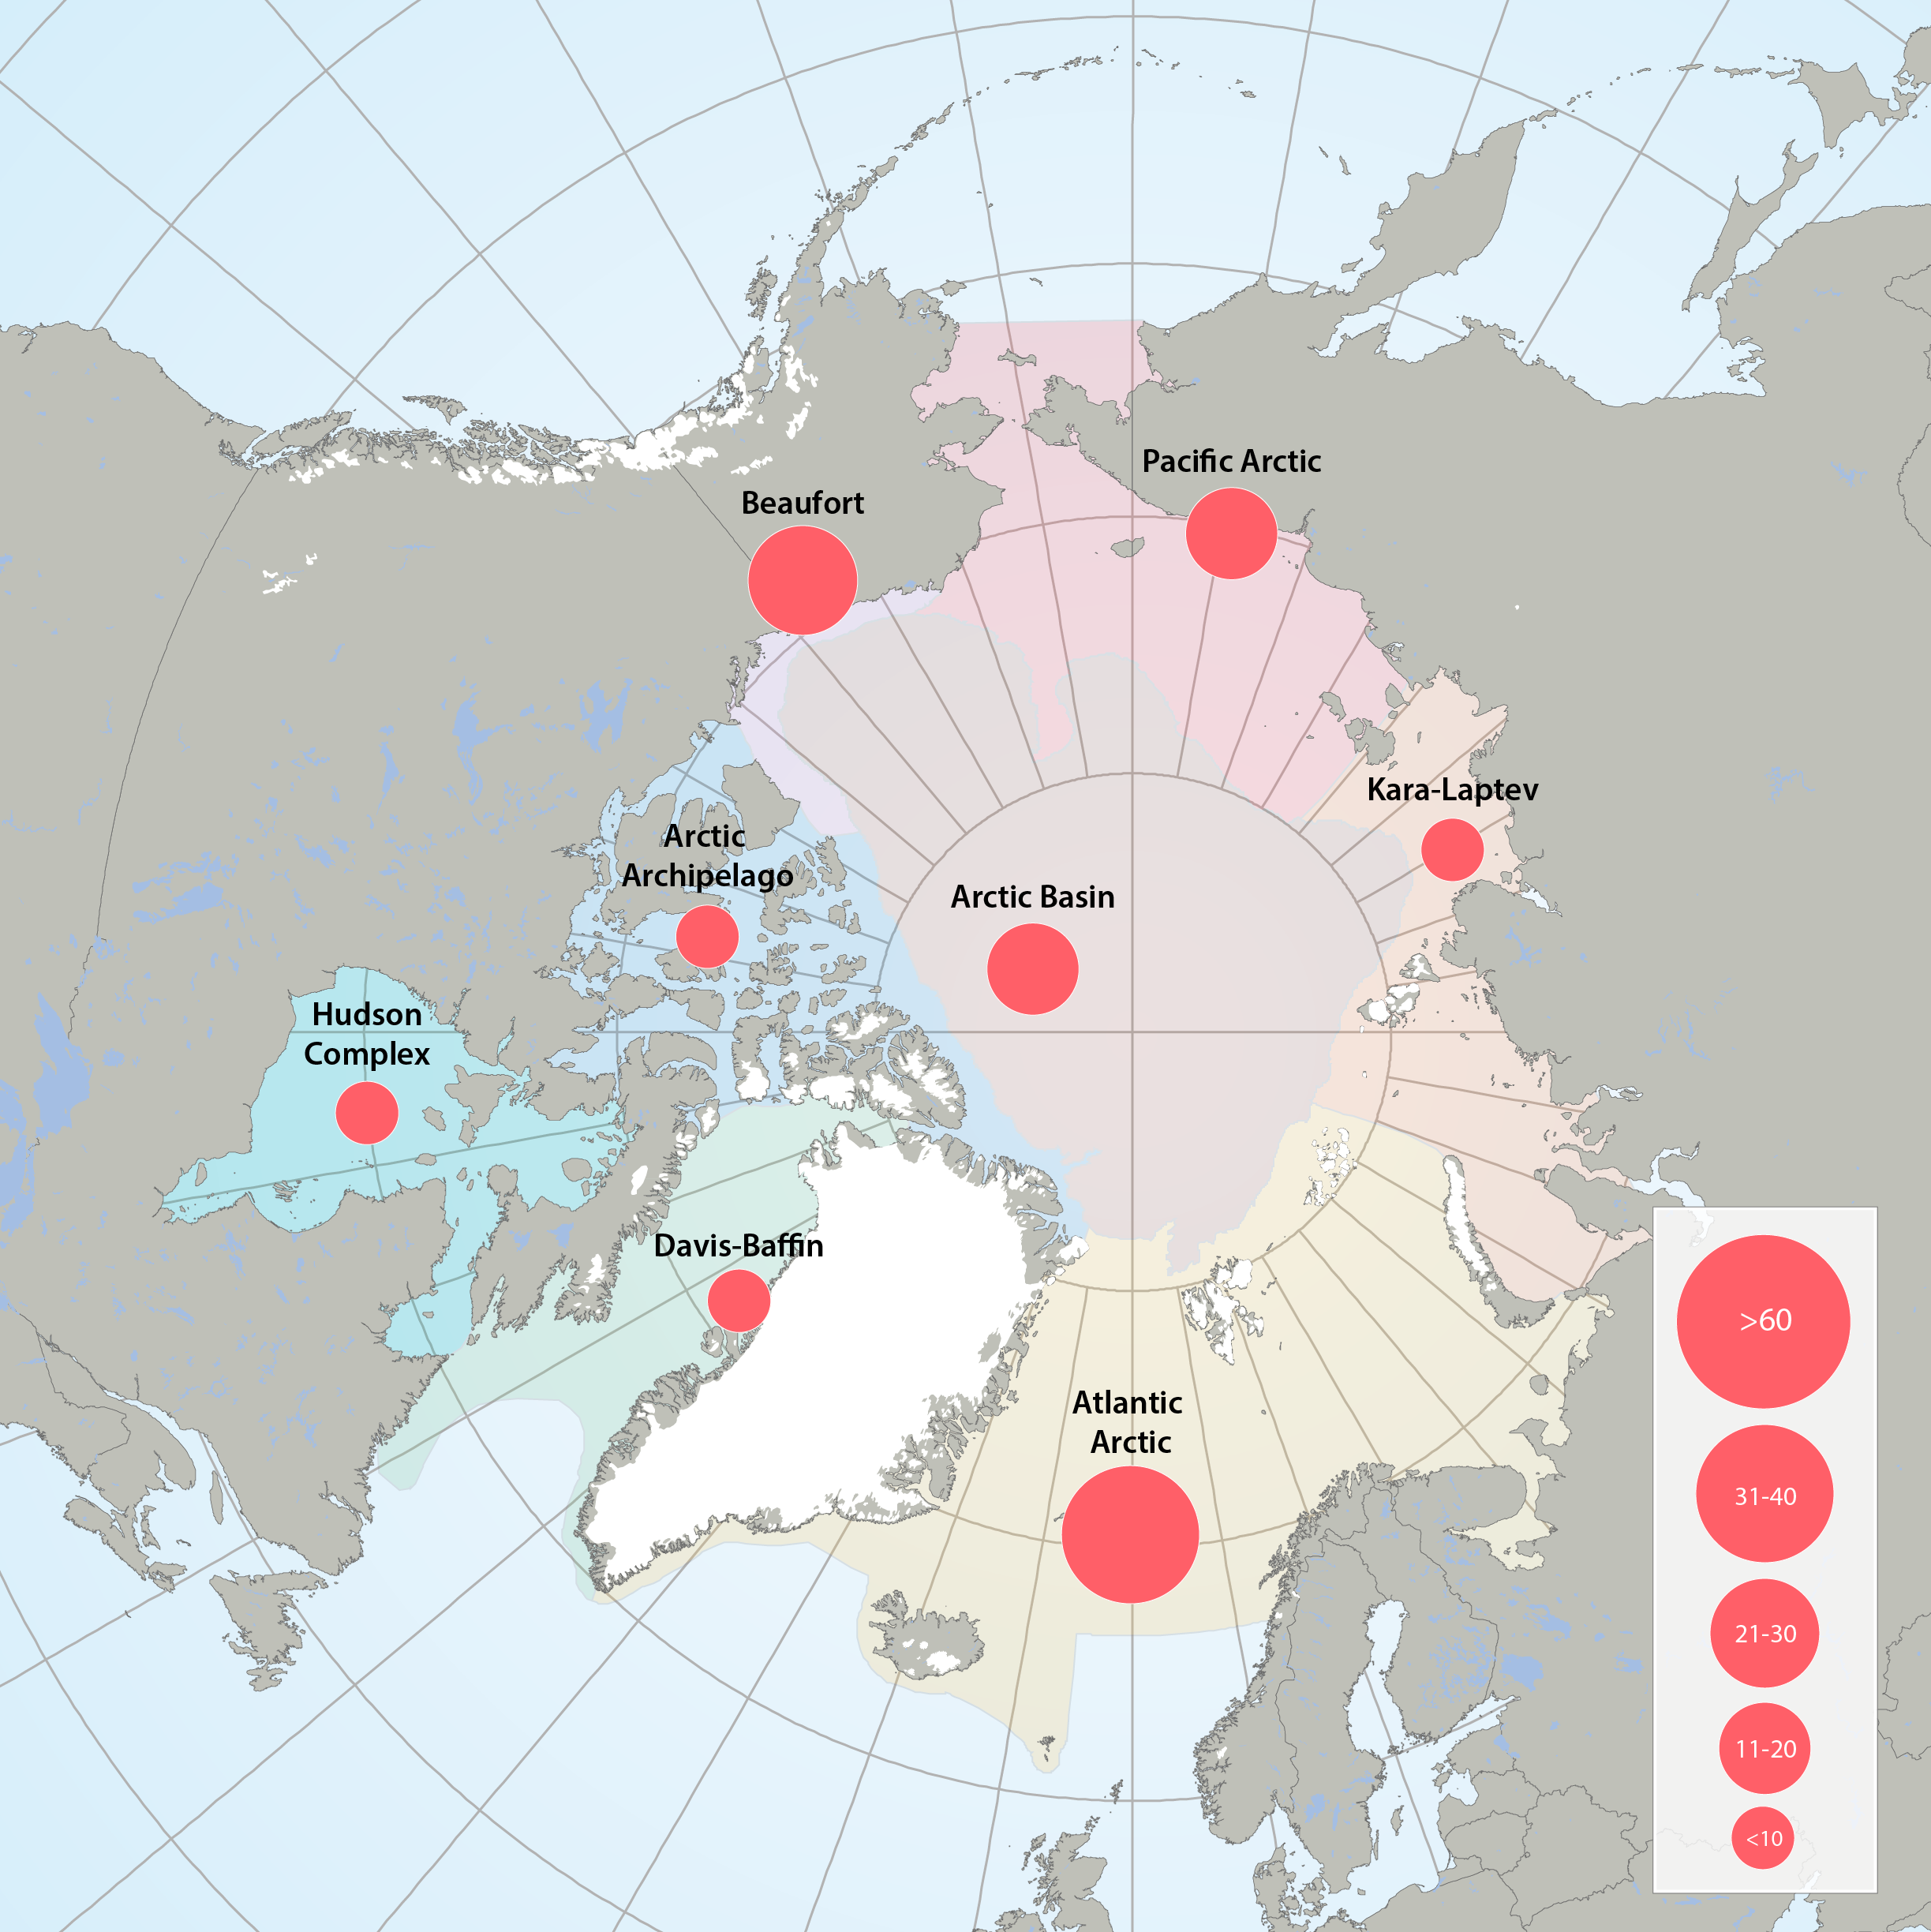
Figure 3.2.1a: Map of high throughput sequencing records from the Arctic Marine Areas. Figure 3.2.1b: Map of records of phytoplankton taxa using microscopy from the Arctic Marine Areas. STATE OF THE ARCTIC MARINE BIODIVERSITY REPORT - <a href="https://arcticbiodiversity.is/findings/plankton" target="_blank">Chapter 3</a> - Page 35 - Figure 3.2.1a and Figure 3.2.1b In terms of stations sampled, the greatest sampling effort of high-throughput sequencing in Arctic marine water columns, by far, has been in the Beaufort Sea/Amundsen Gulf region and around Svalbard. High through-put sequencing has also been used on samples from the Chukchi Sea, Canadian Arctic Archipelago, Baffin Bay, Hudson Bay, the Greenland Sea and Laptev Sea.
-
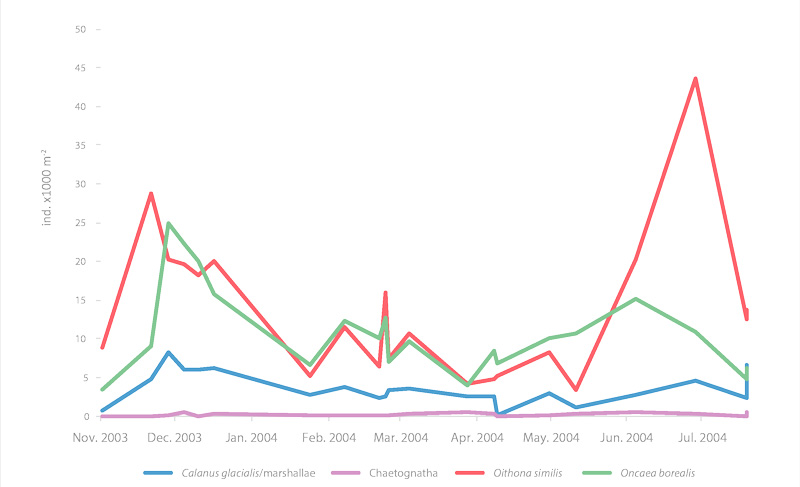
Seasonal time series of the major zooplankton in Franklin Bay, Canada STATE OF THE ARCTIC MARINE BIODIVERSITY REPORT - <a href="https://arcticbiodiversity.is/findings/plankton" target="_blank">Chapter 3</a> - Page 78 - Figure 3.2.9 Mesozooplankton abundance, integrated from 10 m above the seafloor to the surface (ind m-2), in Franklin Bay during the CASES 2003-04 overwintering expedition. Most of the sampling was done at the overwintering station and a few stations were close to this site in autumn 2003 and summer 2004.
-
The Green Edge project was designed to investigate the onset, life and fate of a phytoplankton spring bloom (PSB) in the Arctic Ocean. The lengthening of the ice-free period and the warming of seawater, amongst other factors, have induced major changes in arctic ocean biology over the last decades. Because the PSB is at the base of the Arctic Ocean food chain, it is crucial to understand how changes in the arctic environment will affect it. Green Edge was a large multidisciplinary collaborative project bringing researchers and technicians from 28 different institutions in seven countries, together aiming at understanding these changes and their impacts on the future. The fieldwork for the Green Edge project took place over two years (2015 and 2016) and was carried out from both an ice camp and a research vessel in the Baffin Bay, Canadian arctic. Here, we describe the data set obtained during the research cruise, which took place aboard the Canadian Coast Guard Ship (CCGS) Amundsen in spring 2016. Important Note: This submission has been initially submitted to SEA scieNtific Open data Edition (SEANOE) publication service and received the recorded DOI. The metadata elements have been further processed (refined) in EMODnet Ingestion Service in order to conform with the Data Submission Service specifications.
-
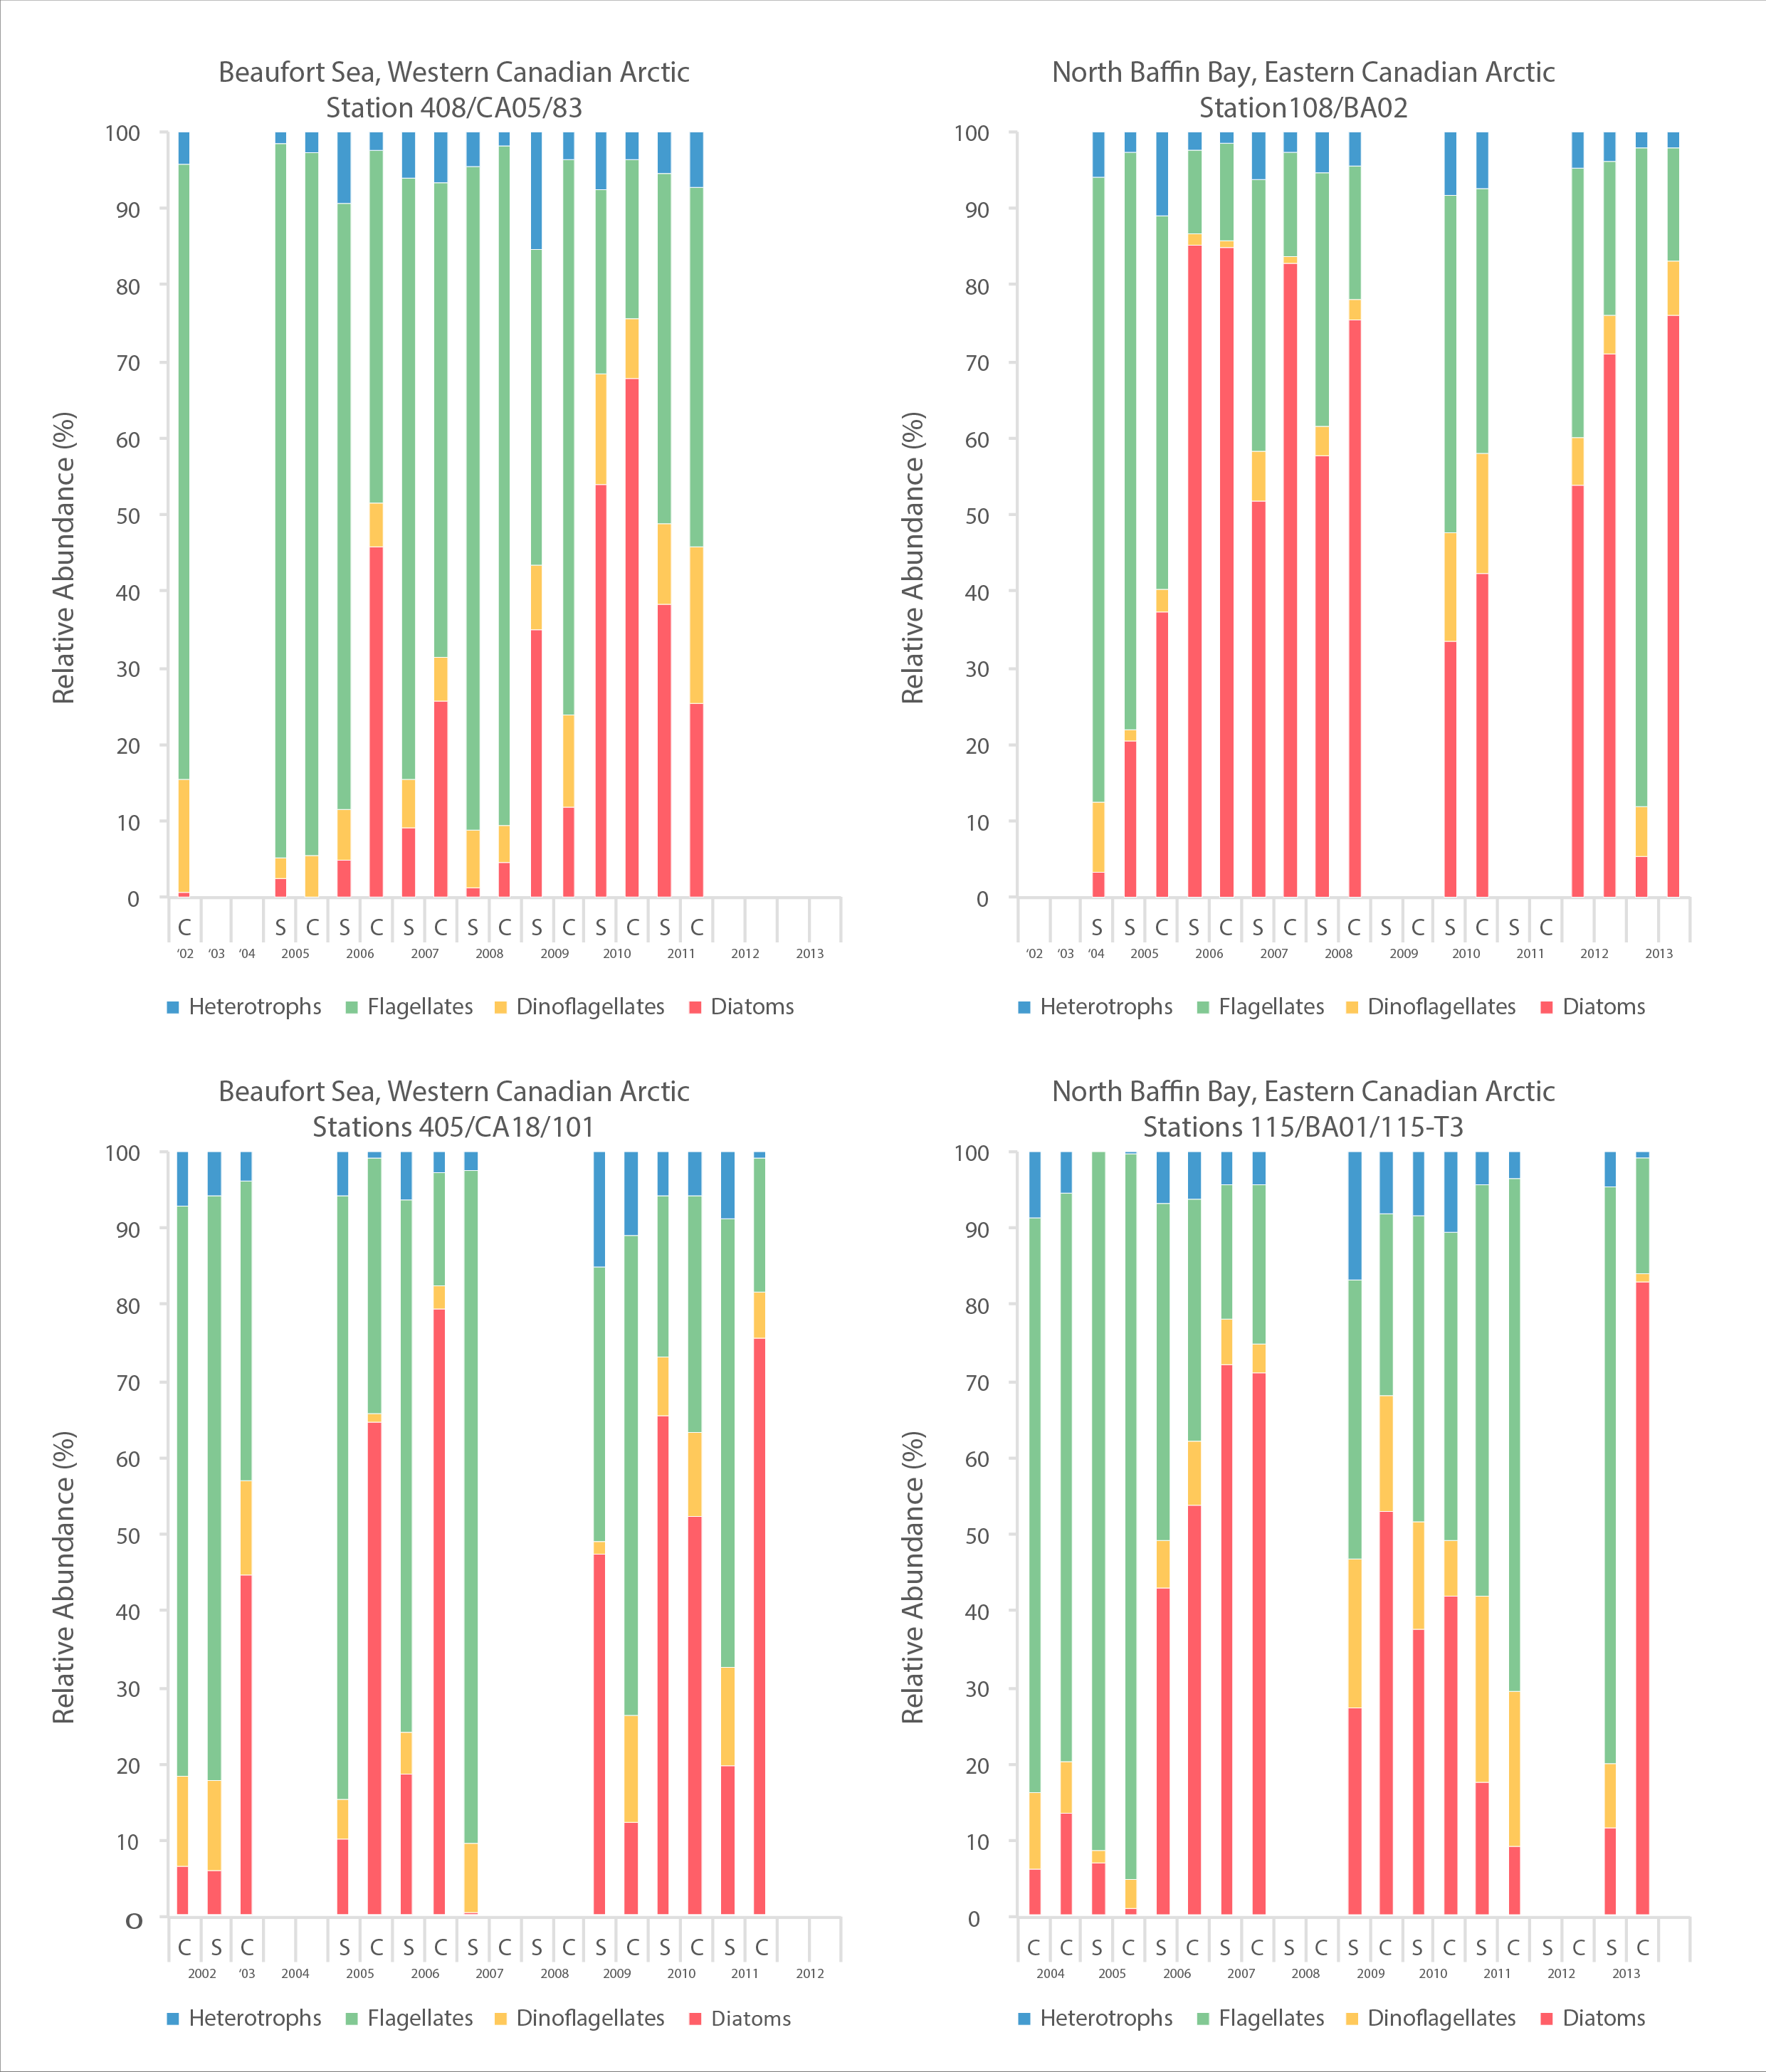
A time series of cell abundances, as determined by microscopy, of major phytoplankton groups from 2002-2013 for four sites, two in an east-west transect in Amundsen Gulf, Beaufort Sea and two in an east-west transect in northern Baffin Bay. STATE OF THE ARCTIC MARINE BIODIVERSITY REPORT - <a href="https://arcticbiodiversity.is/findings/plankton" target="_blank">Chapter 3</a> - Page 73 - Figure 3.2.4 A time series of cell abundances, as determined by microscopy, of major phytoplankton groups from 2002-2013 for four sites, 2 in the Beaufort Sea and 2 in northern Baffin Bay. Cell abundances are given as cells per liter. On most sampling dates, there is data from surface water and from the subsurface chlorophyll maximum (Cmax in the spreadsheet). Some additional information is included in the column headings, such as the percent of light at the sample depth; however, this should not be included in the figure. You may or may not want to include a map element in this figure, and rough coordinates of the sampling sites are included. The second sheet of the excel file presents the same data but at a finer scale of taxonomic resolution. It is the first sheet that should be used.
-
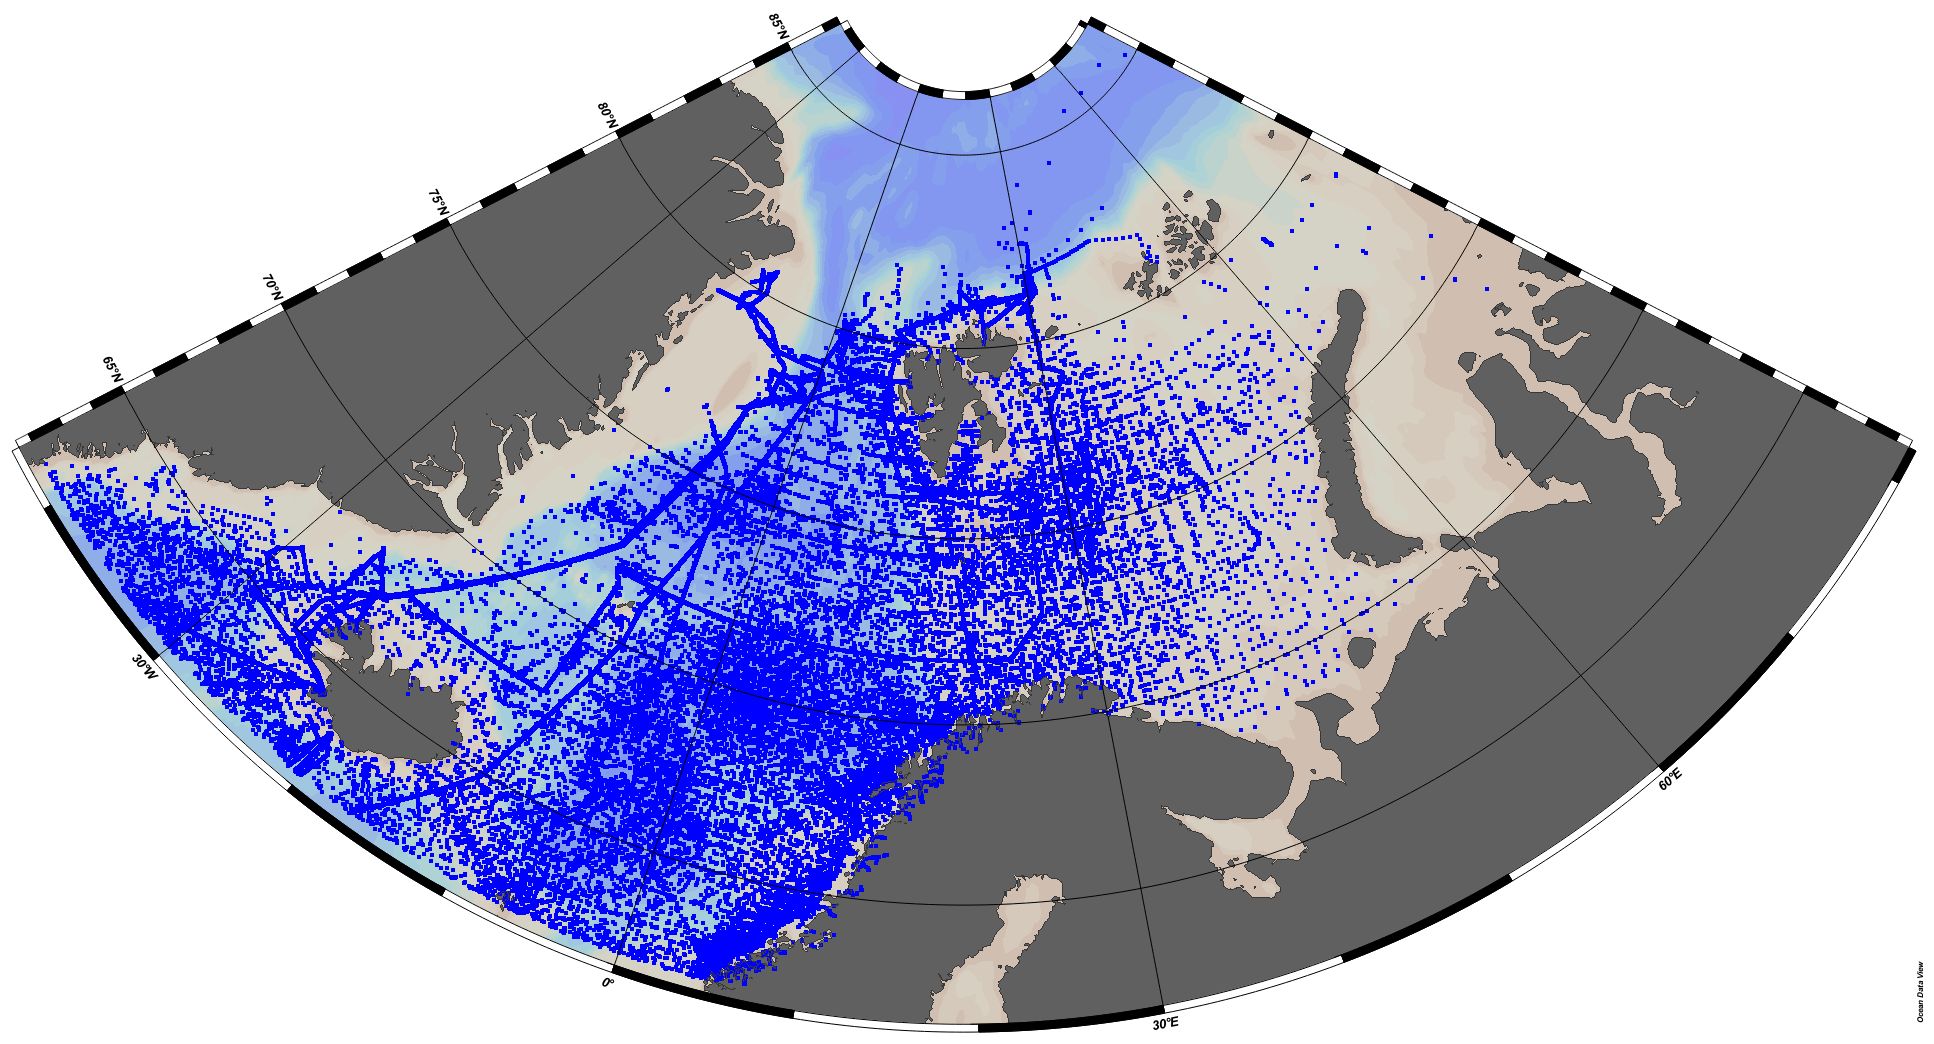
EMODnet Chemistry aims to provide access to marine chemistry datasets and derived data products concerning eutrophication, acidity and contaminants. The importance of the selected substances and other parameters relates to the Marine Strategy Framework Directive (MSFD). This aggregated dataset contains all unrestricted EMODnet Chemistry data on eutrophication and acidity, and covers the Norwegian Sea, Barents Sea, Greenland Sea and Icelandic Waters. Data were aggregated and quality controlled by 'Institute of Marine Research - Norwegian Marine Data Centre (NMD)' in Norway. ITS-90 water temperature and water body salinity variables have also been included ('as are') to complete the eutrophication and acidity data. If you use these variables for calculations, please refer to SeaDataNet for the quality flags: https://www.seadatanet.org/Products/Aggregated-datasets. Regional datasets concerning eutrophication and acidity are automatically harvested, and the resulting collections are aggregated and quality controlled using ODV Software and following a common methodology for all sea regions ( https://doi.org/10.13120/8xm0-5m67). Parameter names are based on P35 vocabulary, which relates to EMODnet Chemistry aggregated parameter names and is available at: https://vocab.nerc.ac.uk/search_nvs/P35/. When not present in original data, water body nitrate plus nitrite was calculated by summing all nitrate and nitrite parameters. The same procedure was applied for water body dissolved inorganic nitrogen (DIN), which was calculated by summing all nitrate, nitrite, and ammonium parameters. Concentrations per unit mass were converted to a unit volume using a constant density of 1.025 kg/L. The aggregated dataset can also be downloaded as an ODV collection and spreadsheet, which is composed of a metadata header followed by tab separated values. This spreadsheet can be imported to ODV Software for visualisation (more information can be found at: https://www.seadatanet.org/Software/ODV).
-
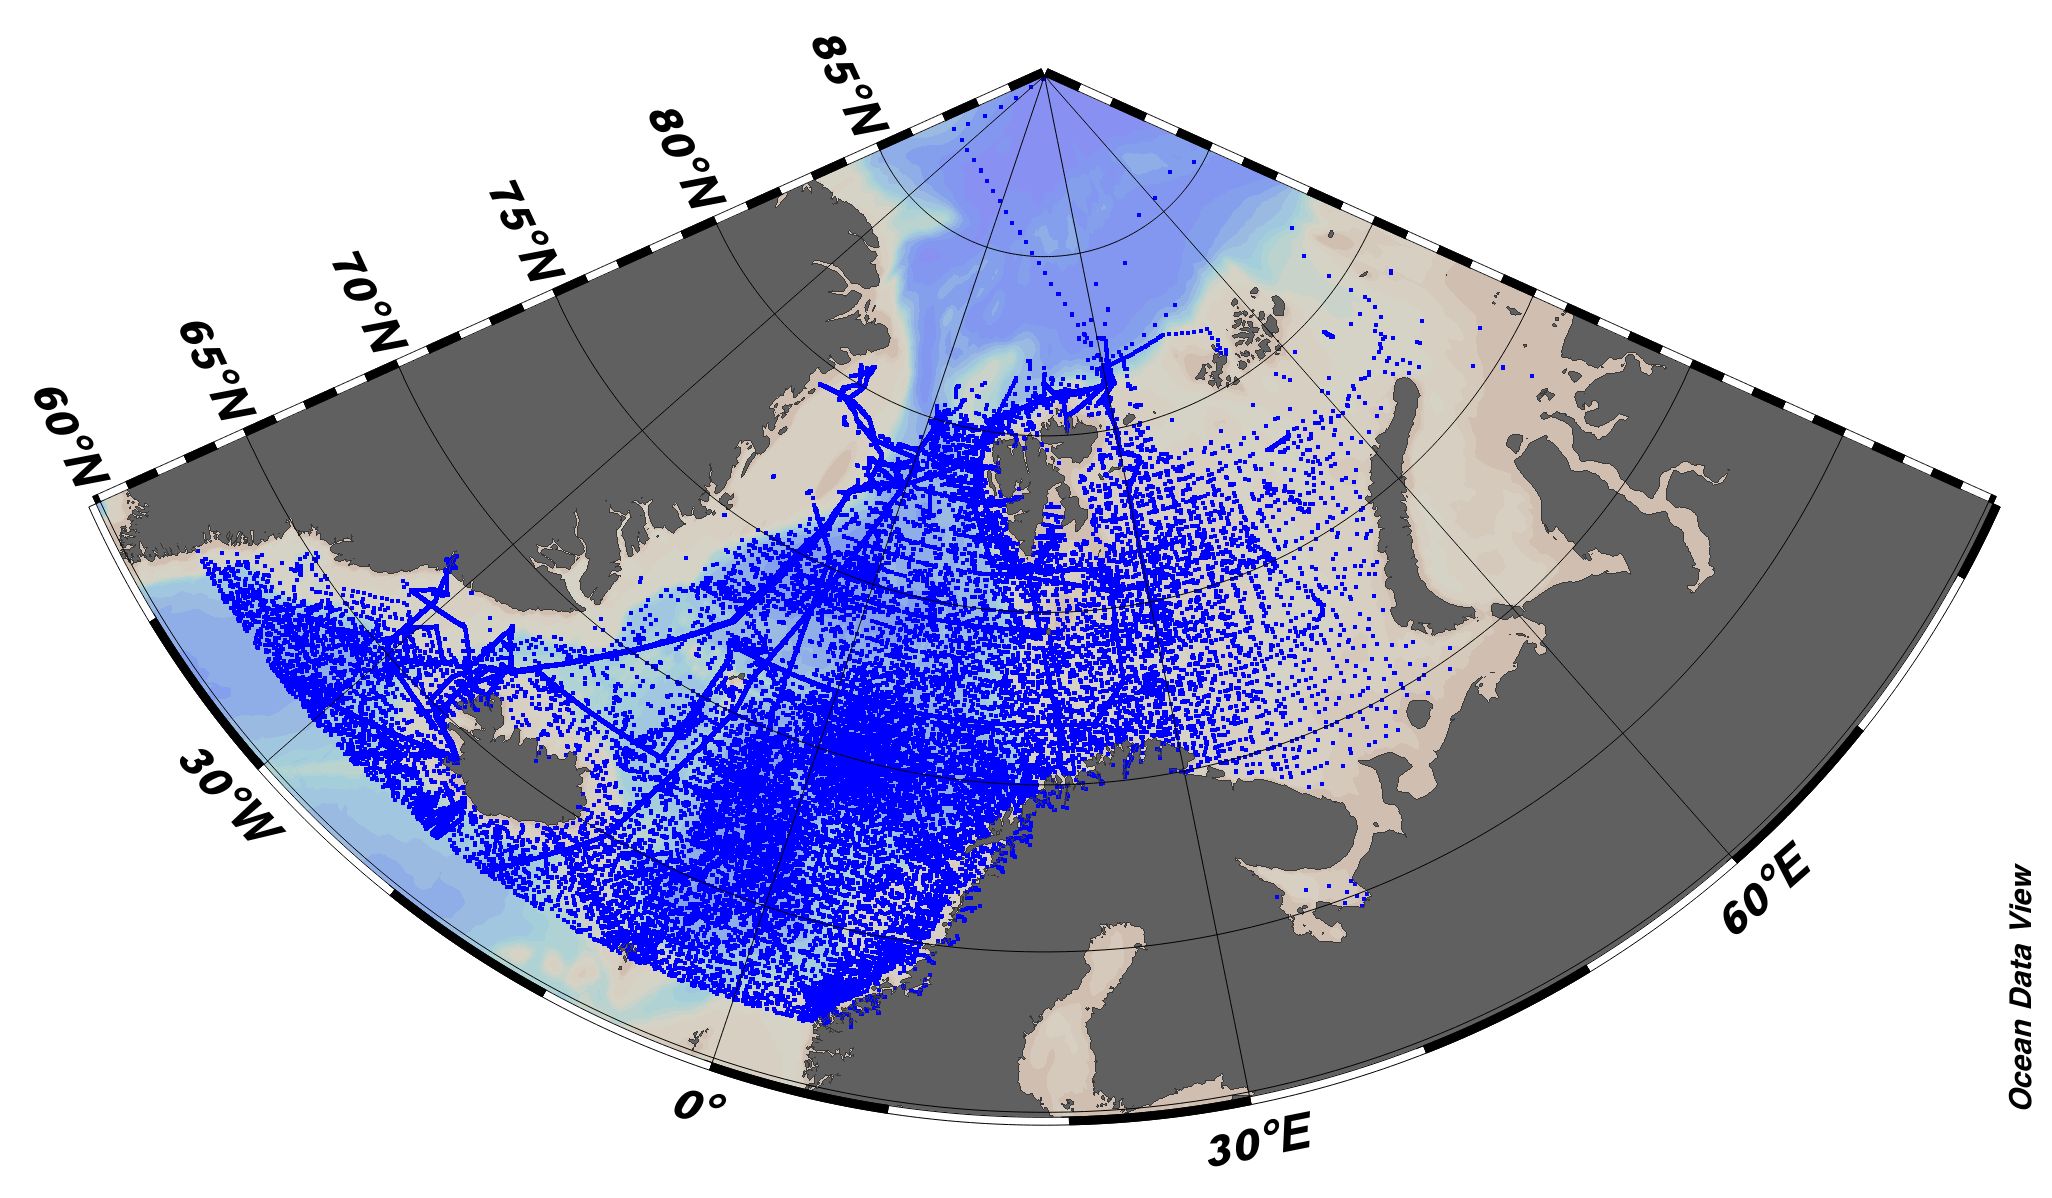
EMODnet Chemistry aims to provide access to marine chemistry datasets and derived data products concerning eutrophication, acidity and contaminants. The importance of the selected substances and other parameters relates to the Marine Strategy Framework Directive (MSFD). This aggregated dataset contains all unrestricted EMODnet Chemistry data on eutrophication and acidity, and covers the Norwegian Sea, Barents Sea, Greenland Sea and Icelandic Waters. Data were aggregated and quality controlled by 'Institute of Marine Research - Norwegian Marine Data Centre (NMD)' in Norway. ITS-90 water temperature and water body salinity variables have also been included ('as are') to complete the eutrophication and acidity data. If you use these variables for calculations, please refer to SeaDataNet for the quality flags: https://www.seadatanet.org/Products/Aggregated-datasets . Regional datasets concerning eutrophication and acidity are automatically harvested, and the resulting collections are aggregated and quality controlled using ODV Software and following a common methodology for all sea regions ( https://doi.org/10.13120/8xm0-5m67 ). Parameter names are based on P35 vocabulary, which relates to EMODnet Chemistry aggregated parameter names and is available at: https://vocab.nerc.ac.uk/search_nvs/P35/ . When not present in original data, water body nitrate plus nitrite was calculated by summing all nitrate and nitrite parameters. The same procedure was applied for water body dissolved inorganic nitrogen (DIN), which was calculated by summing all nitrate, nitrite, and ammonium parameters. Concentrations per unit mass were converted to a unit volume using a constant density of 1.025 kg/L. The aggregated dataset can also be downloaded as an ODV collection and spreadsheet, which is composed of a metadata header followed by tab separated values. This spreadsheet can be imported to ODV Software for visualisation (more information can be found at: https://www.seadatanet.org/Software/ODV ).
-
Water_body_chlorophyll-a - Monthly Climatology for the European Seas for the period 1960-2023 on the domain from longitude -45.0 to 70.0 degrees East and latitude 24.0 to 83.0 degrees North. Data Sources: observational data from SeaDataNet/EMODnet Chemistry Data Network. Description of DIVA analysis: The computation was done with the DIVAnd (Data-Interpolating Variational Analysis in n dimensions), version 2.7.12, using GEBCO 30sec topography for the spatial connectivity of water masses. Horizontal correlation length and vertical correlation length vary spatially depending on the topography and domain. Depth range: 0.0, 5.0, 10.0, 15.0, 20.0, 25.0, 30.0, 35.0, 40.0, 45.0, 50.0, 55.0, 60.0, 65.0, 70.0, 75.0, 80.0, 85.0, 90.0, 95.0, 100.0, 125.0, 150.0, 175.0, 200.0, 225.0, 250.0, 275.0, 300.0, 325.0, 350.0, 375.0, 400.0, 425.0, 450.0, 475.0, 500.0, 550.0, 600.0, 650.0, 700.0, 750.0, 800.0, 850.0, 900.0, 950.0, 1000.0, 1050.0, 1100.0, 1150.0, 1200.0, 1250.0, 1300.0, 1350.0, 1400.0, 1450.0, 1500.0, 1550.0, 1600.0, 1650.0, 1700.0, 1750.0, 1800.0, 1850.0, 1900.0, 1950.0, 2000.0, 2100.0, 2200.0, 2300.0, 2400.0, 2500.0, 2600.0, 2700.0, 2800.0, 2900.0, 3000.0, 3100.0, 3200.0, 3300.0, 3400.0, 3500.0, 3600.0, 3700.0, 3800.0, 3900.0, 4000.0, 4100.0, 4200.0, 4300.0, 4400.0, 4500.0, 4600.0, 4700.0, 4800.0, 4900.0, 5000.0, 5100.0, 5200.0, 5300.0, 5400.0, 5500.0 m. Units: mg/m3. The horizontal resolution of the produced DIVAnd analysis is 0.25 degrees.
-
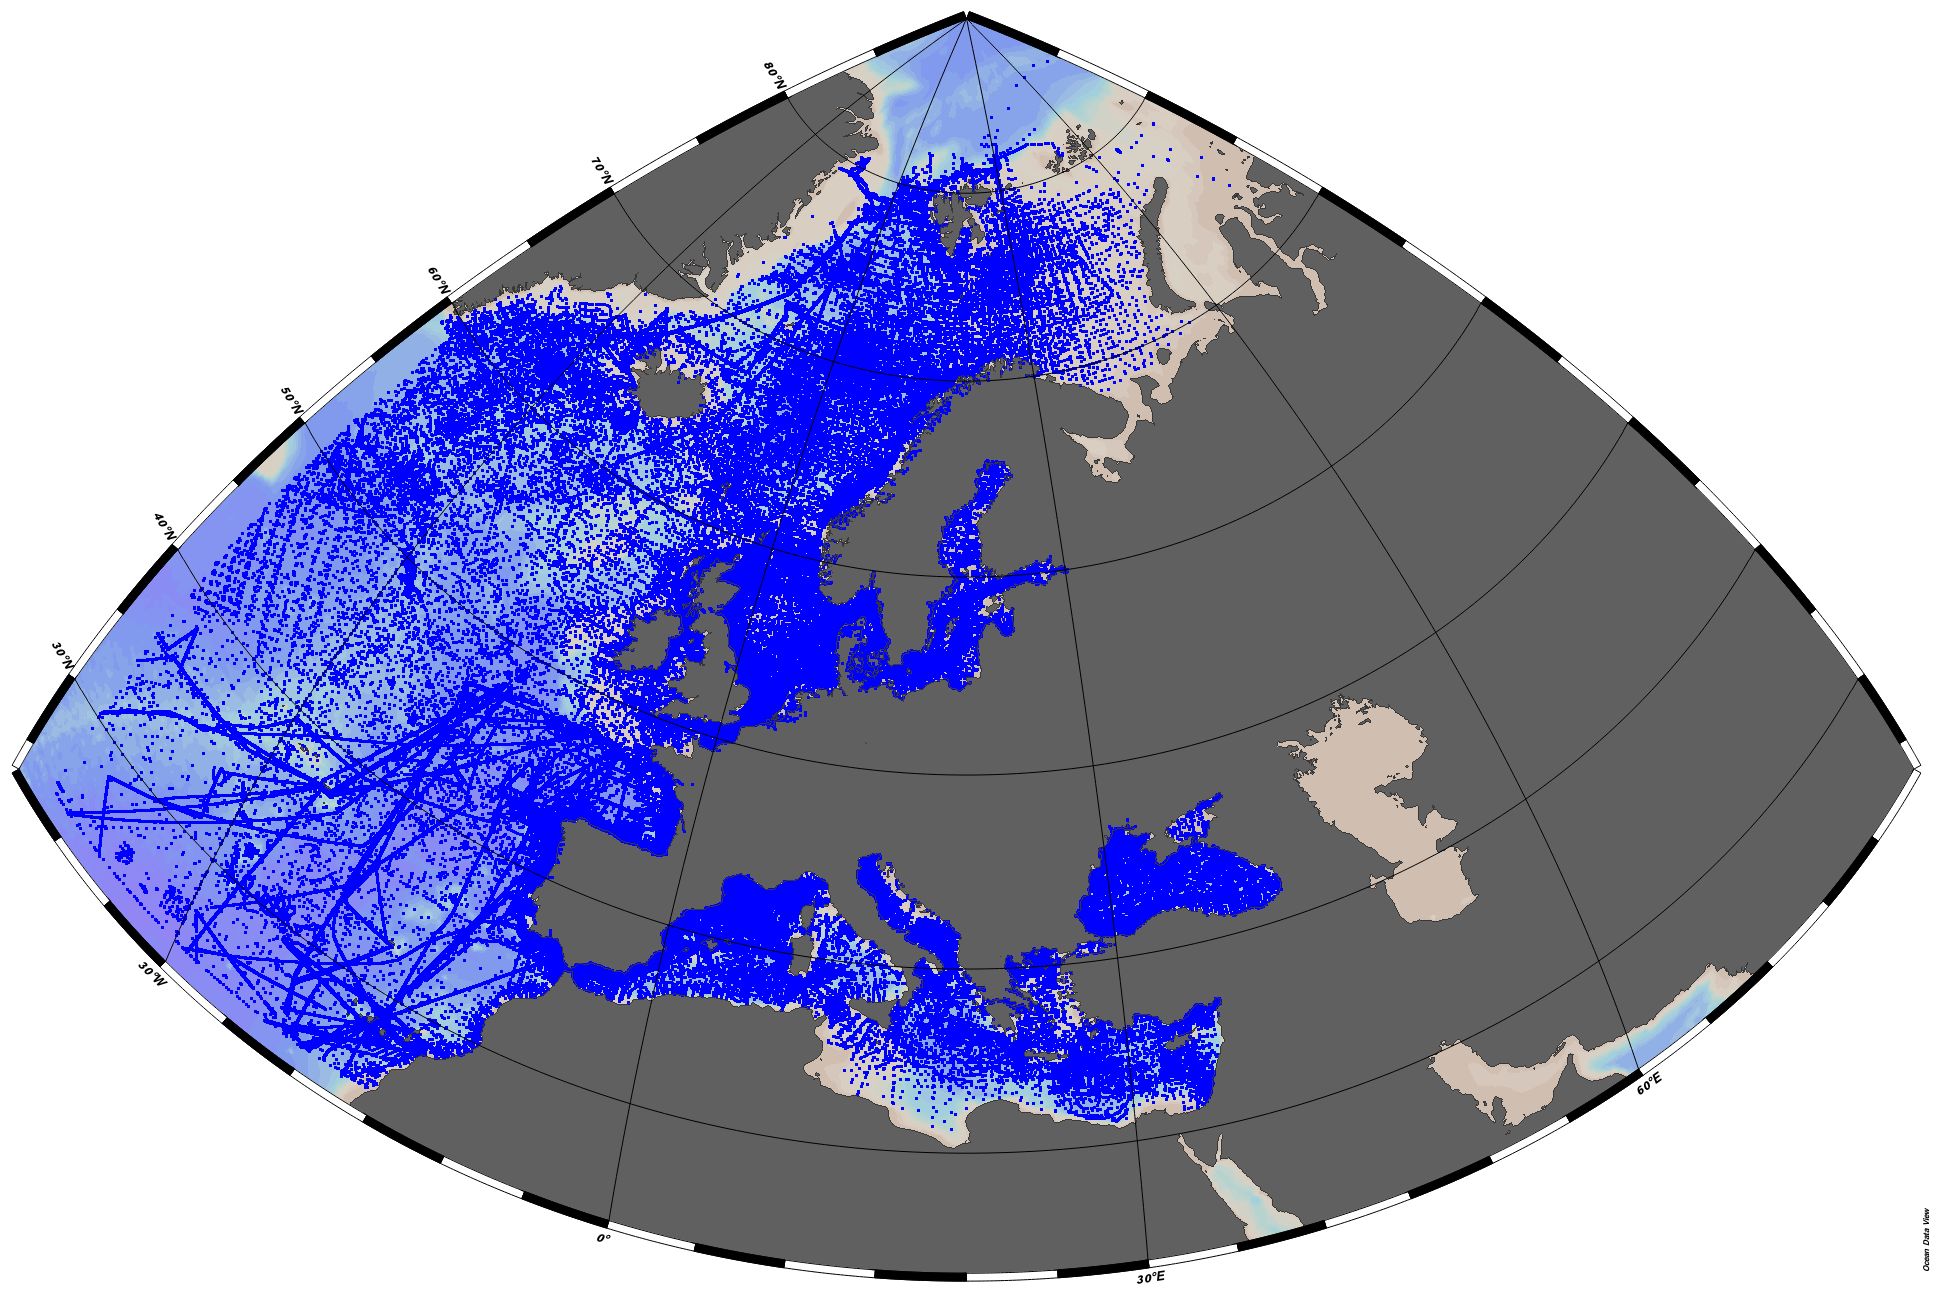
EMODnet Chemistry aims to provide access to marine chemistry datasets and derived data products concerning eutrophication, acidity and contaminants. The importance of the selected substances and other parameters relates to the Marine Strategy Framework Directive (MSFD). This aggregated dataset contains all unrestricted EMODnet Chemistry data profiles on eutrophication and acidity, and covers: the Artic Ocean, the North East Atlantic, the Greater North Sea and Celtic Seas, the Baltic Sea, the Mediterranean Sea and the Black Sea. ITS-90 water temperature and water body salinity variables have also been included ('as are') to complete the eutrophication and acidity data. If you use these variables for calculations, please refer to SeaDataNet for the quality flags: https://www.seadatanet.org/Products/Aggregated-datasets. This European dataset is the result of the aggregation of the regional datasets concerning eutrophication and acidity present in EMODnet Chemistry. The regional datasets are automatically harvested, and the resulting collections are aggregated and quality controlled using ODV Software and following a common methodology for all sea regions ( https://doi.org/10.13120/8xm0-5m67). Parameter names are based on P35 vocabulary, which relates to EMODnet Chemistry aggregated parameter names and is available at: https://vocab.nerc.ac.uk/search_nvs/P35/. This process were regionally performed by: 'Institute of Marine Research - Norwegian Marine Data Centre (NMD)' (Norway), 'IFREMER / IDM / SISMER - Scientific Information Systems for the SEA' (France), 'Aarhus University, Department of Bioscience, Marine Ecology Roskilde' (Denmark), 'Swedish Meteorological and Hydrological Institute (SMHI)' (Sweden), 'Hellenic Centre for Marine Research, Hellenic National Oceanographic Data Centre (HCMR/HNODC)' (Greece) and 'National Institute for Marine Research and Development 'Grigore Antipa' (Romania). When not present in original data, water body nitrate plus nitrite was calculated by summing all nitrate and nitrite parameters. The same procedure was applied for water body dissolved inorganic nitrogen (DIN), which was calculated by summing all nitrate, nitrite, and ammonium parameters. Concentrations per unit mass were converted to a unit volume using a constant density of 1.025 kg/L. The aggregated dataset can be downloaded as an ODV collection.
-

EMODnet Chemistry aims to provide access to marine chemistry datasets and derived data products concerning eutrophication, acidity, contaminants and marine litter. The importance of the selected substances and other parameters relates to the Marine Strategy Framework Directive (MSFD). This aggregated dataset contains all unrestricted EMODnet Chemistry data profiles on eutrophication and acidity, and covers: the Artic Ocean, the North East Atlantic, the Greater North Sea and Celtic Seas, the Baltic Sea, the Mediterranean Sea and the Black Sea. ITS-90 water temperature and water body salinity variables have also been included ('as are') to complete the eutrophication and acidity data. If you use these variables for calculations, please refer to SeaDataNet for the quality flags: https://www.seadatanet.org/Products/Aggregated-datasets . This European dataset is the result of the aggregation of the regional datasets concerning eutrophication and acidity present in EMODnet Chemistry. The regional datasets are automatically harvested, and the resulting collections are aggregated and quality controlled using ODV Software and following a common methodology for all sea regions ( https://doi.org/10.13120/8xm0-5m67 ). Parameter names are based on P35 vocabulary, which relates to EMODnet Chemistry aggregated parameter names and is available at: https://vocab.nerc.ac.uk/search_nvs/P35/. This process were regionally performed by: 'Institute of Marine Research - Norwegian Marine Data Centre (NMD)' (Norway), 'IFREMER / IDM / SISMER - Scientific Information Systems for the SEA' (France), 'Aarhus University, Department of Bioscience, Marine Ecology Roskilde' (Denmark), 'Swedish Meteorological and Hydrological Institute (SMHI)' (Sweden), 'Hellenic Centre for Marine Research, Hellenic National Oceanographic Data Centre (HCMR/HNODC)' (Greece) and 'National Institute for Marine Research and Development 'Grigore Antipa' (Romania). When not present in original data, water body nitrate plus nitrite was calculated by summing all nitrate and nitrite parameters. The same procedure was applied for water body dissolved inorganic nitrogen (DIN), which was calculated by summing all nitrate, nitrite, and ammonium parameters. Concentrations per unit mass were converted to a unit volume using a constant density of 1.025 kg/L. The aggregated dataset can be downloaded as an ODV collection.
 Arctic SDI catalogue