 Arctic SDI catalogue
2024
Type of resources
Available actions
Topics
Keywords
Contact for the resource
Provided by
Years
Formats
Representation types
Service types
Scale
Resolution
-
Number of days with an average air temperature below zero degrees (tas <0 °C) for the period 1991-2020, at a 1x1 km spatial resolution. Based on daily temperature normals.
-
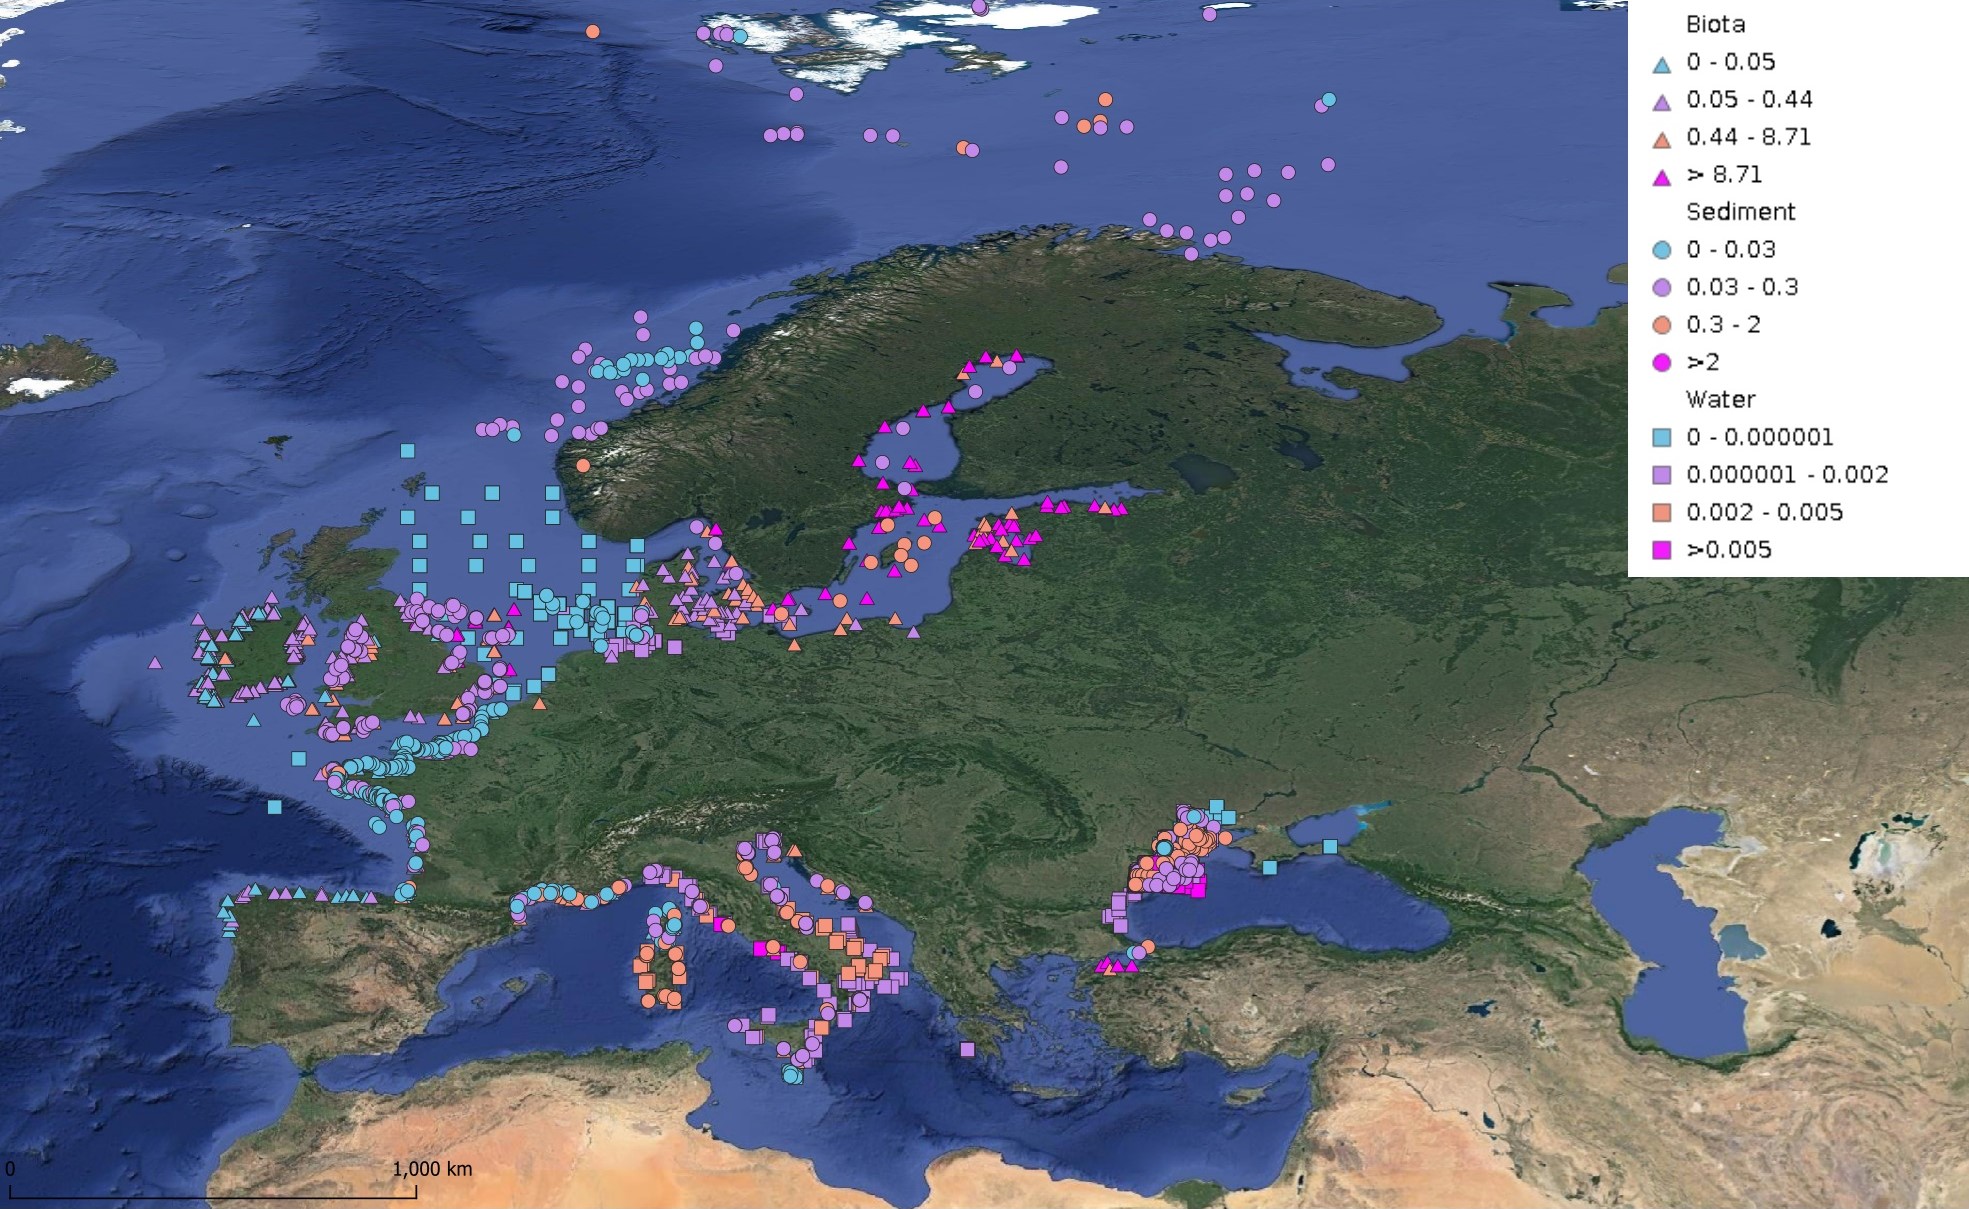
This product displays for DDT, DDE, and DDD, median values since 2012 that have been measured per matrix and are present in EMODnet regional contaminants aggregated datasets, v2024. The median values ranges are derived from the following percentiles: 0-25%, 25-75%, 75-90%, >90%. Only "good data" are used, namely data with Quality Flag=1, 2, 6, Q (SeaDataNet Quality Flag schema). For water, only surface values are used (0-15 m), for sediment and biota data at all depths are used.
-
Number of days with maximum temperature above or equal to 20 degrees (tasmax>=20 °C) for the period 1991-2020, at a 1x1 km spatial resolution.
-
Long-term measurements of sea water properties collected by sensor buoy in Adventfjorden as part of the Svalbard Integrated Arctic Earth Observing System (SIOS).
-
99 percentile of daily wind speed, for the period 1991-2020, at a 1x1 km spatial resolution.
-
Number of days with air temperature crossing zero degrees (tasmax>0 og tasmin<0) for year or season, for the period 1991-2020, at a 1x1 km spatial resolution.
-
Number of days with minimum temperature above or equal to 20 degrees (tasmin>=20 °C) for the period 1991-2020, at a 1x1 km spatial resolution.
-
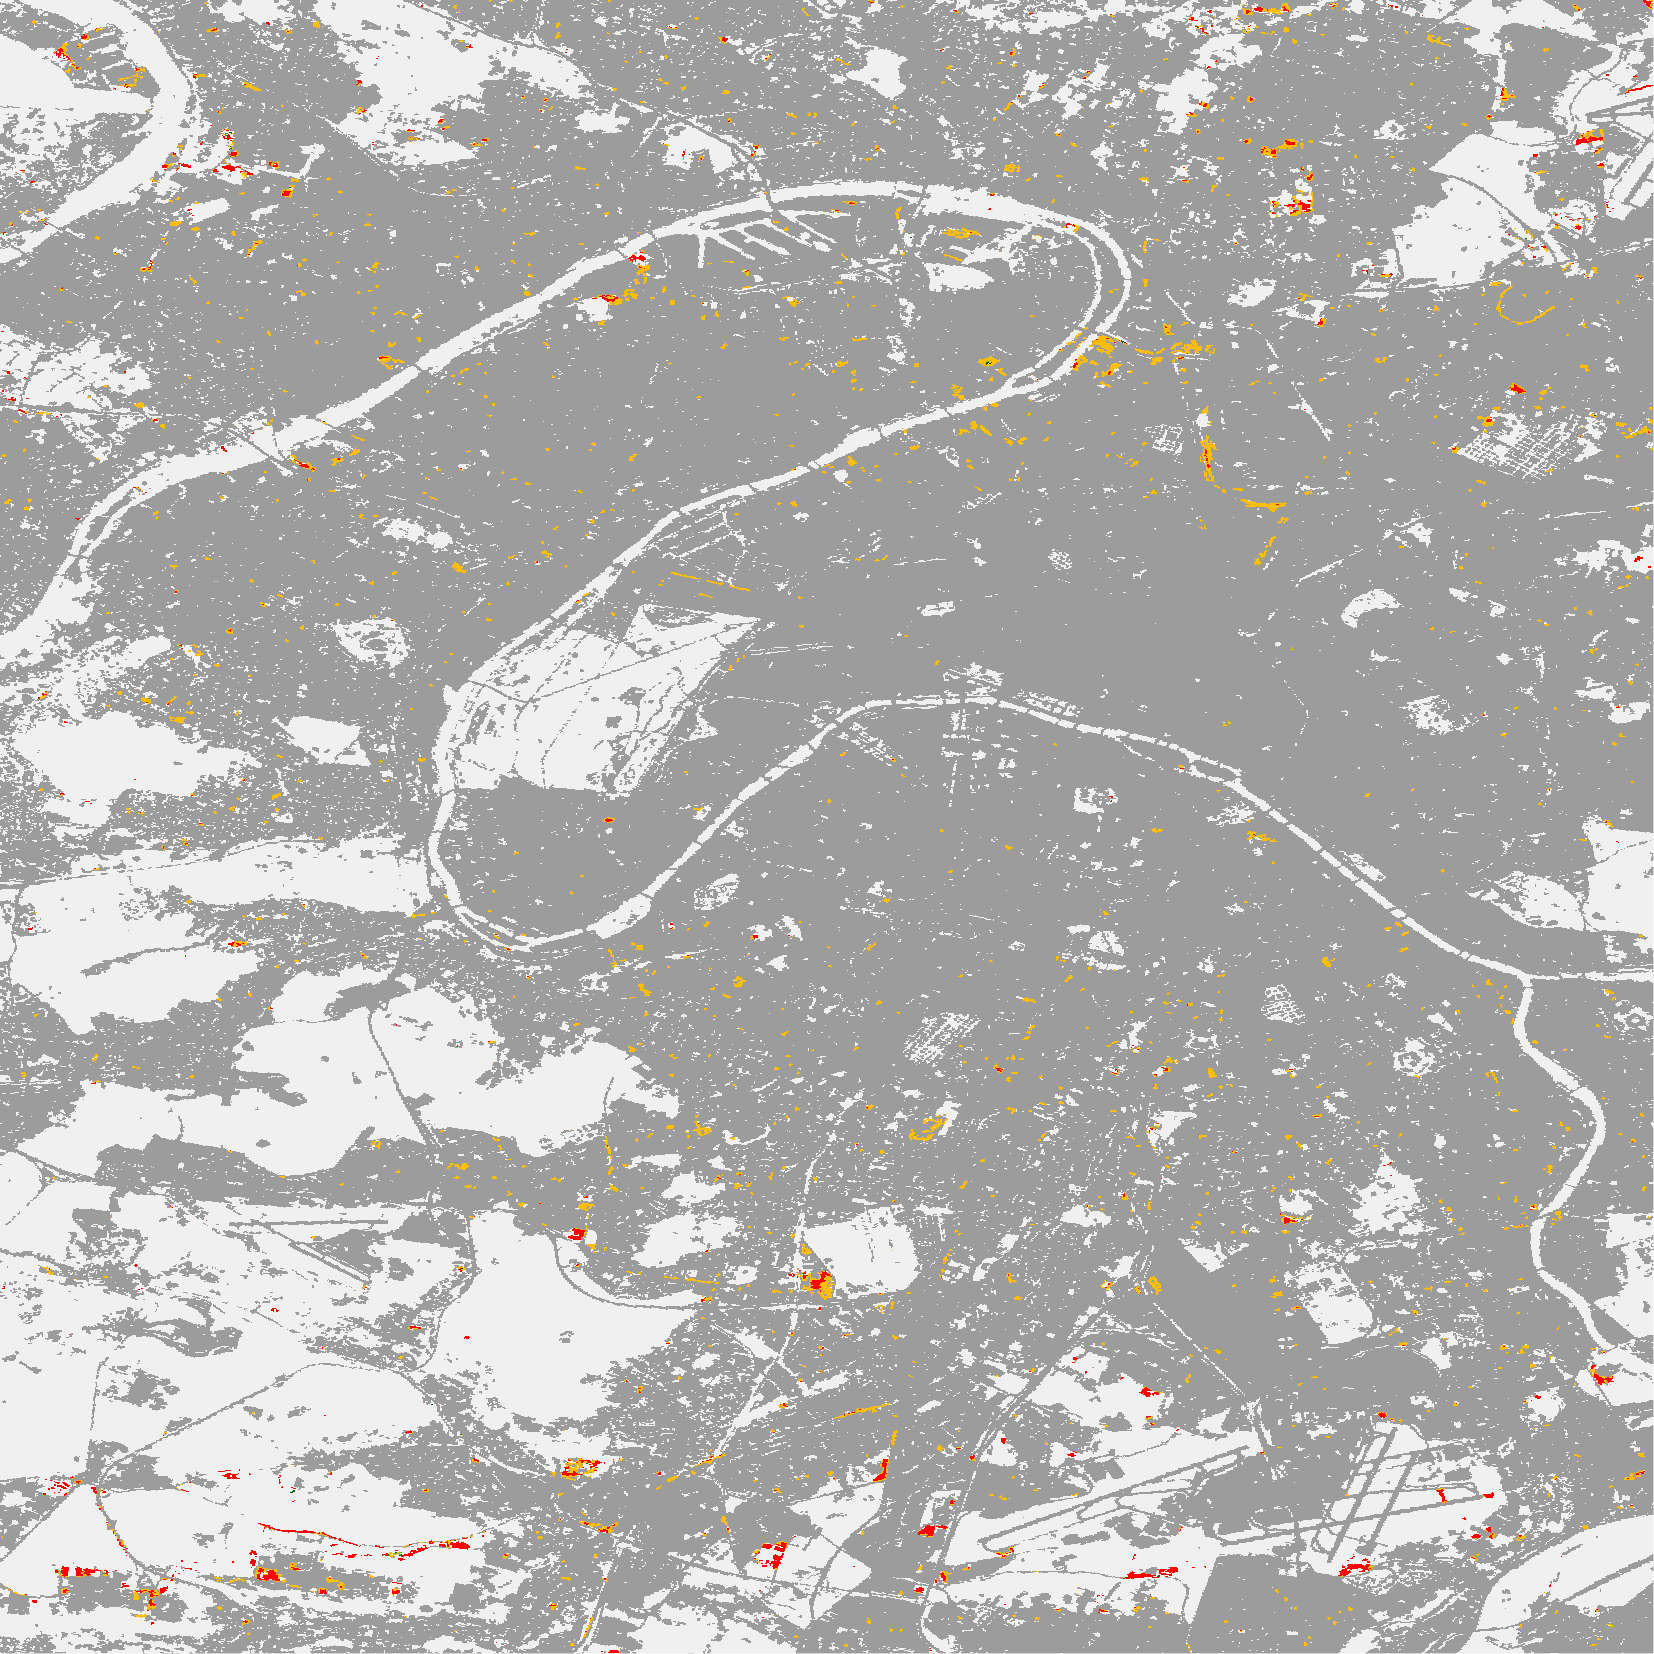
The Imperviousness Change Classified (IMCC) 2021-2024 layer is part of the High Resolution Layer (HRL) Imperviousness and provides categorical information on the imperviousness change per pixel between reference years 2021 and 2024 as derived from re-classification of the Imperviousness Density Change (IMDC) 2021–2024 layer. The production of the HRL Imperviousness is coordinated by EEA in the frame of Copernicus, the Earth observation component of the European Union’s Space programme. The product is a raster dataset with 20-meter grid spacing (spatial resolution) that covers the 38 Eionet member and cooperating countries as well as the United Kingdom (i.e. EEA38+UK). It is distributed as 100 x 100 km tiles that are fully conformant with the EEA reference grid.
-
Happywhale.com is a resource to help you know whales as individuals, and to benefit conservation science with rich data about individual whales. Original provider: Happywhale Dataset credits: Happywhale and contributorsSightings and images were submitted to Happywhale by contributors. A portion of the Happywhale data were transferred to OBIS-SEAMAP upon the agreement between Happywhale and OBIS-SEAMAP. There may be duplicate records among Happywhale datasets and other OBIS-SEAMAP datasets. The precision of date/time vary per record. Some records have date accuracy up to year only. This dataset includes sightings and photos from the following 280 contributors in alphabetic order: adam maire; Adelie Xiaohang Li; Adrian Neubert; Alexandre Lhériau; Alex Sinclair Lack; Alicia; Allan Finney; Allied Whale North Atlantic Humpback Whale Catalog; Allison Chen; Ana; Andrew Newlun; Andrew Stewart; Andy Rose; Angela Bowler; ANGEL SOLE; Anja Robanke; Anke Kugelstadt; Anna Astafurova; Annette Bombosch; AnninaS; Antoine Viot; Audrey Stephens; Austin Wyatt; Avner Chen; Babsi Neubarth; Barbara Anne Brandon; Beatriz Benares; Benoit Nabholz; B. Noordermeer; Bonnie Gretz; Borbala; Boyd Taylor; brad siviour; Calle Schönning; Camilo Rada; Carlos Rincon; Caroline Hodgkiss; Cassandra Ruiz; Cees Tineke; Charles Lavin; Charlotte Taplin; Chris Croxson; Christian Engelke; Christian Thrane; Christoph Fritz; Chrys Tremththanmor; Conor Ryan; Dani Abras; Daniel Stevens; Danilo Foresti; DarrenJew; Dave Matlin; David Bradley; David German; Dennis Boon; Devienne Gilles; Dimitri Vitkin; Dirk van Zandwijk; Dmitrii Kiselev; Domininc Barrington; Doug Gould; Eckhard; Eden Zang; Eivind Aksnes; Elaine Purnell; Elie Vannier; Eliott Lehoux; Elísabet Ýr Guðjónsdóttir; Elke; Ellen Klein; Elodie; emma; Emma Luck; Emma Neave-Webb; Emmanuelle Peyredieu; Enrico Hoefer; Eric Clark; Eric ROURE; Erin Sneider; Eugene Saxentoff; Eyd M. Grønadal; Fabian Schmalzried; Fabio; Familia Sanchez Planell; Fanny; Federico Arribere; Florentine Guinot; françois; Frank J.; Fredrik Broms; Gabriel Lett Viviani; gaidet; Gail Cousins; Garry Bray; Geffen family; Geir Hareide Hansen; Ghada; GordieBryce; Gordon Riddell; Greta Henderson; Hanna Michel; hannes heylen; Hans Verdaat; Harold Moses; Hazel Pittwood; Heidi Krajewsky; Henk Kamstra; Herman Sips; Herve Sibert; Husavik Research Centre; Ian Gordon; Irati Maruri; Isabella Clegg; James F C Hyde IV; Jamie Coleman; Jan Kajzar; Javier Cotin; Javier Solis; Jeff Reynolds; Jenifer; Jérôme JACOB; Jim Wilson; Joe Arceneaux; Joel Moore; John Mina; Jonas Astrup; Jonathan Rempel; joost vaeyens; Josef Wolf; Joy Martinello; Joy van der Beek; Judith Scott; Judit Roch; Julia Jayne; Juliane Schlei; Julia Yr Thorvaldsdottir; Julie Skyte; karen McMullen; Kate Sauvain; Kate Weston; Katrin Schmidt; Kayla Spencer; Ken Jensen; Ken Wells; Kerstin Langenberger; Kevin; Kirsten MacTaggart; Kit Kovacs; Konstantinos Kafritsas; Kurt Methfessel; LAMBIN Jean-Marc; Lars Maltha Rasmussen; Laura; Laurence Fischer; Laurens; Laurie Horsfall; Leendert; Lena Nicola; Lene Zachariassen; Leslie Stueben-Trumphour; Lisa Hildebrand; Loes de Heus; Maëva Accart; Manfred Moormann; Marc Gose; MARC SELLERS; Marcus Bergström; Margrét Ósk Elíasdóttir; Marian Herz; Marijke Nita de Boer; Marika Marnela; Marilia Olio; Marion JONCHERES; Marjolein Meijdam; Mark Harris; Marley Watkins; Martine; Martin Kemper; Mary Keenan; Matt McDermit; Max Schweiger; Menno Schaefer; Michael Scott; Michael Sterling; Michel Pierfitte; Mick Peerdeman; Mona Beate Wendelborg; Mona Wong; Mouser Williams; MS Fram; MS Maud; MS Otto Sverdrup; MS Spitsbergen; Nacho Oria; Nadine Hunziker; Natascha; Niklas Astrom; Nils; NOAA National Marine Mammal Laboratory (NMML); Ocean Missions; Olaf Pignataro; Olivier Blaud; Pascal Mauerhofer; Patrick Ruf; Patrick Scherer; Pat Sanders; Pauline van Monsjou; Paul Soulby; Per Nikolaj Bukh; Per Olsson; Petra Glardon; Petr Petrik; Philippe Jeanty; Pim Wolf; Pupanoid; Queloz; Rachael Barber; Radovan Sutora; Rafael Martins; Raina Burke; Rand Rudland; Rebecca Malkewicz; Richard Allan; Richard Lovelock; Richard Walker; Richard White; Rob Gons; Rodrigo A. Martinez Catalan; Rod White; Romane R; Rosa M. Coronas; Russian Cetacean Habitat Project; Ruud; Sabine Griesser; Sais Céline; Samantha Wormley; Sandra Zijlstra; Sea Fever Productions; Shannon; Shantala Wentink; Sheila Miller; S. Helgu; Siairra Tharp; Simon Smith; Slater T Moore; Sophie Carr; Soyer; Stacey Colebaugh; Steffen G.; Steffen Oehme; Steffo Polar; Stephan Uhlemann; Stephen King; Steve Jones; Steven dos-Remedios; Steve Willetts; Susan Smith; suse; Tanja; Ted Creek; Teresa Blase; Therese Horntrich; Thomas Podesta; Tiffany Fare; Tim Wright; Tobias Brehm; Tobias Paul; Tony Littler; Tressarieu; Tudor Morgan; Ursula Brändle; Vicki Beaver; Virgil Reglioni; Vladimir Burkanov; Whale Wise; Wilfried Schnessl; Wouter Verwee; Years of the North Atlantic Humpback whale (YoNAH); Yuri Choufour; Yves Roumazeilles
-
Cetaceans (whales, dolphins, and porpoises) data to understand their abundance and distribution This portal assembles at-sea effort-related data collected via ship-based or aerial methods, collated under the Joint Cetacean Database Programme (JCDP). The JCDP aims to streamline the process of accessing and utilising these data by collating the existing and forthcoming cetacean evidence base into a single resource. These data have a wide range of applications and have the potential to support analyses at a range of spatial and temporal scales. The JCDP database hosted by ICES stomach content database includes data from aerial and ship-based surveys from the Arctic waters, Greater North Sea, Northeast, Celtic seas and Bay of Biscay. Data from 74 distinct surveys are published here - Cornwall Wildlife Trust Marine Megafauna Ferry surveys~ 2010-2013, SCANS (Small cetaceans in the European Atlantic and North Sea)-94, SCANS-II and SCANS-III- spanning over the years 1994, 2005, 2009-2013 and 2016. The data are organised at an effort level (effort is a specific time interval within a survey, dedicated to the sightings of marine mammals), and sightings of different taxonomic groups are reported as occurrences. 5411 occurrences of marine mammals and a few other species are reported.