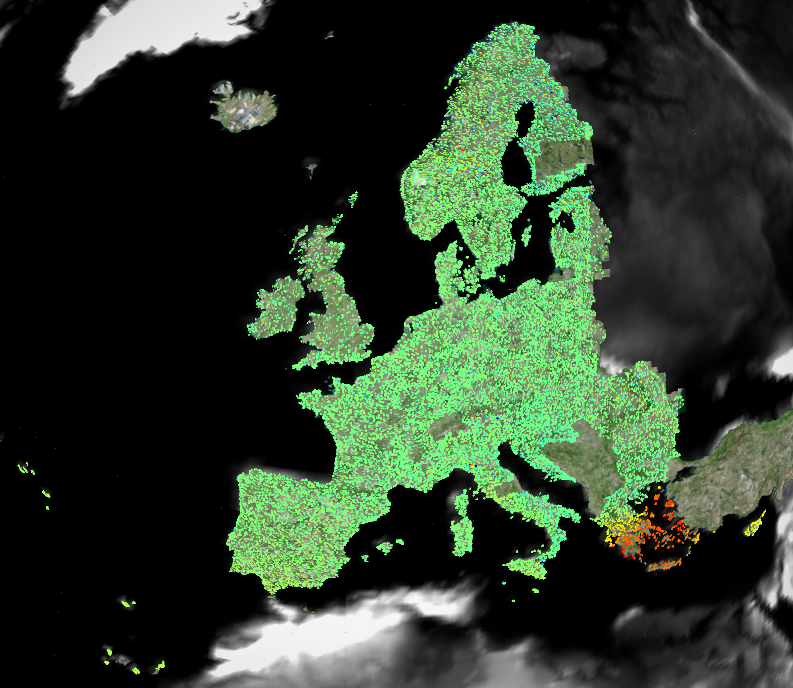
 Arctic SDI catalogue
2022
Type of resources
Available actions
Topics
Keywords
Contact for the resource
Provided by
Years
Formats
Representation types
Update frequencies
status
Service types
Scale
Resolution
-

Notagildi: Reitakerfi eru nauðsynlegt til að birta upplýsingar sem af einhverjum ástæðum er ekki hægt að birta stakar s.s. vegna persónuverndar, umfangs verkefnis eða nákvæmni þeirra upplýsinga sem fyrir liggja. Reitakerfi Íslands er með mismunandi reitastærðum til að mæta mismunandi þörfum notenda við upplýsingamiðlun. Mælt er með notkun reitakerfisins m.a. þegar verið er að bera gögn saman milli stofnana. Reitakerfið er byggt á Lambert Azimuthal Equal Area vörpun sem tryggir að allir reitir sé jafn stórir. En það er helsta skilyrði þess að reitakerfið sé Inspire tækt. Viðmiðun er ISN 2004 Ef reitakerfið er notað í einhverjum af ISN Lambert vörpunum er það ferhyrnt. Orðskýringar: Heildarkerfið er nefnt reitakerfi. Hvert lag í því er nefnt net. Einingar í netinu eru nefndar reitir. Heiti reitana: Hver reitur hefur nafn sem er einkvæmt og er m.a. byggt upp á stærðareiningunni. 1km 10km og 100m skrárnar ná yfir strandlínu og eyjar landsins en 100km skráin nær yfir alla efnahagslögsöguna. grid_100k grid_50k grid_25k grid_10k grid_5k grid_2_5k grid_1k grid_500m grid_250m grid_100m Frekari tækniupplýsingar er að finna hér https://inspire.ec.europa.eu/id/document/tg/gg
-
Happywhale.com is a resource to help you know whales as individuals, and to benefit conservation science with rich data about individual whales. Original provider: Happywhale Dataset credits: Happywhale and contributorsSupplemental information: Sightings and images were submitted to Happywhale by contributors. A portion of the Happywhale data were transferred to OBIS-SEAMAP upon the agreement between Happywhale and OBIS-SEAMAP. There may be duplicate records among Happywhale datasets and other OBIS-SEAMAP datasets. The precision of date/time vary per record. Some records have date accuracy up to year only. This dataset includes sightings and photos from the following 1 contributors in alphabetic order: Marilia Olio
-
The European Ground Motion Service (EGMS), part of the Copernicus Land Monitoring Service, provides consistent, regular, standardised, harmonised, and reliable information on natural and anthropogenic ground motion phenomena across Copernicus Participating States and national borders, with millimetre-level accuracy. This metadata describes EGMS Ortho, the third product level in the EGMS portfolio. EGMS Ortho is derived from EGMS Calibrated through a resampling procedure onto a 100 m grid, using data from both ascending and descending satellite orbits. This process generates two distinct layers: one representing purely vertical displacements and one representing purely east-west displacements (the subject of this metadata). EGMS Ortho simplifies interpretation for non-expert users by removing the need to account for satellite viewing geometry, offering a more intuitive representation of ground motion. EGMS Ortho is visualised as a vector map of measurement points colour-coded by average velocity (vertical or east-west components) and distributed to users in comma-separated values format. Each point is associated with a time series of displacement, i.e. a plot with values of displacement per acquisition of the satellite. EGMS Ortho is delivered to users on an annual basis, following a five-year moving window update strategy. This means that after the Baseline/first update (2016-2021), the following data periods are available: 2018-2022, 2019-2023 and 2020-2024.
-
Happywhale.com is a resource to help you know whales as individuals, and to benefit conservation science with rich data about individual whales. Original provider: Happywhale Dataset credits: Happywhale and contributorsSupplemental information: Sightings and images were submitted to Happywhale by contributors. A portion of the Happywhale data were transferred to OBIS-SEAMAP upon the agreement between Happywhale and OBIS-SEAMAP. There may be duplicate records among Happywhale datasets and other OBIS-SEAMAP datasets. The precision of date/time vary per record. Some records have date accuracy up to year only. This dataset includes sightings and photos from the following 4 contributors in alphabetic order: Amanda Urena; Hondius; MS Otto Sverdrup; Theo Vickers
-

The European Ground Motion Service (EGMS), part of the Copernicus Land Monitoring Service, provides consistent, regular, standardised, harmonised, and reliable information on natural and anthropogenic ground motion phenomena across Copernicus Participating States and national borders, with millimetre-level accuracy. This metadata describes the first product level of EGMS: Basic. EGMS Basic delivers InSAR displacement data in the satellite Line-of-Sight (LOS), accompanied by annotated geolocation and quality indicators for each measurement point. It is derived from full-resolution interferometric analysis of Sentinel-1 radar imagery and includes LOS velocity maps for both ascending and descending orbits. Each measurement is referenced to a local point within the processing unit, meaning ground motion values are only meaningful within that unit and cannot be directly compared across adjacent units. EGMS Basic is visualised as a vector map of measurement points, colour-coded by average LOS velocity, and distributed in comma-separated values (CSV) format. Each point includes a displacement time series, representing ground motion values for each Sentinel-1 acquisition over the monitoring period. EGMS Basic is delivered to users on an annual basis, following a five-year moving window update strategy. This means that after the Baseline/first update (2016-2021), the following data periods are available: 2018-2022, 2019-2023 and 2020-2024.
-
Happywhale.com is a resource to help you know whales as individuals, and to benefit conservation science with rich data about individual whales. Original provider: Happywhale Dataset credits: Happywhale and contributors Supplemental information: Sightings and images were submitted to Happywhale by contributors. A portion of the Happywhale data were transferred to OBIS-SEAMAP upon the agreement between Happywhale and OBIS-SEAMAP. There may be duplicate records among Happywhale datasets and other OBIS-SEAMAP datasets. The precision of date/time vary per record. Some records have date accuracy up to year only. This dataset includes sightings and photos from the following 2 contributors in alphabetic order: Marilia Olio; Sabine+Ulf
-
EMODnet Physics - Arctic Sea Ice Extend [2009 - ongoing] - Annual Max and Min contours. This product uses the Copernicus Marine Service product id. SEAICE_GLO_SEAICE_L4_NRT_OBSERVATIONS_011_001
-

The Season Length (LENGTH), one of the Vegetation Phenology and Productivity (VPP) parameters, is a product of the pan-European High Resolution Vegetation Phenology and Productivity (HR-VPP) component of the Copernicus Land Monitoring Service (CLMS). The Season Length is the number of days between the start and end dates of the vegetation growing season in the time profile of the Plant Phenology Index (PPI). The Plant Phenology Index (PPI) is a physically based vegetation index, developed for improving the monitoring of the vegetation growth cycle. The PPI index values, with 5-day satellite revisit cycle, are first used in a function fitting to derive the PPI Seasonal Trajectories, which is a filtered time series with regular 10-day time step. From these Seasonal Trajectories, a suite of 13 Vegetation Phenology and Productivity (VPP) parameters are then computed and provided, for up to two seasons each year. The Season Length is one of the 13 parameters. The full list is available in the table 3 of the Product User Manual in the below link section. A complementary quality indicator (QFLAG) provides a confidence level, that is described in table 4 of the same manual. The LENGTH dataset is made available as raster files with 10 x 10m and 100 x 100m resolutions, in ETRS89-LAEA projection corresponding to the HRL grid, for those tiles that cover the EEA38 countries and the United Kingdom and for two seasons in each year from 2017 onwards. It is updated in the first quarter of each year.
-
Medium Resolution Vegetation Phenology and Productivity: Season maximum date 2000-2025 (raster 392m)
The season maximum date (MAXD), one of the Vegetation Phenology and Productivity (VPP) parameters, is a product of the pan-European Medium Resolution Vegetation Phenology and Productivity (MR-VPP) component of the Copernicus Land Monitoring Service (CLMS). MAXD is the date (day of year) when vegetation reaches its maximum greenness or productivity during a growing season. The Plant Phenology Index (PPI) is a physically based vegetation index, developed for improving the monitoring of the vegetation growth cycle. The PPI index values, The PPI index values, withwith daily inputs, are first used in a function fitting to derive the PPI Seasonal Trajectories. From these Seasonal Trajectories, a suite of 13 Vegetation Phenology and Productivity (VPP) parameters are then computed and provided, for up to two seasons each year. The SOSD is one of the 13 parameters. The MAXD time series dataset is made available as raster files with 392 x 392m resolution, in ETRS89-LAEA projection corresponding to the MCD43 tiling grid. IMPORTANT: The full access to open and free data for this resource will be made available upon request.
-

The European Ground Motion Service (EGMS), part of the Copernicus Land Monitoring Service, provides consistent, regular, standardised, harmonised, and reliable information on natural and anthropogenic ground motion phenomena across Copernicus Participating States and national borders, with millimetre-level accuracy. This metadata describes EGMS Calibrated, which represents the second level of the EGMS portfolio and is considered the primary product due to its broad applicability. Unlike EGMS Basic, Calibrated provides absolute measurements, referenced to a model derived from Global Navigation Satellite System (GNSS) data. This calibration enables direct comparison of ground motion measurements across adjacent areas and between different products of the same level. EGMS Calibrated is delivered as a vector map of measurement points, each colour-coded by average velocity. Data is distributed in comma-separated values (CSV) format. Each point includes a displacement time series, representing ground motion values per satellite acquisition. The product is available for both ascending and descending satellite orbits. EGMS Calibrated is delivered to users on an annual basis, following a five-year moving window update strategy. This means that after the Baseline/first update (2016-2021), the following data periods are available: 2018-2022, 2019-2023 and 2020-2024.