 Arctic SDI catalogue

info-geoconnections-info-geoconnexions@nrcan-rncan.gc.ca
Type of resources
Available actions
Topics
Keywords
Contact for the resource
Provided by
Formats
Representation types
Update frequencies
status
-
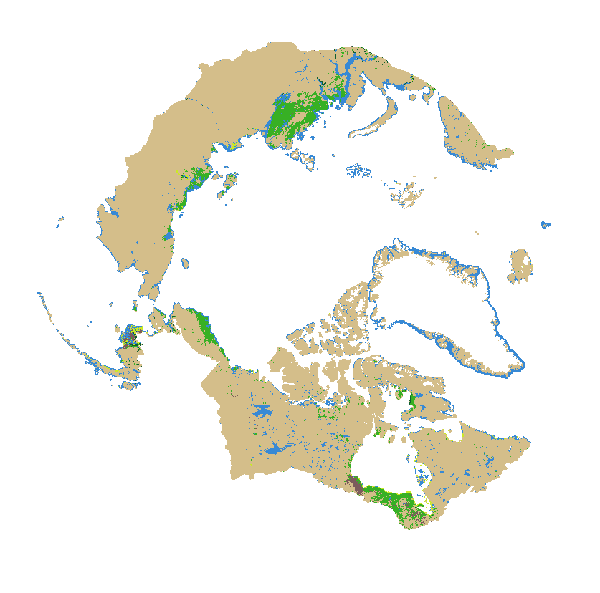
This dataset presents the first comprehensive, high-resolution (10-meter) wetland inventory map covering the entire 32.2 million square kilometers of the Pan-Arctic region, of which 14 million square kilometers (43%) is terrestrial and 18.4 million square kilometers (57%) is marine. Generated through advanced Earth Observation and machine learning techniques, the map was produced using multi-year (2020–2022), multi-source satellite imagery—including Sentinel‑1, Sentinel‑2, and ALOS PALSAR‑2—as well as various environmental features such as elevation. Over 1,000 wetland polygons were analyzed using an object-based random forest classification workflow on the Google Earth Engine cloud platform, achieving an average overall classification accuracy of 89%. The mapping extent was defined according to the Arctic Council’s Conservation of Arctic Flora and Fauna (CAFF) boundary, resulting in the identification of 2,947,618 km² of wetlands, representing 20% of the land area within the Pan-Arctic region. This dataset establishes a consistent and authoritative baseline for pan-Arctic wetlands, leveraging the latest advances in Earth Observation, machine learning, and cloud computing. The Canadian Wetland Classification System was used and includes the major wetland classes: bog, fen, marsh, swamp, and water. The overall wetlands coverage by country within the CAFF boundary was: Canada (27%), United States of America (i.e., Alaska 39%), Finland (31%), Iceland (8%), Norway (17%), Sweden (26%), Kingdom of Denmark (i.e., Greenland 1%), and the Russian Federation (21%). Development of this product was undertaken by Natural Resource Canada's Canada Centre for Mapping and Earth Observation and the Canadian Geospatial Data Infrastructure Division in collaboration with the Arctic Council’s CAFF biodiversity group, CAFF Wetland Experts Group, national organisations mandated to monitor wetlands, and Arctic National Mapping Agencies, and Canadian company C-CORE, integrating ground truth data collected from Alaska, Finland, Sweden, and the Kingdom of Denmark through partner agencies and digital image interpretation. More than 60,000 images (2020-2022), primarily covering summer periods, were processed to ensure robust results. This dataset provides essential baseline information for Earth Observation monitoring of climate change impacts and supports critical environmental surveillance for Arctic and remote northern communities.