 Arctic SDI catalogue
Arctique
Type of resources
Available actions
Keywords
Contact for the resource
Provided by
Years
Representation types
Update frequencies
status
Service types
Scale
-
Concentrations of sea pens, small and large gorgonian corals and sponges on the east coast of Canada have been identified through spatial analysis of research vessel survey by-catch data following an approach used by the Northwest Atlantic Fisheries Organization (NAFO) in the Regulatory Area (NRA) on Flemish Cap and southeast Grand Banks. Kernel density analysis was used to identify high concentrations. These analyses were performed for each of the five biogeographic zones of eastern Canada. The largest sea pen fields were found in the Laurentian Channel as it cuts through the Gulf of St. Lawrence, while large gorgonian coral forests were found in the Eastern Arctic and on the northern Labrador continental slope. Large ball-shaped Geodia spp. sponges were located along the continental slopes north of the Grand Banks, while on the Scotian Shelf a unique population of the large barrel-shaped sponge Vazella pourtalesi was identified. The latitude and longitude marking the positions of all tows which form these and other dense aggregations are provided along with the positions of all tows which captured black coral, a non-aggregating taxon which is long-lived and vulnerable to fishing pressures.
-
%20density%20along%20a%20latitudinal%20gradient%20of%20sea-ice%20conditions.jpg)
PURPOSE: Ringed seals (Pusa hispida) rely on sea ice as habitat throughout their life history and inhabit a broad latitudinal range with diverse sea-ice conditions. Anthropogenic climate warming is triggering poleward species redistributions, highlighting the importance of understanding how species distributions and abundance vary along latitudinal gradients. Using ringed seals as a model species, the purpose was to estimate density via aerial surveys along a latitudinal gradient in the eastern Canadian Arctic to investigate latitudinal trends in the ringed seals response to regional variation in sea-ice conditions. DESCRIPTION: Ringed seals (Pusa hispida) rely on sea ice as habitat throughout their life history and inhabit a broad latitudinal range with diverse sea-ice conditions, making them a model species to study patterns in density along a spatial-environmental gradient. We estimated the density of ringed seals from systematic aerial surveys along a latitudinal gradient in the eastern Canadian Arctic to investigate latitudinal trends in the ringed seals response to regional variation in sea-ice conditions. Ringed seals exhibited similar densities at lower and intermediate latitudes, while higher latitudes displayed an order of magnitude lower ringed seal density. This shift is concurrent with the transition in ice conditions from predominantly first-year ice at lower latitudes to primarily multiyear ice at higher latitudes. These findings indicate that the variation in icescapes across the ringed seal’s vast range influences their density. The shift in sea-ice conditions may also have consequences for biological productivity that supports their diet. Our results highlight a likely non-uniform response of ringed seals to ongoing sea-ice recession across the Arctic.
-
Concentrations of sea pens, small and large gorgonian corals and sponges on the east coast of Canada have been identified through spatial analysis of research vessel survey by-catch data following an approach used by the Northwest Atlantic Fisheries Organization (NAFO) in the Regulatory Area (NRA) on Flemish Cap and southeast Grand Banks. Kernel density analysis was used to identify high concentrations. These analyses were performed for each of the five biogeographic zones of eastern Canada. The largest sea pen fields were found in the Laurentian Channel as it cuts through the Gulf of St. Lawrence, while large gorgonian coral forests were found in the Eastern Arctic and on the northern Labrador continental slope. Large ball-shaped Geodia spp. sponges were located along the continental slopes north of the Grand Banks, while on the Scotian Shelf a unique population of the large barrel-shaped sponge Vazella pourtalesi was identified. The latitude and longitude marking the positions of all tows which form these and other dense aggregations are provided along with the positions of all tows which captured black coral, a non-aggregating taxon which is long-lived and vulnerable to fishing pressures.
-

With this update the Canadian Hydrographic Service (CHS) offers both a complete inventory of bathymetric data free to the public for non-navigational as well as, for the first time, a collection of intensity image data products. To meet a growing desire in the scientific, commercial, environmental, and Indigenous communities for backscatter intensity data, the Canadian Hydrographic Service (CHS) has embarked on a Pilot Project to produce and distribute intensity imagery products from our current multibeam echo sounder (MBES) and LiDAR data holdings. MBES and LiDAR sensors collect two types of data, seafloor depth and backscatter intensity. The seafloor depth, or bathymetry is well represented on the CHS NONNA Data Portal. These products are available in a spatial resolution of 10 metres or 100 metres. While typically outside of our primary focus on bathymetry and charting for safe navigation, the CHS recognizes the importance of intensity data for the purposes of environmental and ecosystem management as well as the economic benefits associated with increased understanding of our marine environment. Backscatter intensity data, recorded in decibels (dB) is a measure of the strength of the return of a MBES pulse from the ocean floor to the multibeam receiver. These measures may be visualized as grey scale intensity map imagery. Backscatter intensity imagery can provide researchers with information about the surficial geology of the seafloor or objects on it. For example, hard, rocky materials will reflect more sound energy than softer materials such as mud. To be clear, the CHS is not attempting to create fully normalized and ground-truthed backscatter products. The CHS’s intensity and reflectance data holdings may be best understood as ‘collateral’ data encoded within the raw datagrams collected during MBES & LiDAR bathymetric surveys. **NEW** CHS NONNA INTENSITY A CHS NONNA Intensity product package is a ZIP file containing either an ASCII (x.y,dB) and/or a GEOTIFF image (w. intensity band) and the available metadata file. Variations in Intensity product resolution and quality are dependent on the contributing source data. TERMS OF USE To directly access the CHS NONNA Data Portal please follow this link - https://data.chs-shc.ca/login (Note: The data portal is NOT compatible with Internet Explorer browser). The Canadian Hydrographic Service (CHS) NONNA Data products are for NON-NAVIGATIONAL USE ONLY. Please see the Open Data Licence below and the CHS NONNA LICENCE viewable on https://data.chs-shc.ca/login and downloadable with the NONNA data, for the full terms and conditions governing the use of this data. ----- PRODUCT DESCRIPTION ----- The « NONNA » refers to the NON-Navigational nature of the data. Intensity data products contain NO depth information and as such are COMPLETELY UNSUITABLE FOR NAVIGATIONAL PURPOSES. The CHS NONNA Intensity Data products are packaged as a ZIP file containing an ASCII and/or GEOTIFF image dataset and a related metadata file. Resolution for data sources varies from data sources to data source and is dependent on the resolution of the source data it was derived from. The Intensity data supplied will be from various survey platforms, using a variety of MBES systems over the full extent of the CHS’s implementation of MBES and LiDAR surveying. All survey data provided will have been collected and processed to CHS data acquisition standards, which is to say these data were COLLECTED FOR THE EXPRESS PURPOSE OF SAFETY OF NAVIGATION and the need to maintain and update sounding data for CHS charts. Best practices for collecting MBES bathymetric data are not necessarily best practices for surveys where the express purpose is the production of intensity data products. As such, the data in our Archives may not have been collected to a standard best suited for producing high quality intensity data products. ----- DATUM ----- All CHS NONNA data sources are horizontally referenced to the World Geodetic System 1984 (WGS84) ESPG4326. CHS NONNA Intensity products contain no depth values and as such require no vertical reference. ----- DATA PRESENTATION ----- CHS NONNA Intensity products adhere to a different naming convention than the CHS NONNA Bathymetric products. Each product name has an unique ID that references the lineage of the contributing hydrographic source. Each contributing source is a hydrographic survey conducted by a single vessel using a single MBES. These products are available to view, query and download via the CHS NONNA Data Portal. The CHS NONNA Intensity products are ZIP files that contain product coverage (at varying resolution). The following formats are available for download: • 32-bit GeoTIFF • ASCII (XYI) These formats can be opened using a wide variety of GIS applications. *NOTE:* Gaps in the data may be visible where modern surveys have not yet been conducted, the data is not updated to Chart Datum (CD) or where legacy data has not yet been digitized. In addition, there may be data sources removed from the CHS NONNA Data Portal for further processing in the CHS’ Bathymetric Database, and as such, these datasets will not be available until such work is complete. Our investigation has uncovered existing intensity data products in our Archives that will be available for distribution immediately. However, there is a wealth of intensity near to completion. CHS NONNA Intensity products will be published as they become available. Data sources included in the CHS NONNA products may not have been subjected to the same level of quality assurance as those in official navigational products. *HELP* New users of the CHS NONNA Data Portal are encouraged to fully review the 'CHS NONNA Data Portal Guidance Document' (PDF) which is available below in the RESOURCES section of this page. • Publisher - Current Organization Name: Fisheries and Oceans Canada • Licence: Open Government Licence - Canada
-
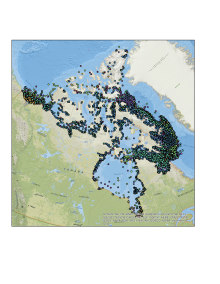
This dataset contains point distribution occurrences for fish species found in marine waters of Arctic Canada. It was used to create the distribution maps in the book Marine Fishes of Arctic Canada, edited by B.W. Coad and J.D. Reist (2018) and the DFO Data Report of Fisheries and Aquatic Sciences Distributional Records for Marine Fishes of Arctic Canada (Alfonso et al. 2018). The database includes literature (Coad and Reist 2016) and museum records, anecdotal reports, personal communications and data from fisheries surveys and exploratory cruises. Development of the database began in 1998 and data entry ceased in 2016, although the database will be updated periodically. Consult the book (Coad and Reist 2018) and the Data Report (Alfonso et al. 2018) for further details in regards to the specific sources for each data point by species especially those from sources other than published literature.
-

Polygons denoting concentrations of sea pens, small and large gorgonian corals and sponges on the east coast of Canada have been identified through spatial analysis of research vessel survey by-catch data following an approach used by the Northwest Atlantic Fisheries Organization (NAFO) in the Regulatory Area (NRA) on Flemish Cap and southeast Grand Banks. Kernel density analysis was used to identify high concentrations and the area occupied by successive catch weight thresholds was used to identify aggregations. These analyses were performed for each of the five biogeographic zones of eastern Canada. The largest sea pen fields were found in the Laurentian Channel as it cuts through the Gulf of St. Lawrence, while large gorgonian coral forests were found in the Eastern Arctic and on the northern Labrador continental slope. Large ball-shaped Geodia spp. sponges were located along the continental slopes north of the Grand Banks, while on the Scotian Shelf a unique population of the large barrel-shaped sponge Vazella pourtalesi was identified. The latitude and longitude marking the positions of all tows which form these and other dense aggregations are provided along with the positions of all tows which captured black coral, a non-aggregating taxon which is long-lived and vulnerable to fishing pressures. These polygons identify sponge grounds from the broader distribution of sponges in the region as sampled by Cosmos gear in the Eastern Arctic biogeographic zone. A 40 kg minimum threshold for the sponge catch was identified as the weight that separated the sponge ground habitat from the broader distribution of sponges with these research vessel tow data and gear type.
-
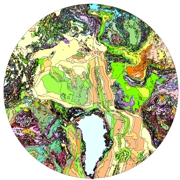
As part of the International Polar Year (IPY) 2007'08 and 2008'09 activities, and related objectives of the Commission for the Geological Map of the World (CGMW), nations of the circumpolar Arctic have co-operated to produce a new bedrock geology map and related digital map database at a scale of 1:5 000 000. The map, released in north polar stereographic projection using the World Geodetic System (WGS) 84 datum, includes complete geological and physiographic coverage of all onshore and offshore bedrock areas north of latitude 60° north.