 Arctic SDI catalogue
Compilation
Type of resources
Categories
Available actions
Topics
Keywords
Contact for the resource
Provided by
Formats
Representation types
Update frequencies
status
Scale
-

__The link: *Access the data directory* is available in the section*Dataset Description Sheets; Additional Information*__. **The results of compilations by forel** are one of the deliverables of the ecoforest inventory in southern Quebec. These results are used to produce forest compilations by stand associated with the original ecoforest map. The forel corresponds to a forest pixel with a resolution of 20 meters by 20 meters. These results are presented in the form of matrix mapping (image in raster format) to assess the variability of the various dendrometric characteristics within the same forest stand. Here is the list of variables presented in this map: gross market volume per hectare, basal area per hectare and number of stems per hectare. These results are intended to provide small-scale information that can, among other things, support the planning of forest operations. They cover ecoforest stands 7 m or more in height. For commercial stems, a separate matrix file is produced for each of the three variables and each of the species, attribution groups, species types and for the total all species. For saplings (stems of 9 cm or less in diameter), only results for basal area and the number of stems per hectare for species types and for the total of all species are produced. The information contained in this map is an image of the forest in the year the aerial photograph was taken. The results of this forest compilation method will eventually cover most of the territory south of the 52nd parallel. When achieved, the results are disseminated by planning unit (AU) for the territories produced under the fourth inventory and by ecological planning unit (UPE) for the territories produced as part of the fifth inventory. __ ⚠️ Notes: __ Consult the [original ecoforest map and current inventory results] ] (https://www.donneesquebec.ca/recherche/dataset/resultats-d-inventaire-et-carte-ecoforestiere) for the results of forest compilations by population, also available on Data Quebec. **This third party metadata element was translated using an automated translation tool (Amazon Translate).**
-

The map data set includes the basic maps of the City. It is a representation of the territory of the city of Montreal on a large and medium scale (1:1000, 1:5000, etc.). The presentation of land use is composed of elements produced mainly by photogrammetry and complemented by various techniques, at specific dates. It is a geometric and conventional representation of Montreal's territory in 2D+1 (X, Y + altitude ratings or level curves). The main purposes of the basic mapping product are territorial planning and public consultation. The breakdown of the SQRC 1:1000 sheets is available [here] (/city-of-montreal/quadrillage-sqrc).**This third party metadata element was translated using an automated translation tool (Amazon Translate).**
-
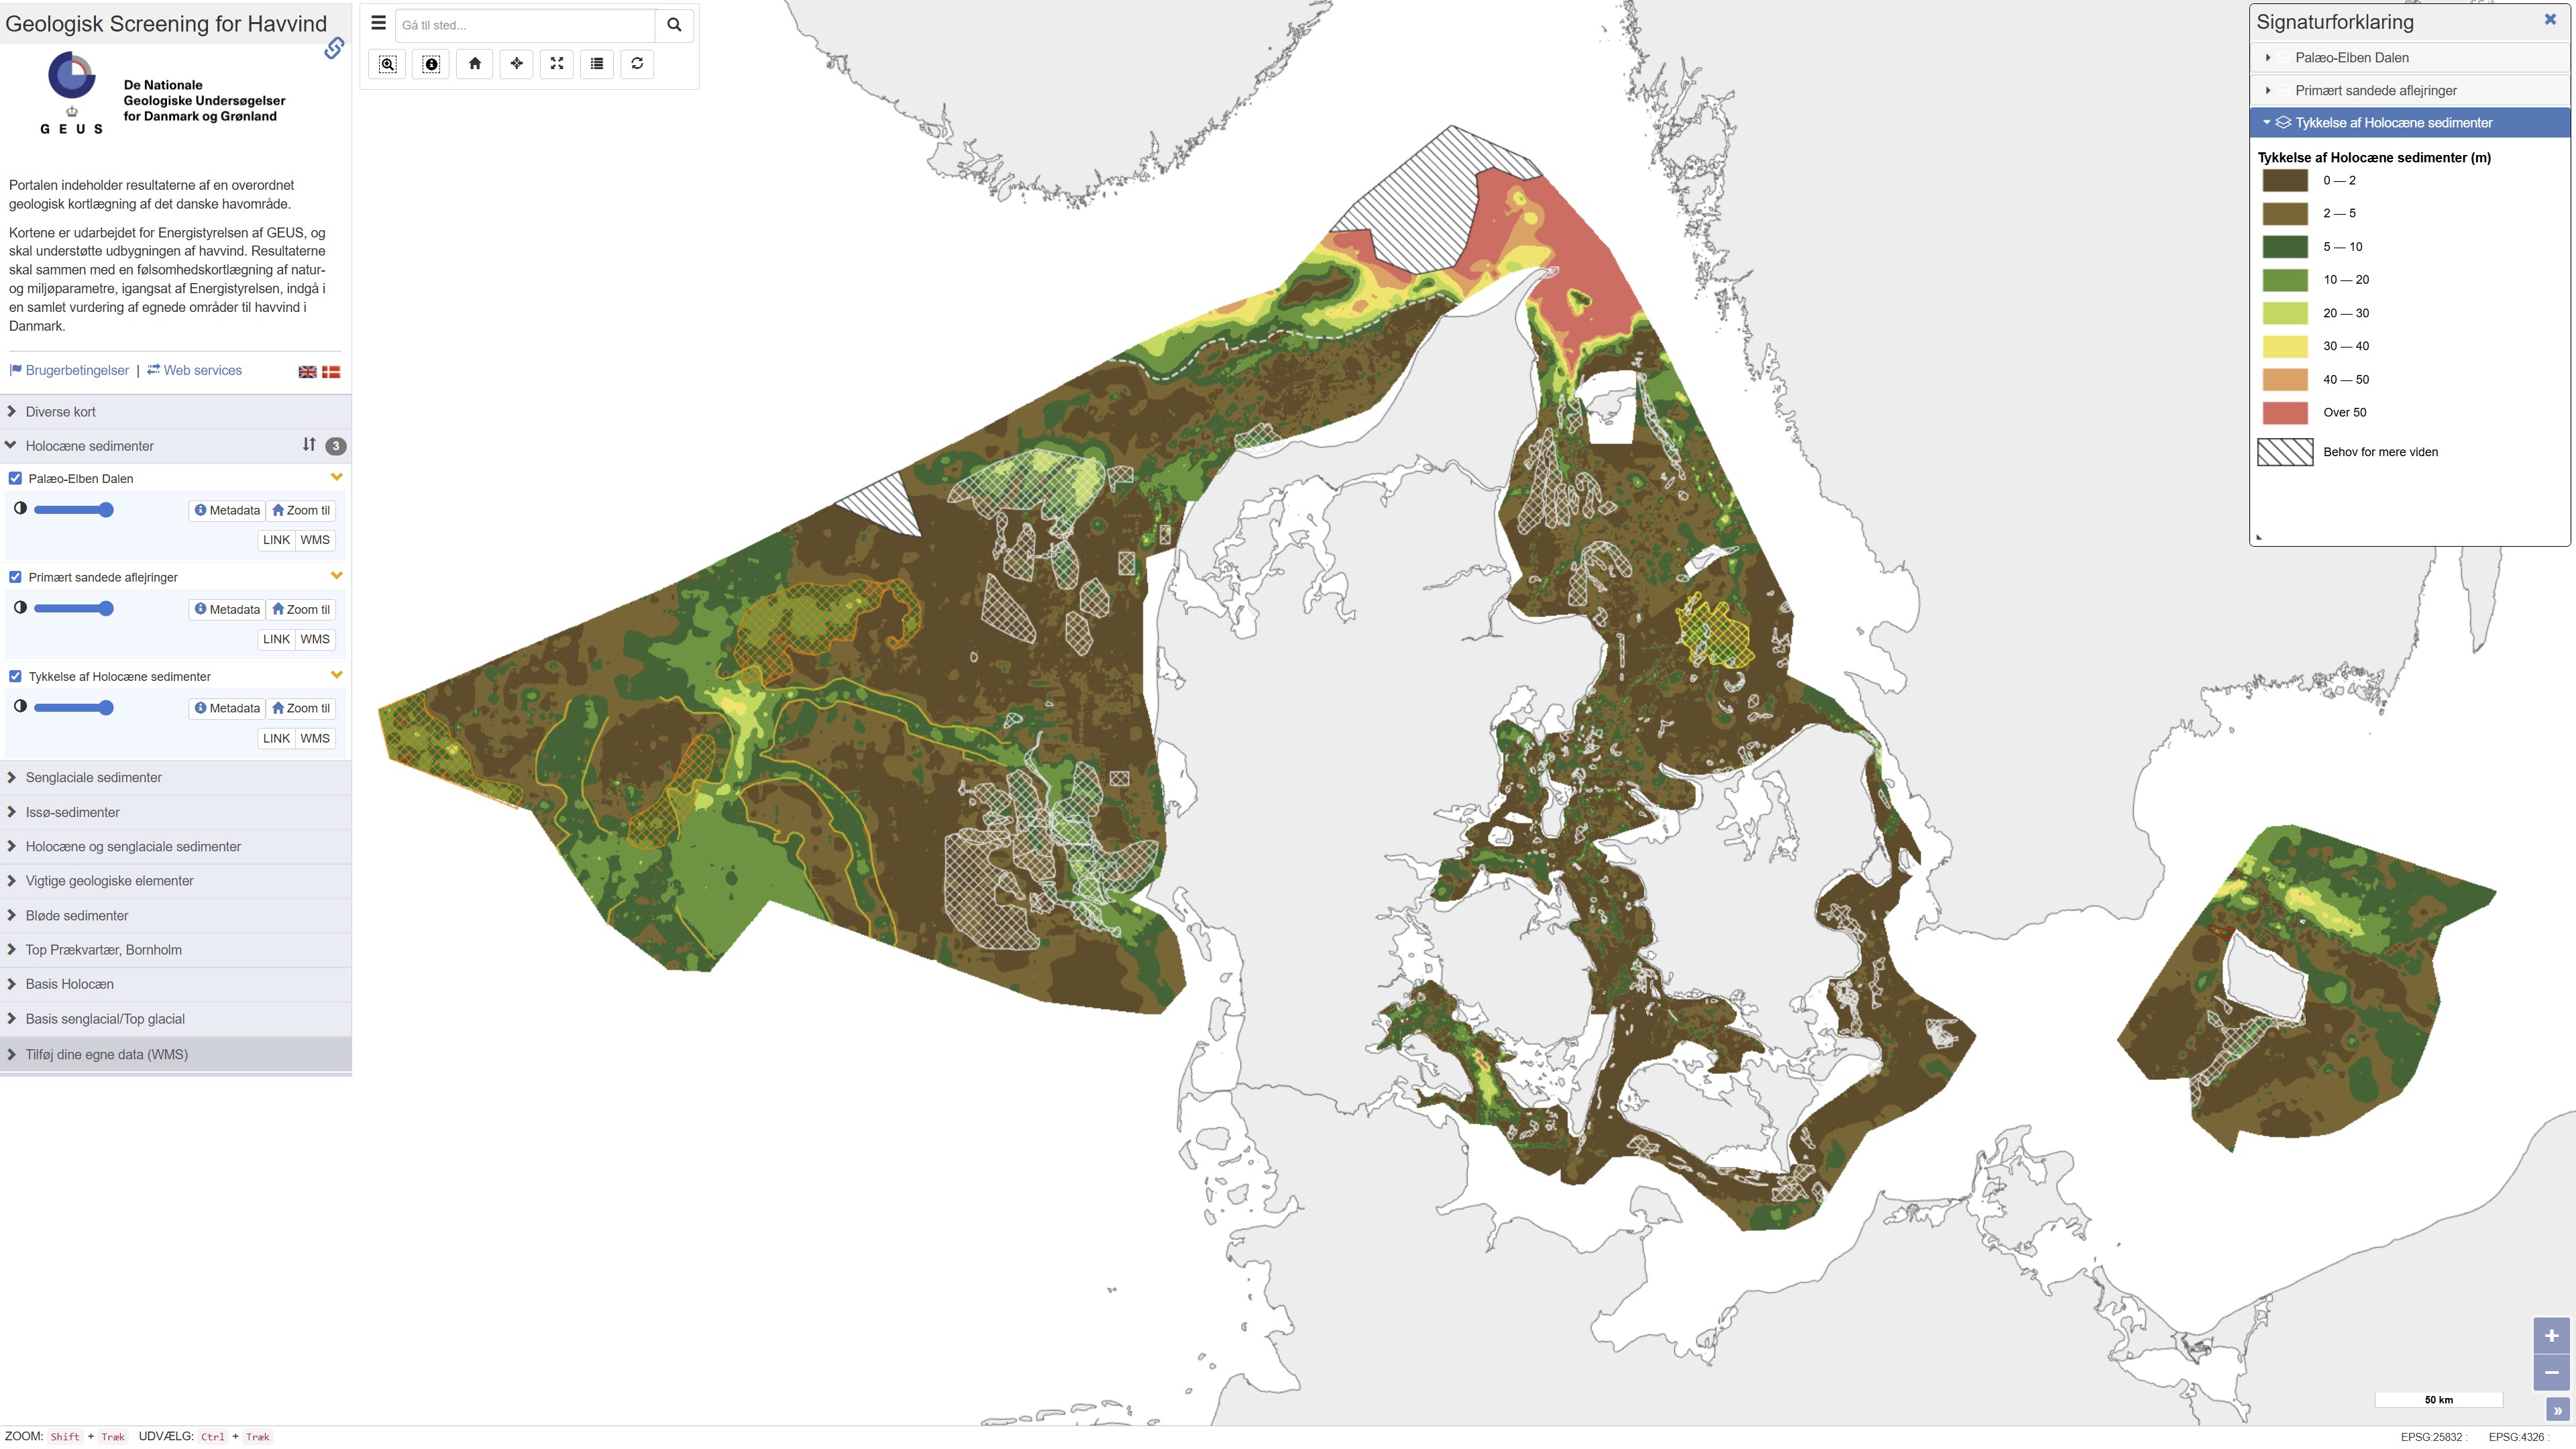
This repository contains maps of the thickness of late glacial and Holocene deposits in the Danish sea area, prepared as a basis for planning offshore wind. These are unconsolidated sediments that have not been overrun by the ice sheets of the ice ages, and therefore may have low geotechnical strength parameters. This is a large-scale and very general mapping, and no detailed interpretation of the distribution of sand and clay/mud/silt, respectively, has been made. In relation to the foundations of offshore wind turbines, sandy deposits will typically not pose a challenge, while soft deposits of clay, mud and silt in large thicknesses are assumed to pose foundation challenges. In addition to separate maps of the thickness of late glacial and Holocene deposits, a map of the total thickness of these two units has also been prepared, which thus constitutes a map of the total thickness of potentially soft sediments. Finally, the thickness of potentially soft sediments is used to divide the Danish sea area into categories in relation to the probability of larger thicknesses of soft sediments that could give rise to foundation challenges. Other maps are the thickness of potentially soft glacial lake sediments in the North Sea, the depth to the Pre-Quaternary surface in the waters around Bornholm, as well as the depth to the base of the Holocene deposits and the depth to the base of the late glacial deposits/top of the glacial deposits in the Danish sea area. As a supplement to the maps, a number of themes show where the late glacial and Holocene deposits are primarily expected to consist of sandy sediments. In addition, a number of themes show the Danish exclusive economic zone (EEZ), the location of conceptual geological models that can be seen in the overall report, all interpreted seismic lines, areas with near-surface gas in the sediments, interpreted distribution of the Palaeo-Elbe Valley in the North Sea, distribution of the Weichsel ice and ice-affected sediments in the North Sea, buried valleys (Prins & Andresen 2019; van der Vegt et al. 2012; Ottesen et al. 2020; Kirkham et al. 2024; Sandersen & Jørgensen 2016), structural elements (Al Hseinat & Hübscher 2017; Jensen et al. 2002), ice margin lines (Lange 1984; Kjær et al. 2003; Pedersen 2005; Phillips et al. 2018, 2022; Kirkham et al. 2024; Szuman et al. 2024; Pedersen & Boldreel 2017). The data basis for the work has primarily been new and existing near-surface seismic data and vibrocore drilling. The mapping was carried out for the Danish Energy Agency by GEUS, and is intended to support the development of offshore wind. The results, together with a sensitivity mapping of natural and environmental parameters, initiated by the Danish Energy Agency, are to be included in an overall assessment of suitable areas for offshore wind in Denmark.