 Arctic SDI catalogue
JPG
Type of resources
Topics
Keywords
Contact for the resource
Provided by
Formats
Representation types
Update frequencies
status
-

PURPOSE: To provide a permanent repository of key data series necessary to build a range-wide American eel stock assessment. DESCRIPTION: This collection presents data associated with the following report: Cairns, D.K. 2020. Landings, abundance indicators, and biological data for a potential range-wide American eel stock assessment. Canadian Data Report of Fisheries and Aquatic Science. No. 1311: v + 180 pp. Much of the data collection is from the Atlantic Provinces of Canada, particularly the Southern Gulf of St. Lawrence. The collection also includes data from elsewhere in the American eel's range in Canada, and also the United States and the Caribbean Basin. Files in the collection are as follows. Cairns2020_AnnexA_ReportTables.xlsx: This Excel file (file size 756 kb) contains all 37 tables in Cairns (2020) exactly as they appear in the report. Cairns2020_AnnexB_EelLengthsAgesEfishingRecords.xlsx: This Excel file (file size 3.1 mb) contains 20,047 records of American eel lengths and other biological data from the Canadian Atlantic Provinces, 1983-2017. Records include weights of 8,915 eels and ages of 2,212 eels. Records of 3,224 electrofishing sessions in the Miramichi River, New Brunswick, 1952-2019, and records of 2,590 electrofishing sessions in the Restigouche River, New Brunswick, 1972-2019 are included. Cairns2020_AnnexC_EelLengthsAgesDataDefinitions.csv: This .csv file (file size 4 kb) gives data definitions in English and French for the table of eel lengths and other biological data that is contained in Cairns2020_AnnexB_EelLengthsAgesEfishingRecords.xlsx and in Cairns2020_AnnexD_EelLengthsAges.csv. Cairns2020_AnnexD_EelLengthsAges.csv: This file (file size 2.0 mb) presents in .csv format the table of eel lengths and other biological data that is also presented in Cairns2020_AnnexB_EelLengthsAgesEfishingRecords.xlsx. Cairns2020_AnnexE_EelEFishingDataDefinitions.csv: This .csv file (file size 2 kb) gives data definitions in English and French for the table of eel electrofishing data that is contained in Cairns2020_AnnexB_EelLengthsAgesEfishingRecords.xlsx and in Cairns2020_AnnexD_EelLengthsAges.csv. Cairns2020_AnnexF_EelEFishing.csv: This file (file size 314 kb) presents in .csv format the table of eel electrofishing data that is also presented in Cairns2020_AnnexB_EelLengthsAgesEfishingRecords.xlsx. Cairns2020_AnnexG_OtolithImageMetadata.csv: This .csv file (file size 2 kb) provides metadata for the collection of eel otolith images. Files with names starting with EelOtos . . . . : These .tif, .jpg, and .bmp image files are in zipped format with a summed size of 5.3 gb. The files give magnified photos of 1,838 eel otoliths that have been prepared for age reading. Samples are from the Atlantic Provinces of Canada. Individual otolith codes in Cairns2020_AnnexB_EelLengthsAgesEfishingRecords.xlsx and in Cairns2020_AnnexC_EelLengthsAgesDataDefinitions.csv match the codes embedded in otolith image filenames. PARAMETERS COLLECTED: American eel landings, number caught, and effort of commercial and research fishing gear. American eel lengths, ages, sex and other biological data and sampling locations. NOTES ON QUALITY CONTROL: All keypunched records of landings, densities, and other data were verified against original sources. Landings and abundance indices were reviewed in a Department of Fisheries and Oceans scientific workshop and corrected as necessary. Length and age data were examined by length-weight and length age plots and implausible records were discarded. PHYSICAL SAMPLE DETAILS: No physical samples SAMPLING METHODS: Landings are from government fisheries agencies. Abundance indices are from commercial fyke, spear, and trap catch per unit effort, and from research ladder counts and electrofishing records. Mean elver lengths are compiled from published literature Sex ratios are compiled from published literature Locations of biological and genetic sampling are compiled from published literature American eel lengths are total length of live specimens. Ages are from otolith annulus readings Electrofishing records are from backpack electrofishing surveys in wadeable waters USE LIMITATION: To ensure scientific integrity and appropriate use of the data, we would encourage you to contact the data custodian.
-

The Atlas of Canada’s Wireless Data Network map illustrates the availability of LTE and 5G wireless data service across Canada in 2024. It features an inset map and a bar graph that provide additional insights. The inset map shows the percentage of population in each province with access to 5G service. The bar graph shows the percent of population without access 5G service by year, dating back to 2020. The Atlas of Canada Wireless Data Network map is shown at a scale of 1:6 000 000. It is part of the new Atlas of Canada series, which features a shared look and feel across all map products to ensure consistency in design and layout. This map supports the Communication and Transportation theme, one of five core themes featured in the renewed Atlas of Canada web presence at atlas.gc.ca. The common design helps make Atlas of Canada products easier to read, compare, and use together across the Atlas collection. Use the Atlas of Canada site to find places, digital maps, facts, geographical information and learning resources about Canada. Source: Canadian Radio-television and Telecommunications Commission (CRTC), 2024.Current trends - Mobile wireless. https://crtc.gc.ca/eng/publications/reports/PolicyMonitoring/mob.htm If you have questions about CRTC data, e-mail info@crtc.gc.ca. Produced by the Canada Centre for Mapping and Earth Observation, the Geoscience and Earth Monitoring Sector, Natural Resources Canada. 2025.
-

The Atlas of Canada High Speed Internet Network map illustrates the availability of high-speed internet across Canada in 2024. High speed internet service is broken up into 4 download speeds in Megabits per second. 25 Mbps, 50 Mbps, 100 Mbps, and Gigabit (940 Mbps). It features an inset map and a bar graph that provide additional insights. The inset map shows the percentage of population in each province with access to 50 Mbps internet. The bar graph shows the percent of population without access 50 Mbps internet by year, dating back to 2018. The Atlas of Canada High Speed Internet Network map is shown at a scale of 1:6 000 000. It is part of the new Atlas of Canada series, which features a shared look and feel across all map products to ensure consistency in design and layout. This map supports the Communication and Transportation theme, one of five core themes featured in the renewed Atlas of Canada web presence at atlas.gc.ca. The common design helps make Atlas of Canada products easier to read, compare, and use together across the Atlas collection Use the Atlas of Canada site to find places, digital maps, facts, geographical information and learning resources about Canada. Source: Canadian Radio-television and Telecommunications Commission (CRTC), 2025. Current trends - High-speed broadband. https://crtc.gc.ca/eng/publications/reports/PolicyMonitoring/ban.htm If you have questions about CRTC data, e-mail info@crtc.gc.ca. Produced by the Canada Centre for Mapping and Earth Observation, the Geoscience and Earth Monitoring Sector, Natural Resources Canada. 2025.
-
The federal Whales Protection Initiative began in 2018. The first phase of this five‑year initiative focused primarily on the Southern Resident Killer Whale (Orcinus orca). The second phase of the initiative, which took place from April 2023 to March 2026, made it possible to allocate additional resources to support efforts targeting the St. Lawrence Estuary Beluga (Delphinapterus leucas). The threats identified in the Recovery Program for the St. Lawrence Estuary Beluga population under the Species at Risk Act (SARA) include, among others, habitat loss and disturbance, reduced prey abundance, quality, and availability, human‑induced disturbance, and the presence of contaminants. (https://www.canada.ca/fr/environnement-changement-climatique/services/registre-public-especes-peril/programmes-retablissement/beluga-population-estuaire-saint-laurent/chapitre-2.html#s1_5) As part of Initiative 2.0, the team responsible for monitoring and water quality surveillance at Environment and Climate Change Canada (ECCC) conducted sampling of freshwater, sediments, and biota at the mouths of major freshwater tributaries flowing into the beluga’s critical habitat. This sampling program aimed to document the concentrations and detection frequency of contaminants considered to be of concern. The team also sought to test a multi‑matrix approach by collecting water, sediment, and biota samples at the same locations and at the same time. The sampling sites are located around Québec City (St. Lawrence River, Boyer River, Saint‑Charles River, Sainte‑Anne‑de‑Beaupré River, Aulneuse River, Etchemin River), within the critical habitat area (Tadoussac, Moulin‑à‑Baude River, Sainte‑Marguerite River, Mars River, Essipit), as well as within the area proposed for critical habitat expansion (Rivière‑du‑Loup, Isle‑Verte River, Cacouna, Trois‑Pistoles River, Bic Park). The lists of sampling sites and targeted contaminants were adjusted as the program evolved. Sampling frequency was established based on the matrices.
-
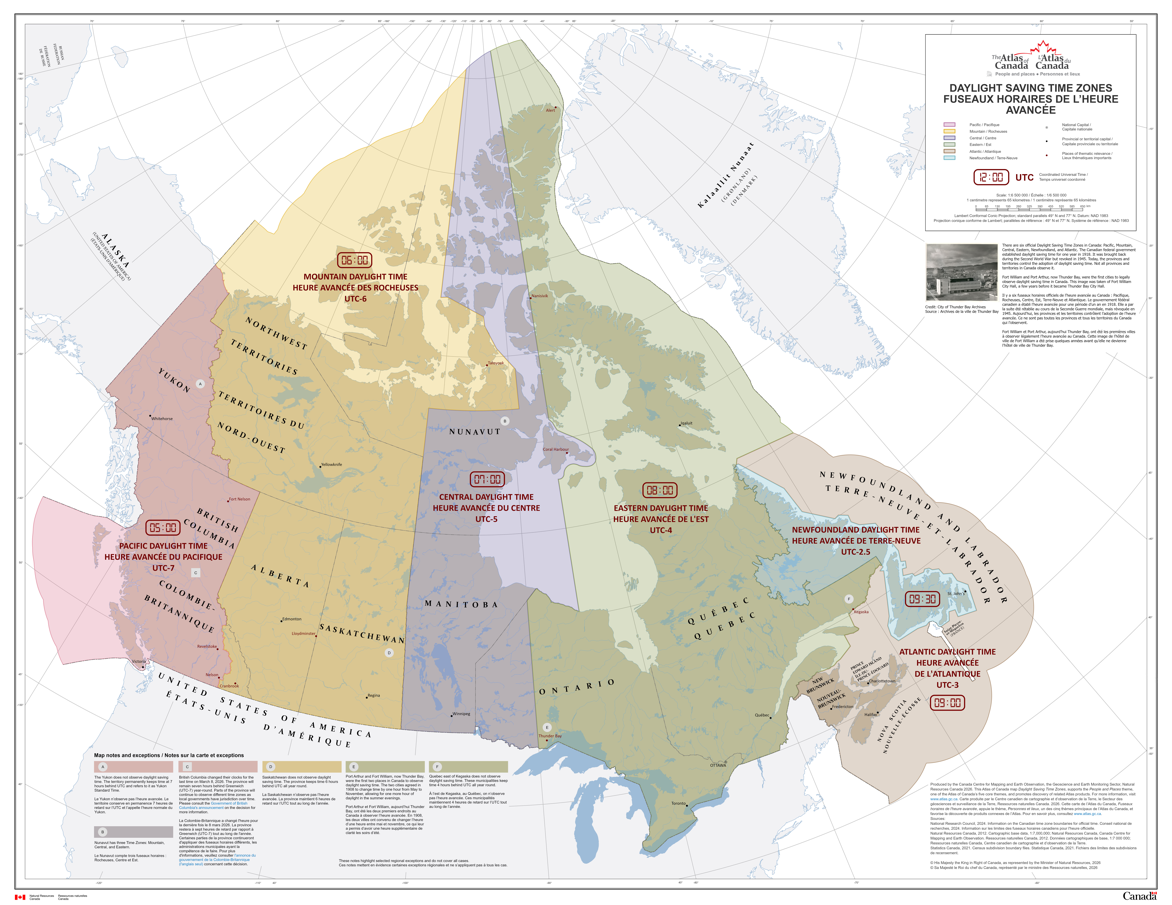
There are six official time zones in Canada: Pacific, Mountain, Central, Eastern, Newfoundland, and Atlantic. All time zone boundaries in Canada are regulated by the provinces and territories. This record contains maps and data for both legislated Standard Time and Daylight Saving Time boundaries. Daylight Saving Time occurs every year; it starts on the second Sunday in March and ends on the first Sunday in November. However, the Yukon, Saskatchewan and parts of British Columbia, Quebec and Nunavut do not observe Daylight Saving Time. The changes to Pacific time announced on March 2, 2026, by the Government of British Columbia are not reflected in this dataset. Please consult the [Government of British Columbia's announcement](https://news.gov.bc.ca/releases/2026AG0013-000209#:~:text=B.C.%27s%20new%20time%20zone,%20Pacific%20time,%20will,and%20other%20regions%20observing%20mountain%20standard%20time) for more information. The maps and data were produced by the Canada Centre for Mapping and Earth Observation (CCMEO) at Natural Resources Canada. The time zone boundary lines were created from information provided by the National Research Council who are responsible for official time in Canada.
-

Major Drainage Areas (MDA), as portrayed in this map, are part of the Standard Drainage Area Classification (SDAC) which was developed by Natural Resources Canada, in partnership with Statistics Canada, and Environment and Climate Change Canada. A drainage area, as opposed to a drainage basin or watershed, is a unit of statistical aggregation used for reporting purposes based upon drainage patterns and the underlying basins, delimited by a drainage divide. A drainage basin, sometimes called a watershed, is an area where all surface water shares the same drainage outlet. Surface water consists of water flowing on the surface of the earth that develops into larger streams and eventually combines to form a river. The 11 MDAs presented in this map comprise the uppermost level in the drainage area classification system which then divides into 164 sub-drainage areas, and then is further divided into 974 sub-sub-drainage areas. Relief was derived from the merging of two raster data sets, both resampled to 804 metre resolution: - High Resolution Digital Elevation Model (HRDEM) – CanElevation Series - Canadian Digital Elevation Model, 1945-2011 Further information on all these maps can be found on the Atlas of Canada web site atlas.gc.ca.
-

PURPOSE: An aerial survey of the Western Hudson Bay beluga whale (Delphinapterus leucas) population was conducted on August 19th, 2015 to provide a population estimate. Surveys were flown in a DeHavilland Twin Otter (DH-6) fitted with four bubble windows and an optical glass-covered camera hatch at the rear underbelly of the plane. A Global Positioning System (GPS) unit logged the position, altitude, speed, and heading of the aircraft each second. Surveys were initially flown at a target ground speed of 100 knots (185 km/h), and target altitudes of 1,000 ft (305 m) for visual surveys and 2,000 ft (610 m) for photographic surveys. After the second day of flying, the target ground speed was adjusted to 110 knots (204 km/h). Complete coverage of the two photographic strata was achieved using a Nikon D810 camera fitted with a 25 mm lens. The camera was mounted at the rear of the aircraft and directed straight down with the longest side perpendicular to the track line. The camera was connected to a GPS unit to geo-reference photographs, and to a laptop computer to control exposure settings and photo interval. At an altitude of 2,000 ft (610 m), the 25 mm lens captured a ground area of approximately 875 m x 585 m. The photograph interval was set to maintain an overlap of 20 to 40 % between consecutive photos, and with a transect spacing of 600 m, the lateral overlap between photos from adjacent transects was approximately 30 %. DESCRIPTION: Aerial surveys of summering Western Hudson Bay (WHB) beluga (Delphinapterus leucas) were conducted on August 19th, 2015 to update the previous population abundance. The survey area comprised five strata (three visual and two photographic) encompassing high use areas around three river estuaries where recurring aggregations of WHB beluga are found during the summer months. This metadata covers the photographic data related to the survey. The photographic surveys completely covered high density aggregations in the Churchill River and near the mouth of the Seal River.
-

The Atlas of Canada's Relief Map shows Canada's relief with a colour ramp of elevation ranges. Colour tints of depth ranges show ocean bathymetry. This map shows the relief of Canada using three different resolutions. Starting with low resolution, as you zoom in, it transitions to medium and then high resolution. The low resolution is derived from the merging of Natural Resources Canada (NRCan) High Resolution Digital Elevation Model (HRDEM) from 2021 and the legacy Canadian Digital Elevation Model (CDEM), 1945-2011, resampled to 804 metres. The medium resolution is the NRCan, Medium Resolution Digital Elevation Model (MRDEM) from 2024, with modifications by the Atlas of Canada for cartographic purposes. The high resolution is NRCan's 2021 HRDEM product with 1 metre pixels. Also included, is a bathymetric layer from GEBCO 2021 (https://download.gebco.net/) resampled to 804 metre pixels. Other sources: Danish Ministry of Climate, Energy and Utilities; Geological Survey of Denmark and Greenland (GEUS) 2021; Government of Iceland; United States. National Geodetic Survey’s Integrated Database, 2021 (https://geodesy.noaa.gov/) All layers have been symbolized to match the Atlas of Canada Relief wall map. Copies of this map may be obtained from authorized map dealers in Canada, USA and abroad. For further information on purchasing the paper map MCR 0101 or downloading the digital version free of charge, go to atlas.gc.ca. Produced by the Canada Centre for Mapping and Earth Observation, Natural Resources Canada. Printed in 2025. ISBN 978-0-660-37948-7 Catalogue No. m57-1/46-2021e Permanent link: https://doi.org/10.4095/pe5mnk08hr Further information on all these maps can be found on the Atlas of Canada web site atlas.gc.ca.
-

PURPOSE: An aerial survey of the Western Hudson Bay beluga whale (Delphinapterus leucas) population was conducted on August 12th, 2015 to provide a population estimate. Surveys were flown in a DeHavilland Twin Otter (DH-6) fitted with four bubble windows and an optical glass-covered camera hatch at the rear underbelly of the plane. A Global Positioning System (GPS) unit logged the position, altitude, speed, and heading of the aircraft each second. Surveys were initially flown at a target ground speed of 100 knots (185 km/h), and target altitudes of 1,000 ft (305 m) for visual surveys and 2,000 ft (610 m) for photographic surveys. After the second day of flying, the target ground speed was adjusted to 110 knots (204 km/h). Complete coverage of the two photographic strata was achieved using a Nikon D810 camera fitted with a 25 mm lens. The camera was mounted at the rear of the aircraft and directed straight down with the longest side perpendicular to the track line. The camera was connected to a GPS unit to geo-reference photographs, and to a laptop computer to control exposure settings and photo interval. At an altitude of 2,000 ft (610 m), the 25 mm lens captured a ground area of approximately 875 m x 585 m. The photograph interval was set to maintain an overlap of 20 to 40 % between consecutive photos, and with a transect spacing of 600 m, the lateral overlap between photos from adjacent transects was approximately 30 %. DESCRIPTION: Aerial surveys of summering Western Hudson Bay (WHB) beluga (Delphinapterus leucas) were conducted on August 12th, 2015 to update the previous population abundance. The survey area comprised five strata (three visual and two photographic) encompassing high use areas around three river estuaries where recurring aggregations of WHB beluga are found during the summer months. This metadata covers the photographic data related to the survey. The photographic surveys completely covered high density aggregations in the Churchill River and near the mouth of the Seal River.
-

The map data set includes the basic maps of the City. It is a representation of the territory of the city of Montreal on a large and medium scale (1:1000, 1:5000, etc.). The presentation of land use is composed of elements produced mainly by photogrammetry and complemented by various techniques, at specific dates. It is a geometric and conventional representation of Montreal's territory in 2D+1 (X, Y + altitude ratings or level curves). The main purposes of the basic mapping product are territorial planning and public consultation. The breakdown of the SQRC 1:1000 sheets is available [here] (/city-of-montreal/quadrillage-sqrc).**This third party metadata element was translated using an automated translation tool (Amazon Translate).**