 Arctic SDI catalogue
Cartography
Type of resources
Available actions
Topics
Keywords
Contact for the resource
Provided by
Years
Formats
Representation types
Update frequencies
status
Service types
Scale
-

Map of Canada showing locations of facilities selling nautical charts in both paper and digital formats.
-

This dataset includes all MPMO projects at various stages in the review process, including those that are currently undergoing review and those that have completed a review.
-

This data set presents the places of interest in the City of Montreal according to the classification carried out as part of the Montreal on Foot (MàP) initiative in 2020. The Montréal à Pied project aims to improve orientation and pedestrian paths throughout Montreal. Although the data concern the territory of the boroughs, places of interest may be located on the territory of linked cities for a better coherence of geographic information.**This third party metadata element was translated using an automated translation tool (Amazon Translate).**
-
Canada is divided into 308 electoral districts. A representative or member of Parliament is elected for each electoral district. Following the release of population counts from each decennial census, the Chief Electoral Officer determines the number of seats in the House of Commons and publishes the information in the Canada Gazette. Electoral boundaries commissions then determine the adjustments to the constituency boundaries. The federal electoral boundaries commissions are independent bodies that make all decisions regarding the proposed and final federal electoral boundaries. Elections Canada provides support services to the boundaries commission in each province. Based on reports from these commissions, the Chief Electoral Officer prepares a representation order that describes the boundaries and specifies the name and the population of each FED. The representation order is in force on the first dissolution of Parliament that occurs at least one year after its proclamation. The 2003 Representation Order (proclaimed on August 25, 2003) was based on 2001 Census population counts, and increased the number of FEDs to 308, up from 301 from the previous 1996 Representation Order. Ontario received three additional seats, while Alberta and British Columbia each gained two seats. The names of FEDs may change at any time through an Act of Parliament.
-
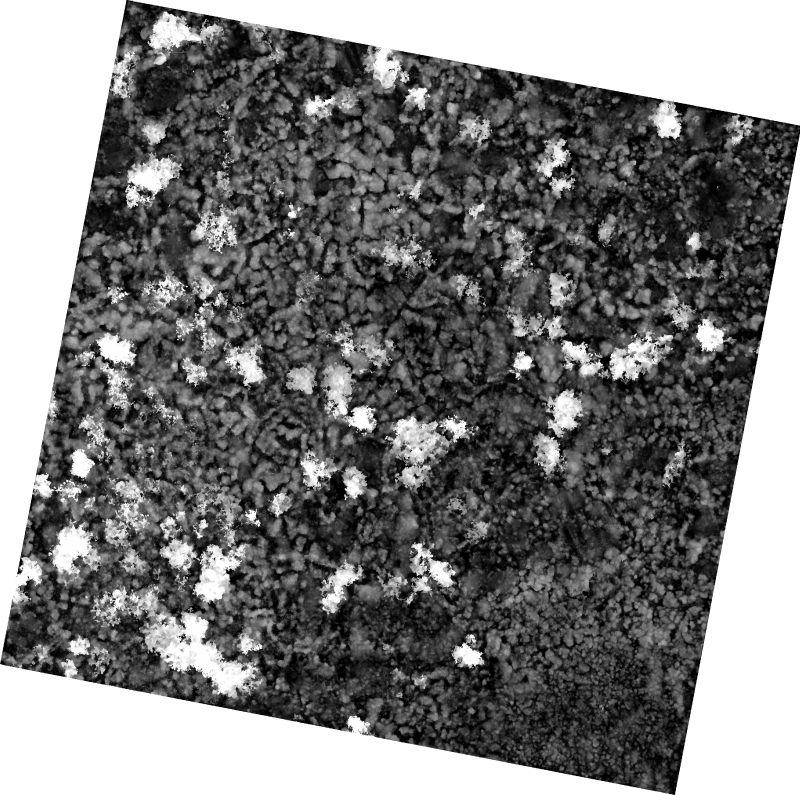
The 1 cm resolution vegetation digital height model was extracted using a bare earth model and digital surface model (DSM) derived from unmanned aerial vehicle (UAV) imagery acquired from a single day survey on July 28th 2016, in Cambridge Bay, Nunavut. The mapping product covers 525m2 and was produced by Canada Centre for Remote Sensing /Canada Centre for Mapping and Earth Observation. The UAV survey was completed in collaboration with the Canadian High Arctic Research Station (CHARS) for northern vegetation monitoring research. For more information, refer to our current Arctic vegetation research: Fraser et al; "UAV photogrammetry for mapping vegetation in the low-Arctic" Arctic Science, 2016, 2(3): 79-102. http://www.nrcresearchpress.com/doi/abs/10.1139/AS-2016-0008
-
Canada is divided into 338 electoral districts. A representative or member of Parliament is elected for each electoral district. Following the release of population counts from each decennial census, the Chief Electoral Officer determines the number of seats in the House of Commons and publishes the information in the Canada Gazette. Electoral boundaries commissions then determine the adjustments to the constituency boundaries. The federal electoral boundaries commissions are independent bodies that make all decisions regarding the proposed and final federal electoral boundaries. Elections Canada provides support services to the boundaries commission in each province. Based on reports from these commissions, the Chief Electoral Officer prepares a representation order that describes the boundaries and specifies the name and the population of each FED. The representation order is in force on the first dissolution of Parliament that occurs at least seven months after its proclamation. The 2013 Representation Order (proclaimed on October 5, 2013) was based on 2011 Census population counts, and increased the number of FEDs to 338, up from 308 from the previous 2003 Representation Order. Ontario received fifteen additional seats, Alberta and British Columbia each gained six seats while Quebec added three seats. On June 19, 2014, the Riding Name Change Act, 2014 (Bill C-37) received Royal Assent changing the names of 31 FEDs. The names of FEDs may change at any time through an Act of Parliament.
-

As part of measure 2.6 of the 2013-2020 Climate Change Action Plan, the MELCC financed two projects specific to the St. Lawrence river section and aimed at supporting municipalities facing the risks of erosion and flooding. The team of the **Laboratoire de Géomorphology Terre-Mer du Département de Géomorphology de l'Université Laval** has set up an essential geospatial information base for assessing the risks associated with the erosion of the banks of the banks of the St. Lawrence river section. The user will be able to find there (i) the mapping of the classification of the shore (types of banks and their artificialization), (ii) the degradation conditions of artificial structures and (iii) the state of erosion of natural or artificial segments. The sectors most vulnerable to erosion have also been mapped and documented with image quality sheets. These sheets present the characteristics of the shoreline and the main natural (currents, ice, etc.) and human geomorphological processes (currents, ice, etc.) associated with bank erosion for these nerve sectors, in order to better represent local dynamics. The geospatial data associated with shoreline mapping, the quality sheets and the project report, which includes the description of the methodology and results, are available for download. The second project is led by Ouranos and aims to reduce the vulnerability to floods and erosion associated with climate change for communities bordering the St. Lawrence river section. The user will be able to consult two reports resulting from this project: a. Technical report on future trends in the main hydro-climatic factors that influence natural flood risks and bank erosion processes along the fluvial section of the St. Lawrence. The objectives of this report are to draw a portrait of these hazards, covering both the recent past and future projections (2050 and 2080). These factors range from large-scale phenomena, such as the spring flood of the St. Lawrence River or marine uplift, to local phenomena such as freeze-thaw processes that affect clay cliffs and microcliffs. b) Summary of the needs mentioned by the actors of the regional consultation tables (TCR) to adapt riparian communities to the risks of bank erosion and flooding. This report presents a portrait of the participants of the four workshops organized in the fall of 2018, the approach used for the consultation and a summary of the needs expressed. The lists of participants and the detailed reports of each workshop are also included in the annex to this document. The TCRs consulted during these workshops are those of Haut-Saint-Laurent — Greater Montreal, Lac Saint-Pierre, the fluvial estuary and the TCR of Quebec. Following this characterization project, a [Study of bank mobility issues in the St. Lawrence river section] project (https://www.donneesquebec.ca/recherche/dataset/etude-d-enjeux-de-mobilite-des-berges-dans-le-troncon-fluvial-du-saint-laurent) was carried out. **This third party metadata element was translated using an automated translation tool (Amazon Translate).**
-
Produced as part of the St. Lawrence Action Plan, the Atlas of Territories of Conservation Interest in the St. Lawrence Lowlands shows the sites where conservation needs are the most pressing. The conservation targets selected (coarse filter) are forest environments, wetlands, open environments (wastelands, perennial crops) and aquatic environments to which are added elements of the fine filter such as exceptional aquatic environments associated with the St. Lawrence corridor (e.g. spawning grounds), alvars, bird colonies, wildlife elements (e.g. nesting sites of Bank Swallows and Chimney Swift, etc.) and important floristic occurrences. Our objective is to determine the sites of interest until a representative threshold of 20% is reached. The geospatial data associated with sites of interest for conservation, the user guide, the methodological report, the metadata as well as the detailed mapping of land use in the St. Lawrence Lowlands, which was an essential basic data for producing this atlas, are available for download. Users can therefore more accurately consult the spatial distribution of sites of interest and the conservation value associated with each plot of habitat for conservation targets (forest environments, wetlands, wastelands, perennial crops, aquatic environments) using geographic information systems (e.g. ArcGIS). Users can also adapt the analysis of this data to their territorial reality and according to specific objectives specific to their interests. Since the conservation of natural environments and species in precarious situations is a shared responsibility, this Atlas will make it possible to meet the priorities of the many organizations involved in the conservation of natural environments in the St. Lawrence Lowlands.**This third party metadata element was translated using an automated translation tool (Amazon Translate).**
-
__The link: *Access the data directory* is available in the section*Dataset Description Sheets; Additional Information*__. Ecoforest maps have been produced at a scale of 1/10,000 since 2025 (previously, they were distributed at a scale of 1/20,000) and illustrate forest information for Quebec territory up to approximately the 52nd parallel. They offer an up-to-date image of the ecoforest map for the year of production. The maps represent the result of the photo-interpretation of aerial photographs taken during the most recent ecoforestry inventory of southern Quebec to which were added natural disturbances (fires, epidemics, windfalls, etc.) and forest interventions (harvesting, thinning and reforestation) carried out in the public forest following the year in which they were taken. Vegetation information specific to each stand is expressed in detailed species (AIPF) when information is available for a complete sheet. Otherwise, vegetation is expressed as a group of species. Each map at a scale of **1/10,000** covers an average area of approximately **62.5 km²** and presents forest information for the target territory. Its accuracy is approximately ± 5 m. Each map at a scale of **1/20,000** covers an average area of approximately **250 km²** and presents forest information for the target territory. Its accuracy is approximately ± 10 m. ## Descriptions of maps and components ### 2025 maps: + Scale (1/10,000); + Replacing the BDTQ level curves with those from the lidar; + Characterization of vegetation by detailed species (AIPF) or by grouping of species, depending on the availability of information; + Maps based on up-to-date ecoforest maps from the 4th and 5th inventories. ### Maps 2021 to 2024: + Scale (1/20,000); + Characterization of vegetation by detailed species (AIPF) or by grouping of species, depending on the availability of information; + Maps based on up-to-date ecoforest maps from the 4th and 5th inventories. ### 2019 and 2020 maps: + Scale (1/20,000); + Characterization of vegetation by grouping of species; + Maps based on up-to-date ecoforest maps from the 4th and 5th inventories. ### 2015 maps: + Scale (1/20,000); + Characterization of vegetation by grouping of species; + Maps based on up-to-date ecoforest maps from the 3rd and 4th inventories. ## ⚠️ Notes: + Forest codes vary depending on the inventory; **consult the legend** of the map. + The maps are **georeferenced** and optimized for printing. + **AIPF**: The AIPF (**forest stand inventory approach**) is a method used in Quebec for ecoforest stratification to classify forests according to their populations and including updates compared to previous inventories.**This third party metadata element was translated using an automated translation tool (Amazon Translate).**
-
Map indexes are grids that divide the territory into several sheets for the whole of Quebec. The use of these indexes allows the identification of a map sheet number for a specific territory at the scale of 1/2,000, 1/20,000 and 1/100,000. The cartographic indexes come from the Quebec cartographic reference system (S.Q.R.C), which divides the territory into hierarchical units and at different scales (1/100,000, 1/20,000, 1/10,000, 1/10,000, 1/10,000, 1/10,000, 1/10,000, 1/5,000, 1/5,000, 1/5,000, 1/1,000). This system is compatible with the [**National Cartographic Reference System (S.N.R.C) **] (https://ressources-naturelles.canada.ca/sciences-terre/geographie/information-topographique/cartes/9766).**This third party metadata element was translated using an automated translation tool (Amazon Translate).**