 Arctic SDI catalogue
SHP
Type of resources
Available actions
Topics
Keywords
Contact for the resource
Provided by
Years
Formats
Representation types
Update frequencies
status
Scale
Resolution
-

The Permafrost Information Network (PIN) geotechnical borehole database combines existing database compilations into a standard structure. The standardized database was created to be accessible from the PIN web application as a data layer. Further information regarding data compilation can be accessed from the PIN web application.
-

Hydrogeological Regions provide a framework to introduce the regional hydrogeology of Canada and to connect apparently disparate studies into a broader framework. The hydrological regions are first order areas used to capture and summarize data that will help develop more detailed profiles of each region. Comparison of findings within and between regions will allow scalable extension to sub-regional and watershed scale mapping. Canada has been classified into nine principal hydrogeological regions. Each region is described briefly based on the following five hydrogeological characteristics (Heath, 1984): system components and geometry; water-bearing openings; rock matrix composition; storage and transmission; recharge/ discharge. The hydrogeological classification emphasizes major geological provinces and rock formations. Fundamental water-bearing openings and rock matrix properties help determine the quantity (storage), flux (transmission), and composition of formation waters. These same properties and any overlying sediment cover affect recharge/ discharge rates for regional formations. While regional attributes are general, a simple aquifer mapping scheme can further describe the nature and character of aquifers in each region. For example, general groundwater settings across the country could be described as has been done by USGS principal aquifers [1]. Thus the regional framework can potentially link from national scales to watershed scales by identifying typical aquifer types based on readily available geological maps that use water-bearing character as a common attribute. The nine hydrogeological regions include: Cordillera Mountains with thin sediment over fractured sedimentary, igneous and metamorphic rocks of Precambrian to Cenozoic age. Intermontane valleys are underlain by glacial and alluvial deposits of Pleistocene age. Plains (Western Sedimentary Basin) Region-wide basin of sub-horizontal Paleozoic to Cenozoic sedimentary rocks are overlain by thick glacial deposits filling buried valleys. Incised post-glacial valleys provide local relief. Shallow gas, coal, and brines may occur. Canadian Shield Undulating region of thin glacial sediment overlying complex deformed, fractured PreCambrian igneous, metamorphic and sedimentary rocks. Region contains several terrains: sedimentary basins, structural belts, and glacial-lacustrine basins. Hudson Bay (Moose River) Basin Sedimentary basin of Paleozoic to Mesozoic sub horizontal carbonate and clastic sediment covered by surficial deposits, with low relief and poor drainage. Southern Ontario Eastern Great Lakes region is underlain by gently-dipping Paleozoic, carbonate, clastic and gypsum-salt strata overlain by glacial sediments up to 200 m thick with tunnel valleys. Karst, bedrock valleys, shallow gas and brines are also important components. St. Lawrence Lowlands Lowlands underlain by shallow-dipping Paleozoic sedimentary rocks and thick glacial sediment in glacial-marine basins. Appalachian and Precambrian uplands discharge water to valleys. Shallow gas and saltwater intrusion are possible. Appalachia Upland to mountainous region with thin surficial sediment on folded Paleozoic sedimentary and igneous rocks. Range of rock types yields a wide range of water compositions. Valleys contain important alluvial aquifers. Maritimes Basin Lowlands with flat-lying, Carboniferous clastic , salt, and gypsum rocks contain shallow coal deposits. Surface glacial sediment is thin and discontinuous. Salt water intrusion is possible. Permafrost Arctic islands and most areas north of 60o contain frozen ground affects on groundwater flow. Diverse topography and geology define sub-regions of sedimentary basins and crystalline rocks. Glacial sediment is thin, discontinuous; local peat accumulations are significant.
-

This project was completed by the Coastal Environmental Baseline Program (Coastal and Freshwater Ecology Section) in the Newfoundland and Labrador Science Branch of Fisheries and Oceans Canada (DFO). From 2020-2023, there were semi-annual deployments and retrievals of 3 moored CTDs in the bay. From 2020 to November 2021, moored CTDs collected hourly recordings of conductivity, temperature and pressure. From 2021 through 2023, these CTDs collected year-round, hourly, information on temperature, conductivity, pressure, dissolved oxygen, and chlorophyll-a. Acoustic releases also collected hourly ambient noise (mV) data. This record contains the geographic locations of the sites, and information on the timings and types of data collected at each site.
-
The rationale for developing this product was the recognized need for a standard and adaptable marine grid that could be used for planning or analysis purposes across projects. This nested grid has five spatial resolutions: 8km, 4km, 2km, 1km, and 500m. It covers the extent of the EEZ on the Canadian Pacific coast, and further east in order to encompass the Fraser River Delta and Puget Sound to account for ecological importance.
-
Aquatic invasive species (AIS) are non-native species that pose ecological and/or economic threats to Canada's coastal waters and resources. In response, Fisheries and Oceans Canada (DFO) established a program to detect and track the spread of aquatic invasive species in Canadian waters (2006). In the Newfoundland and Labrador (NL) Region, these species include biofouling organisms (tunicates, bryozoans, crustaceans, seaweeds), European Green Crab, and recently, several freshwater species (data not available at this time). DFO NL Science monitors for AIS in partnership with other DFO branches, the provincial government, Memorial University, including the Marine Institute, industry, first nations, and NGOs. Methods for detecting AIS used by DFO and their partners, include settlement plates, trapping, seining, eDNA (water samples), qPCR (species confirmation), SCUBA surveys along wharves, floating docks and vessel hulls, and video surveys at high-risk harbours. The data collected from DFO's monitoring program and their partners provides an overview of the distribution of AIS in the NL Region. This information can be used by the general public, scientists, and DFO managers. AIS NL Biofouling Species Fisheries and Oceans Canada's (DFO) National Marine Biofouling Monitoring Program conducts annual field surveys to monitor the introduction, establishment, spread, species richness, and relative abundance of native and some non-native species in Newfoundland and Labrador (NL) Region since 2006. Standardized monitoring protocols employed by DFO's NL, Maritimes, Gulf, and Quebec regions include biofouling collector plates deployed from May to October at georeferenced intertidal and shallow subtidal sites, including public docks, and public and private marinas and nautical clubs. Initially, (2006-2017), the collectors consisted of three 10 cm by 10 cm PVC plates deployed in a vertical array and spaced approximately 40 cm apart, with the shallowest plate suspended at least 1 m below the surface to sample subtidal and shallow intertidal species (McKenzie et al 2016a). Three replicate arrays were deployed at least 5 m apart per site. Since 2018, collector networks have been modified to improve statistical replication, including up to 10 individual collectors deployed per site at 1 m depth and at least 5 m apart (as above) from May to October. Since 2006, seven invasive biofouling organisms have been detected in Newfoundland and Labrador harbours, marinas and coastal areas. Should be cited as follows: DFO Newfoundland and Labrador Region Aquatic Invasive Species Marine Biofouling Monitoring Program. Published March 2024. Coastal and Freshwater Ecology, Northwest Atlantic Fisheries Centre, Fisheries and Oceans Canada, St. John’s, Newfoundland and Labrador. Reference: Tunicates Golden star tunicate (Botryllus schlosseri) 2006 The Golden star tunicate was the first invasive tunicate detected in NL waters. It was reported in Argentia by the US Navy around 1945. It was found in 2006 on wharf structures in Argentia, Placentia Bay during the first AIS survey (Callahan et al 2010). This colonial tunicate is recognized by it star shaped grouping of individuals within the colony. It is currently found in Placentia Bay, Fortune Bay, St. Mary’s Bay, Conception Bay and the west coast of NL. The data provided here indicates the detections of this AIS in coastal NL. Violet tunicate (Botrylloides violaceus) 2007 The violet tunicate was first detected in NL waters in 2007 in Belleoram, Fortune Bay on wharf structures and vessels (McKenzie et al. 2016b). This colonial tunicate forms irregular shaped colonies usually of a solid color (orange, purple, yellow or cream). It is currently found in relatively small colonies in four harbours in NL; Placentia Bay (1), Fortune Bay (1), Conception Bay (1) and the west coast of NL (2). The data provided here indicates the detections of this AIS in coastal NL. Vase tunicate (Ciona intestinalis) 2012 The Vase tunicate, is a high impact solitary invader and was first detected by DFO in 2012 on the Burin Peninsula at Ship Cove and Little Bay, Placentia Bay. Various mitigation measures (McKenzie et al. 2016b) contained this invasive tunicate to a small area for six years within Placentia Bay. First detected in Fortune Bay as an established population in 2019, increasing reports of the Vase tunicate have been made along the south coast of Newfoundland. The data provided here indicates the detections of this AIS in coastal NL. Bryozoans Coffin box bryozoan (Membranipora membranacea) 2002 The Coffin box is a bryozoan (filter feeding animal) that forms white colored encrusting colonies, particularly on seaweed, but also on vessels and other surfaces. The cells are rectangular or “coffin box” shaped. It was first detected on the west coast of NL in 2002 and has since spread throughout the island, including southern Labrador. The data provided here indicates the detections of this AIS in coastal NL. Orange ripple bryozoan (Schizoporella japonica Ortmann) 2022 The Orange ripple bryozoan is an orange heavily calcified encrusting species found mainly on man made structures, rocks, shellfish, and vessels. It was first identified in NL in 2022 in Arnold’s Cove, Placentia Bay, but has likely been in NL for at least two years and is now suspected in several locations in Placentia Bay and Fortune Bay. A 2023 survey of the south coast of NL found several harbours invaded by this species. The data provided here indicates the detections of this AIS in coastal NL. Crustaceans (Biofouling) Japanese skeleton shrimp (Caprella mutica) 2006 The Japanese skeleton shrimp is tiny (1.5 -3.5 cm) and was first found on settlement plates in Placentia Bay during the first AIS biofouling survey in 2006. This species is currently found in many places in Placentia Bay, Conception Bay, Trinity Bay, and on the south coast of NL. This species inhabits, sometimes in large numbers (100,000s) ropes, moorings, and docks. The data provided here indicates the detections of this AIS in coastal NL. Seaweed Oyster thief (Codium fragile) 2012 Oyster thief is a green seaweed with thick spongy Y-shaped branches that resemble fingers (another common name is dead man’s fingers). This invasive species was first found in Placentia Bay in 2012. It is now found in several locations in Placentia Bay and Fortune Bay. It has also been found in one location in Notre Dame Bay. The data provided here indicates the detections of this AIS in coastal NL. AIS NL European green crab Fisheries and Oceans Canada's (DFO) AIS Science Program conducts annual field surveys to monitor the introduction, establishment, spread, and relative abundance of the European green crab in the NL region since 2006. Standardized monitoring and trapping protocols (McKenzie et al. 2022) are used by DFO's NL, Maritimes, Gulf, Quebec, and Pacific regions. The Fukui trap is the most commonly used trap but other methods are also used including shoreline collection, seining, and SCUBA dive surveys. Fukui traps have been deployed annually at both new and long-term monitoring locations throughout coastal Newfoundland and Labrador, particularly within Placentia Bay where they were first detected in North Harbour in 2007 (Blakeslee et al. 2010). It should be noted that there are two different populations of European Green Crab, a hybridized population in Placentia, St. Mary’s, and Fortune Bays and a cold tolerant population on the west and southwestern coast of NL (Lehnert et al. 2018). After initial detection in 2007, a separate invasion occurred in 2009 on the west coast of NL, and this cold-tolerant population is spreading eastward along the south coast toward areas inhabited by the original hybrid strain. The data provided here indicates the detections of this AIS in coastal NL. Should be cited as follows: DFO Newfoundland and Labrador Region Aquatic Invasive Species Green Crab Monitoring Program. Published March 2024. Coastal and Freshwater Ecology, Northwest Atlantic Fisheries Centre, Fisheries and Oceans Canada, St. John’s, Newfoundland and Labrador. From 2018-2022, the Coastal Environmental Baseline Program provided additional support to enhance sampling efforts in Placentia Bay.
-

This project was completed by the Productive Capacity group (Coastal and Freshwater Ecology Section) in the Newfoundland and Labrador Science Branch of Fisheries and Oceans Canada (DFO). American lobster (Homarus americanus) is a commercially important decapod crustacean species along the east coast of North America, ranging from the Labrador coast south to Cape Hatteras. Juvenile lobster < 40 mm CL (carapace length) recruitment has been studied extensively in the southern portions of their range. However, investigations of settlement habitat association and recruitment of juvenile lobster in the northern extremes along the Newfoundland coast have been largely unsuccessful. We investigated juvenile lobster density, habitat, and depth associations in three areas of Newfoundland, using scuba – Port Saunders area, 8 dives conducted 28 September - 2 October 2017, and Burin Peninsula 10 dives (7 Placentia Bay, 3 Fortune Bay) conducted 30 September - 4 October 2018 over a total seabed area of 9,138 m2, within 200 meters of shore. Port Saunders and Fortune Bay had relatively higher lobster density (0.09 and 0.40 m-2, respectively); >65% were juveniles, in contrast to Placentia Bay where lobster densities of all size groups were low (mean 0.01 m-2) and no juvenile lobsters were observed at all. Where observed all juvenile lobster were significantly associated with shallow (<6 m) habitat and showed no overlap with distribution of adults (>82.5 mm CL) which we observed at depths 6 to 17 m. Our sites were dominated by varying mixes of cobble and pebble (77%); rock/bedrock (12%) and mud/sand/small pebble (11%) substrates interspersed with overlying kelp (32%) and eelgrass (11%) vegetation. We observed no significant associations with substrate or vegetation. This record contains the geographic locations of the 7 Placentia Bay sites surveyed, and information on the timing and type of data collected at each site, which was one component supported by Coastal Environmental Baseline Program of a larger collaborative project.
-

Línurnar sýna friðunarsvæði, þar sem eldi laxfiska (fam. salmonidae) í sjókvíum er óheimilt skv. auglýsingu nr. 460/2004.
-

The map displays bedrock formations at or near the surface of the land, on the sea floor above the continental crust that forms the Canadian landmass, and oceanic crust surrounding the landmass. The bedrock units are grouped and coloured according to geological age and composition. The colours of offshore units and oceanic crust are paler and more generalized than those on land, although the constituent units offshore are still easily discernible from their dashed boundaries. This colour design, coupled with the use of a white buffer zone at the coast allows the coastline of Canada to be readily distinguished and still show the grand geological architecture of the Canadian landmass. The map also shows major faults that have disrupted the Earth's crust, onshore and offshore, and a variety of special geological features such as kimberlite pipes, which locally contain diamonds, impact structures suspected to have been caused by meteorites, and extinct and active spreading centres in the surrounding oceans.
-

Gögin upplýsingar um strok og tjón sem hefur átt sér stað sjókvíeldi. Hægt er að sjá hvar strokið átti sér stað, hvenær og hverskonar fiskur strauk. Einnig er hægt að sjá hvort hjón var á búnaði eða gat á kví. Fyrir frekari upplýsingar er bent á að hafa samband við matvælastofnun.
-
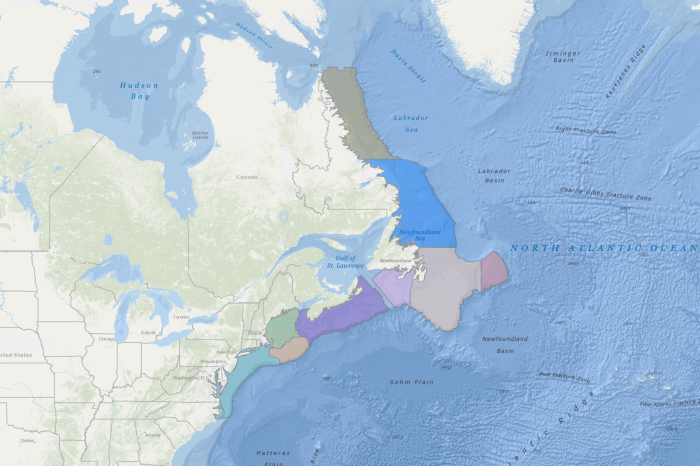
Pepin et al. (2014) stated that three nested spatial scales were identified as relevant for the development of ecosystem summaries and management plans: Bioregion, Ecosystem Production Unit (EPU), and Ecoregion. A bioregion is composed by one or more EPUs, while an EPU consists of a combination of ecoregions, which represent elements with different physical and biological characteristics based on the analytical criteria applied. Pepin et al. (2014) reported on the consolidation of data and analyses of ecoregion structure for the continental shelf areas from the Labrador Sea to the mid-Atlantic Bight and provided recommendations on the definition of EPUs in the NAFO Convention Area. The results of two K-means clustering analyses (one geographically constrained and one un-constrained) and expert knowledge (including and considering location of ecoregions, knowledge of the distribution of major marine resources and fish stocks, and geographic proximity for delineation/definition of potential management units) served as guides for evaluation by NAFO’s (North Atlantic Fisheries Organization) working group on ecosystem science and assessments (WG-ESA). The final consensus from the discussions identified eight (8) major EPUs that can serve as practical candidate management units (from the 50 m isobaths, where research vessel data were available, seaward to the 1500 m isobaths) that consist of the Labrador Shelf (NAFO subareas 2GH), the northeast Newfoundland Shelf (subareas 2J3K), the Grand Banks (subareas 3LNO), Flemish Cap (subarea 3M), the Scotian Shelf (subareas 4VnsWX), Georges Bank (parts of subareas 5Ze and 5Zw), the Gulf of Maine (subarea 5Y and part of 5Ze) and the mid-Atlantic Bight (part of subarea 5Zw and subareas 6ABC). Southern Newfoundland (subarea 3Ps) was not included in the original analysis because fall survey data were unavailable. However, it was later added as an EPU after additional analysis of the fish community structure and trends using survey data from the spring, which indicated that this area is heavily influenced by the surrounding EPUs (NAFO 2015). The proposed candidate management units correspond to the EPUs that define major areas within the bioregions which contain a reasonably well defined food web/production system. The working group noted that the consensus solution represents a compromise that aims to define management units based on the boundaries of existing NAFO subareas that are appropriate for estimation of ecosystem and fishery production. References: NAFO. 2015. Report of the 8th Meeting of the NAFO Scientific Council (SC) Working Group on Ecosystem Science and Assessment (WGESA). 17-26 November 2015, Dartmouth, Canada. NAFO SCS Doc. 15/19. Pepin, P., Higdon, J., Koen-Alonso, M., Fogarty, M., and N. Ollerhead. 2014. Application of ecoregion analysis to the identification of Ecosystem Production Units (EPUs) in the NAFO Convention Area. NAFO SCR Doc. 14/069.