 Arctic SDI catalogue
Géologie
Type of resources
Available actions
Keywords
Contact for the resource
Provided by
Years
Formats
Representation types
Update frequencies
status
Service types
Scale
-

The map displays bedrock formations at or near the surface of the land, on the sea floor above the continental crust that forms the Canadian landmass, and oceanic crust surrounding the landmass. The bedrock units are grouped and coloured according to geological age and composition. The colours of offshore units and oceanic crust are paler and more generalized than those on land, although the constituent units offshore are still easily discernible from their dashed boundaries. This colour design, coupled with the use of a white buffer zone at the coast allows the coastline of Canada to be readily distinguished and still show the grand geological architecture of the Canadian landmass. The map also shows major faults that have disrupted the Earth's crust, onshore and offshore, and a variety of special geological features such as kimberlite pipes, which locally contain diamonds, impact structures suspected to have been caused by meteorites, and extinct and active spreading centres in the surrounding oceans.
-

Canada’s landmass is very diversified and comprises 7 distinctive areas called physiographic regions, each of which has its own unique topography and geology. Physiographic regions are large areas that share similar relief and landforms shaped by common geomorphic processes and geological history. Physiographic regions are often used to describe Canada’s geography to show regional differences in climate, vegetation, population and the economy. This dataset collection contains three interrelated datasets mapping the location of Canada’s 7 different physiographic regions, their 21 subregions and many divisions (landforms).
-

The bedrock geologic units designate units of the same types of rock which composed the solid rock exposed at ground surface (as outcrop) or which underlies unconsolidated surficial sediments. This dataset represents a general description of the stratigraphy and geology, including geologic unit thickness, morphology, age and rank. It features a list of the geologic unit names and types of rock (lithology) in the hydrogeological unit, from a controlled vocabulary. While the preferred format to deliver this data is by using a shapefile and its linked attributes, this dataset can be delivered also by providing link to external data which should have at least the same properties or also by joining a georeferenced image of the map.
-
GIS compilation of data used to perform the stacked cumulative chance of success (resource potential map) in Open file 9163. Natural Resources Canada (NRCan) has been tasked, under the Marine Conservation Targets (MCT) initiative announced in Budget 2016, with evaluating the petroleum resource potential for areas identified for possible protection as part of the Government of Canada's commitment to conserve 10% of its marine areas by 2020. As part of this initiative, NRCan's Geological Survey of Canada (GSC) conducted a broad regional study of the petroleum potential over the majority of the Magdalen Basin, which is the principal geological basin in the southern Gulf of St. Lawrence. The GSC resource assessment is visually represented by a qualitative petroleum potential map. Disclaimer: A simplified colored version of the map is displayed on the Web Mapping Service (WMS). The correct version is available for download through the Federal Geospatial Platform (FGP) and GEOSCAN.
-

Radiocarbon dates are derived from organic samples collected through marine and coastal expeditions of the Geological Survey of Canada Atlantic and Pacific. These efforts were conducted primarily to better understand the spatial and temporal coverage of sediments and seabed-fast marine ice during the last deglaciation. The quality of these data varies - ranging from imprecise bulk samples and more accurate AMS estimates derived from single shell fragments. These data are ordered in the menu in 1000 year divisions. By default, only conventional radiocarbon ages are displayed, and reservoir-corrected and measured ages are hidden.
-

This dataset is the bedrock geology layer of the Precambrian shield area of the Province of Saskatchewan merged from 1:250,000 scale compilation map series. This dataset shows 1:250 000 scale bedrock geology of the Precambrian Shield area of the Province of Saskatchewan. Mapping in support of the dataset includes many years of field observations which were compiled at 1:250 000 scale and integrated into this dataset. The data was created as a file geodatabase feature class and output for public distribution. **Please Note – All published Saskatchewan Geological Survey datasets, including those available through the Saskatchewan Mining and Petroleum GeoAtlas, are sourced from the Enterprise GIS Data Warehouse. They are therefore identical and share the same refresh schedule.
-
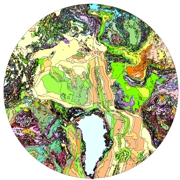
As part of the International Polar Year (IPY) 2007'08 and 2008'09 activities, and related objectives of the Commission for the Geological Map of the World (CGMW), nations of the circumpolar Arctic have co-operated to produce a new bedrock geology map and related digital map database at a scale of 1:5 000 000. The map, released in north polar stereographic projection using the World Geodetic System (WGS) 84 datum, includes complete geological and physiographic coverage of all onshore and offshore bedrock areas north of latitude 60° north.
-

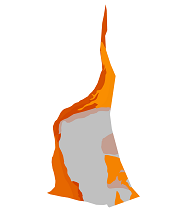
A revised qualitative assessment of the hydrocarbon resource potential is presented for the Hudson Bay sedimentary basin that underlies Hudson Bay and adjacent onshore areas of Ontario, Manitoba, and Nunavut. The Hudson Basin is a large intracratonic sedimentary basin thatpreserves dominantly Ordovician to Devonian aged limestone and evaporite strata. Maximum preserved sediment thickness is about 2.5 km. Source rock is the petroleum system element that has the lowest chance of success; the potential source rock is thin, may be discontinuous, and the thin sedimentarycover may not have been sufficient to achieve the temperatures required to generate and expel oil from a source rock over much of the basin. The highest potential is in the center of the basin, where the hydrocarbon potential is considered amp;lt;'Mediumamp;gt;'. Hydrocarbon potential decreasestowards the edges of the basin due to fewer plays being present, and thinner strata reduce the chance of oil generation and expulsion. Quantitative hydrocarbon assessment considers seven plays. Input parameters for field size and field density (per unit area) are based on analog Michigan, Williston,and Illinois intracratonic sedimentary basins that are about the same age and that had similar depositional settings to Hudson Basin. Basin-wide play and local prospect chances of success were assigned based on local geological conditions in Hudson Bay. Each of the seven plays were analyzed in Roseand Associates PlayRA software, which performs a Monte Carlo simulation using the local chance of success matrix and field size and prospect numbers estimated from analog basins. Hudson sedimentary basin has a mean estimate of 67.3 million recoverable barrels of oil equivalent and a 10% chance ofhaving 202.2 or more million barrels of recoverable oil equivalent. The mean chance for the largest expected pool is about 15 million recoverable barrels of oil equivalent (MMBOE), and there is only a 10% chance of there being a field larger than 23.2 MMBOE recoverable. The small expected fieldsizes are based on the large analog data set from Michigan, Williston and Illinois basins, and are due to the geological conditions that create the traps. The small size of the largest expected field, the low chance of exploration success, and the small overall resource make it unlikely that there are any economically recoverable hydrocarbons in the Hudson Basin in the foreseeable future. The Southampton Island area of interest includes 93 087 km2 of nearshore waters around Southampton Island and Chesterfield Inlet in the Kivalliq Region of Nunavut. Of the total resource estimated for Hudson Bay, 14 million barrels are apportioned to the Southampton Island Area of Interest.
-

GIS compilation of data used to perform the stacked cumulative chance of success (resource potential map) in Open file 8556. Natural Resources Canada (NRCan) has been tasked, under the Marine Conservation Targets (MCT) initiative announced in Budget 2016, with evaluating the petroleum resource potential for areas identified for possible protection as part of the Government of Canada's commitment to conserve 10% of its marine areas by 2020. As part of this initiative, NRCan's Geological Survey of Canada (GSC) conducted a broad regional study of the petroleum potential over the majority of the Magdalen Basin, which is the principal geological basin in the southern Gulf of St. Lawrence. The GSC resource assessment is visually represented by a qualitative petroleum potential map. Disclaimer: A simplified colored version of the map is displayed on the Web Mapping Service (WMS). The correct version is available for download through the Federal Geospatial Platform (FGP) and GEOSCAN.
-

This dataset is a compilation of numerous data files recovered as part of a data request in 2024 from a historical archive of DFO research data. Sediment and Suspended Particulate Matter (SPM) samples were collected over more than a decade as part of Dr. Douglas Loring’s research program while working at the Bedford Institute of Oceanography (BIO). Samples were collected as part of individual and collaborative research projects, and links to the relevant primary science publications and reports are included in the data in an effort to provide context to the data, as well as describe the field and laboratory techniques used to generate the attached data.