 Arctic SDI catalogue
START
Type of resources
Available actions
Topics
Keywords
Contact for the resource
Provided by
-

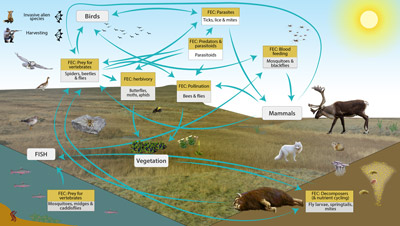
The Arctic terrestrial food web includes the exchange of energy and nutrients. Arrows to and from the driver boxes indicate the relative effect and counter effect of different types of drivers on the ecosystem. STATE OF THE ARCTIC TERRESTRIAL BIODIVERSITY REPORT - Chapter 2 - Page 26- Figure 2.4
-

Geographic area covered by the Arctic Biodiversity Assessment and the CBMP–Terrestrial Plan. Subzones A to E are depicted as defined in the Circumpolar Arctic Vegetation Map (CAVM Team 2003). Subzones A, B and C are the high Arctic while subzones D and E are the low Arctic. Definition of high Arctic, low Arctic, and sub-Arctic follow Hohn & Jaakkola 2010. STATE OF THE ARCTIC TERRESTRIAL BIODIVERSITY REPORT - Chapter 1 - Page 14 - Figure 1.2
-
Conceptual model of the FECs and processes mediated by more than 2,500 species of Arctic arthropods known from Greenland, Iceland, Svalbard, and Jan Mayen. STATE OF THE ARCTIC TERRESTRIAL BIODIVERSITY REPORT - Chapter 3 - Page 37- Figure 3.7
-
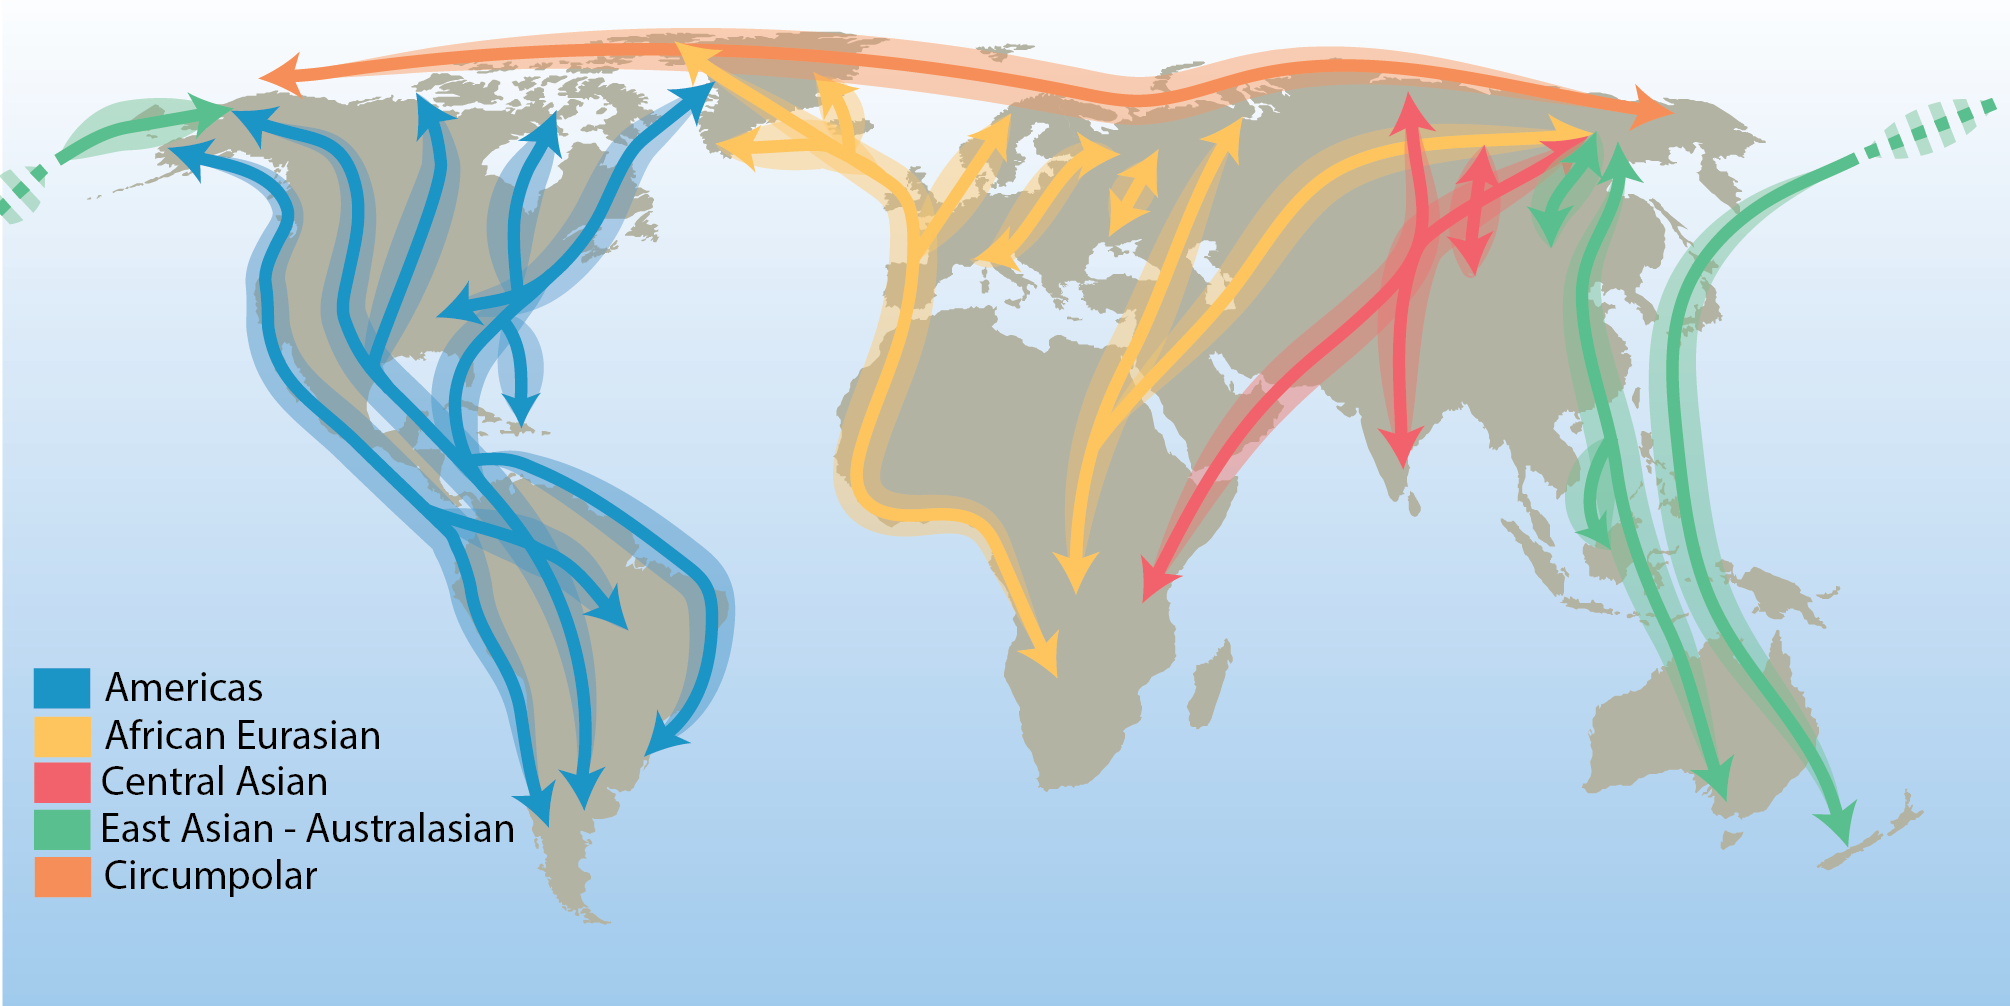
There are few true Arctic specialist birds that remain in the Arctic throughout their annual cycle. They include the willow and rock ptarmigan (Lagopus lagopus and L. muta), gyrfalcon (Falco rusticolus), snowy owl (Bubo scandiacus), Arctic redpoll (Carduelis hornemanni) and northern raven (Corvus corax)—a cosmopolitan species with resident populations in the Arctic. All other terrestrial Arctic-breeding bird species migrate to warmer regions during the northern winter, connecting the Arctic to all corners of the globe. Hence, their distributions are influenced by the routes they follow. These distinct migration routes are referred to as flyways and are defined by a combination of ecological and political boundaries and differ in spatial scale. The CBMP refers to the traditional four north–south flyways, in addition to a circumpolar flyway representing the few species that remain largely within the Arctic year-round (Figure 3-20). STATE OF THE ARCTIC TERRESTRIAL BIODIVERSITY REPORT - Chapter 3 - Page 48- Figure 3.20
-
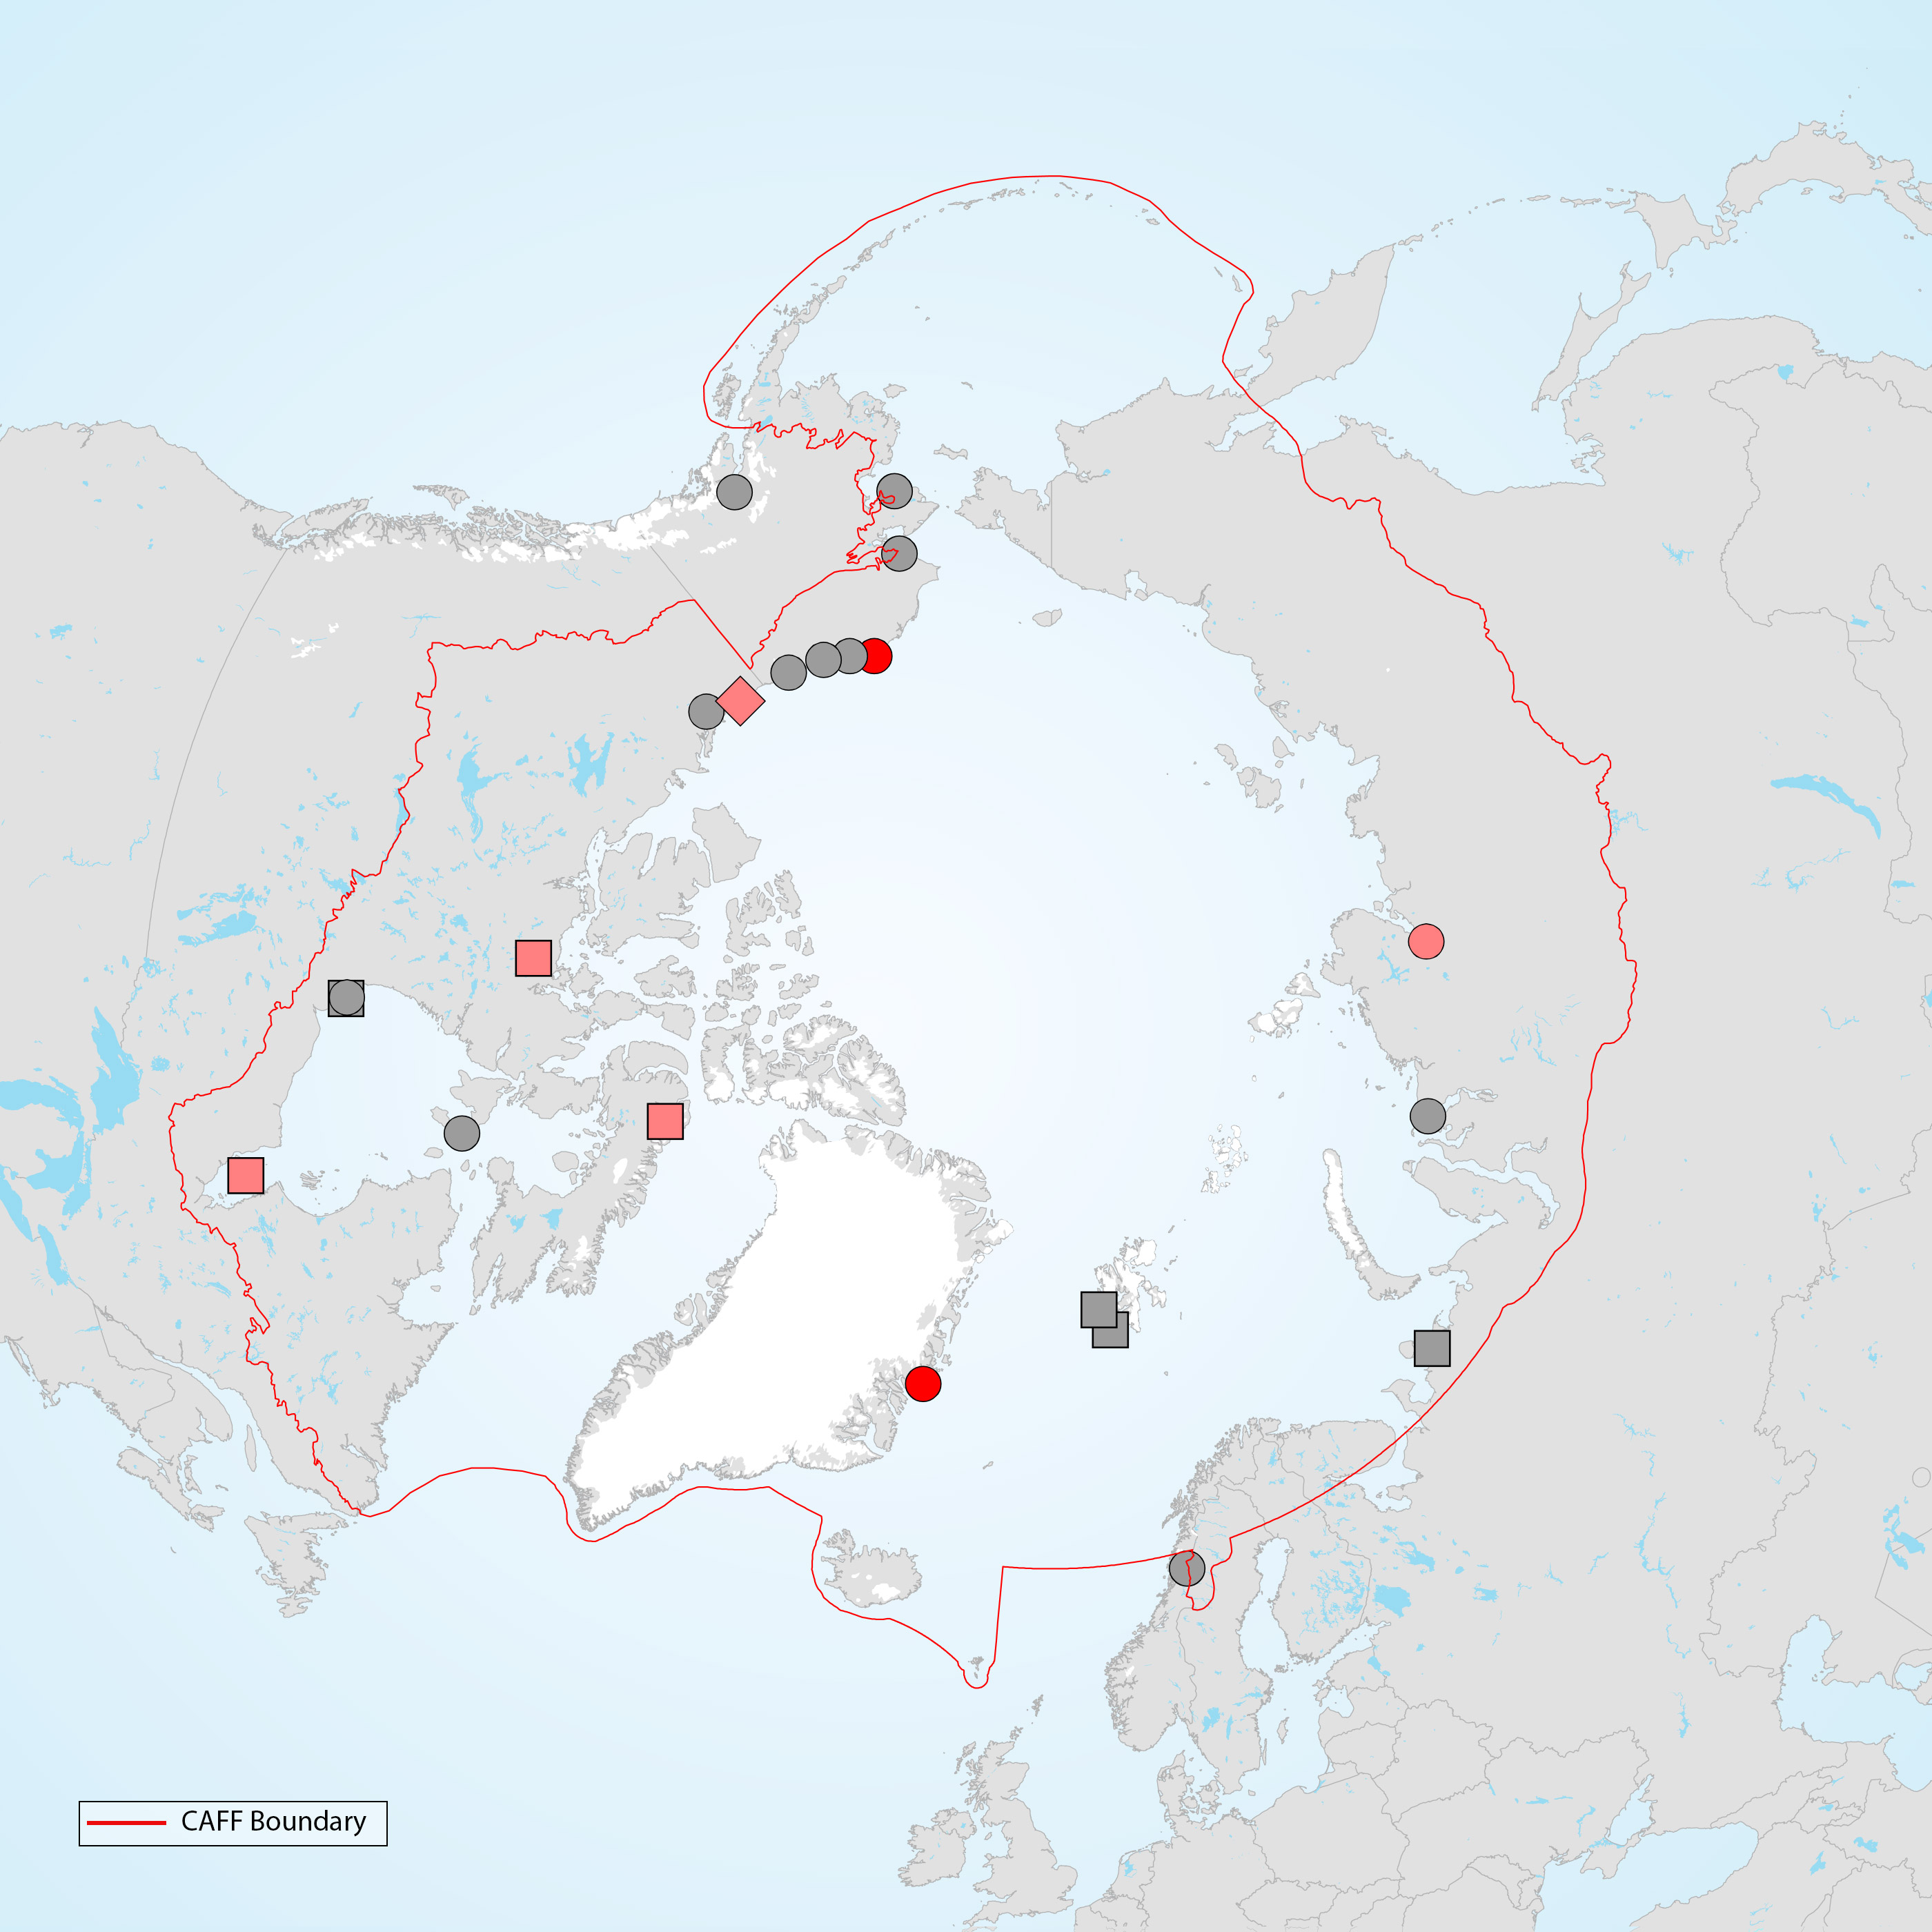
Study sites across the Arctic where phenological mismatches between timing of reproduction and peak abundance in food have been studied for terrestrial bird species. Grey symbols show study sites where this phenomenon has been studied for <10 years, light red symbols show sites with >10 years of data but no strong evidence of an increasing mismatch, and dark red symbols indicate sites with >10 years of data and strong evidence of an increasing mismatch. Circles indicate studies of shorebirds, squares for waterfowl and diamonds(triancle) for both shorebirds and passerines. Graphic: Thomas Lameris, adapted from Zhemchuzhnikov (submitted). STATE OF THE ARCTIC TERRESTRIAL BIODIVERSITY REPORT - Chapter 3 - Page 65 - Figure Box 3.3
-

Trends and distribution of muskoxen populations based on Table 3-5. Modified from Cuyler et al. 2020. STATE OF THE ARCTIC TERRESTRIAL BIODIVERSITY REPORT - Chapter 3 - Page 79 - Figure 3.30
-

Arctic foxes are currently monitored at 34 sites throughout the North, with most monitoring efforts concentrated in Fennoscandia (Figure 3-32). The duration of monitoring across all sites is variable at between 2 and 56 years and was ongoing at 27 of the 34 sites (79%) as of 2015. Monitoring projects cover almost equally the four climate zones of the species’ distribution—high Arctic, low Arctic, sub-Arctic, and montane/alpine. STATE OF THE ARCTIC TERRESTRIAL BIODIVERSITY REPORT - Chapter 3 - Page 82 - Figure 3.32
-

Temporal trends of arthropod abundance, 1996–2009. Estimated by the number of individuals caught per trap per day during the season from four different pitfall trap plots, each consisting of eight (1996–2006) or four (2007–2009) traps. Modified from Høye et al. 2013. STATE OF THE ARCTIC TERRESTRIAL BIODIVERSITY REPORT - Chapter 3 - Page 41 - Figure 3.16
-
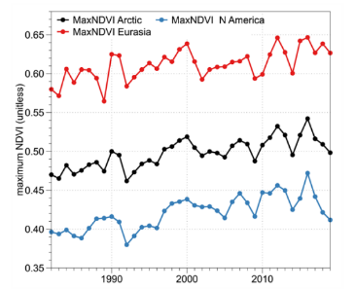
Circumpolar trends in primary productivity as indicated by the maximum Normalised Difference Vegetation Index, 1982–2017. (a) Brown shading indicates negative MaxNDVI trends, green shading indicates positive MaxNDVI trends. (b) Chart of trends for the circumpolar Arctic, Eurasia, and North America. Modified from Frost et al. 2020. STATE OF THE ARCTIC TERRESTRIAL BIODIVERSITY REPORT - Chapter 3 - Page 30 - Figure 3.1
-
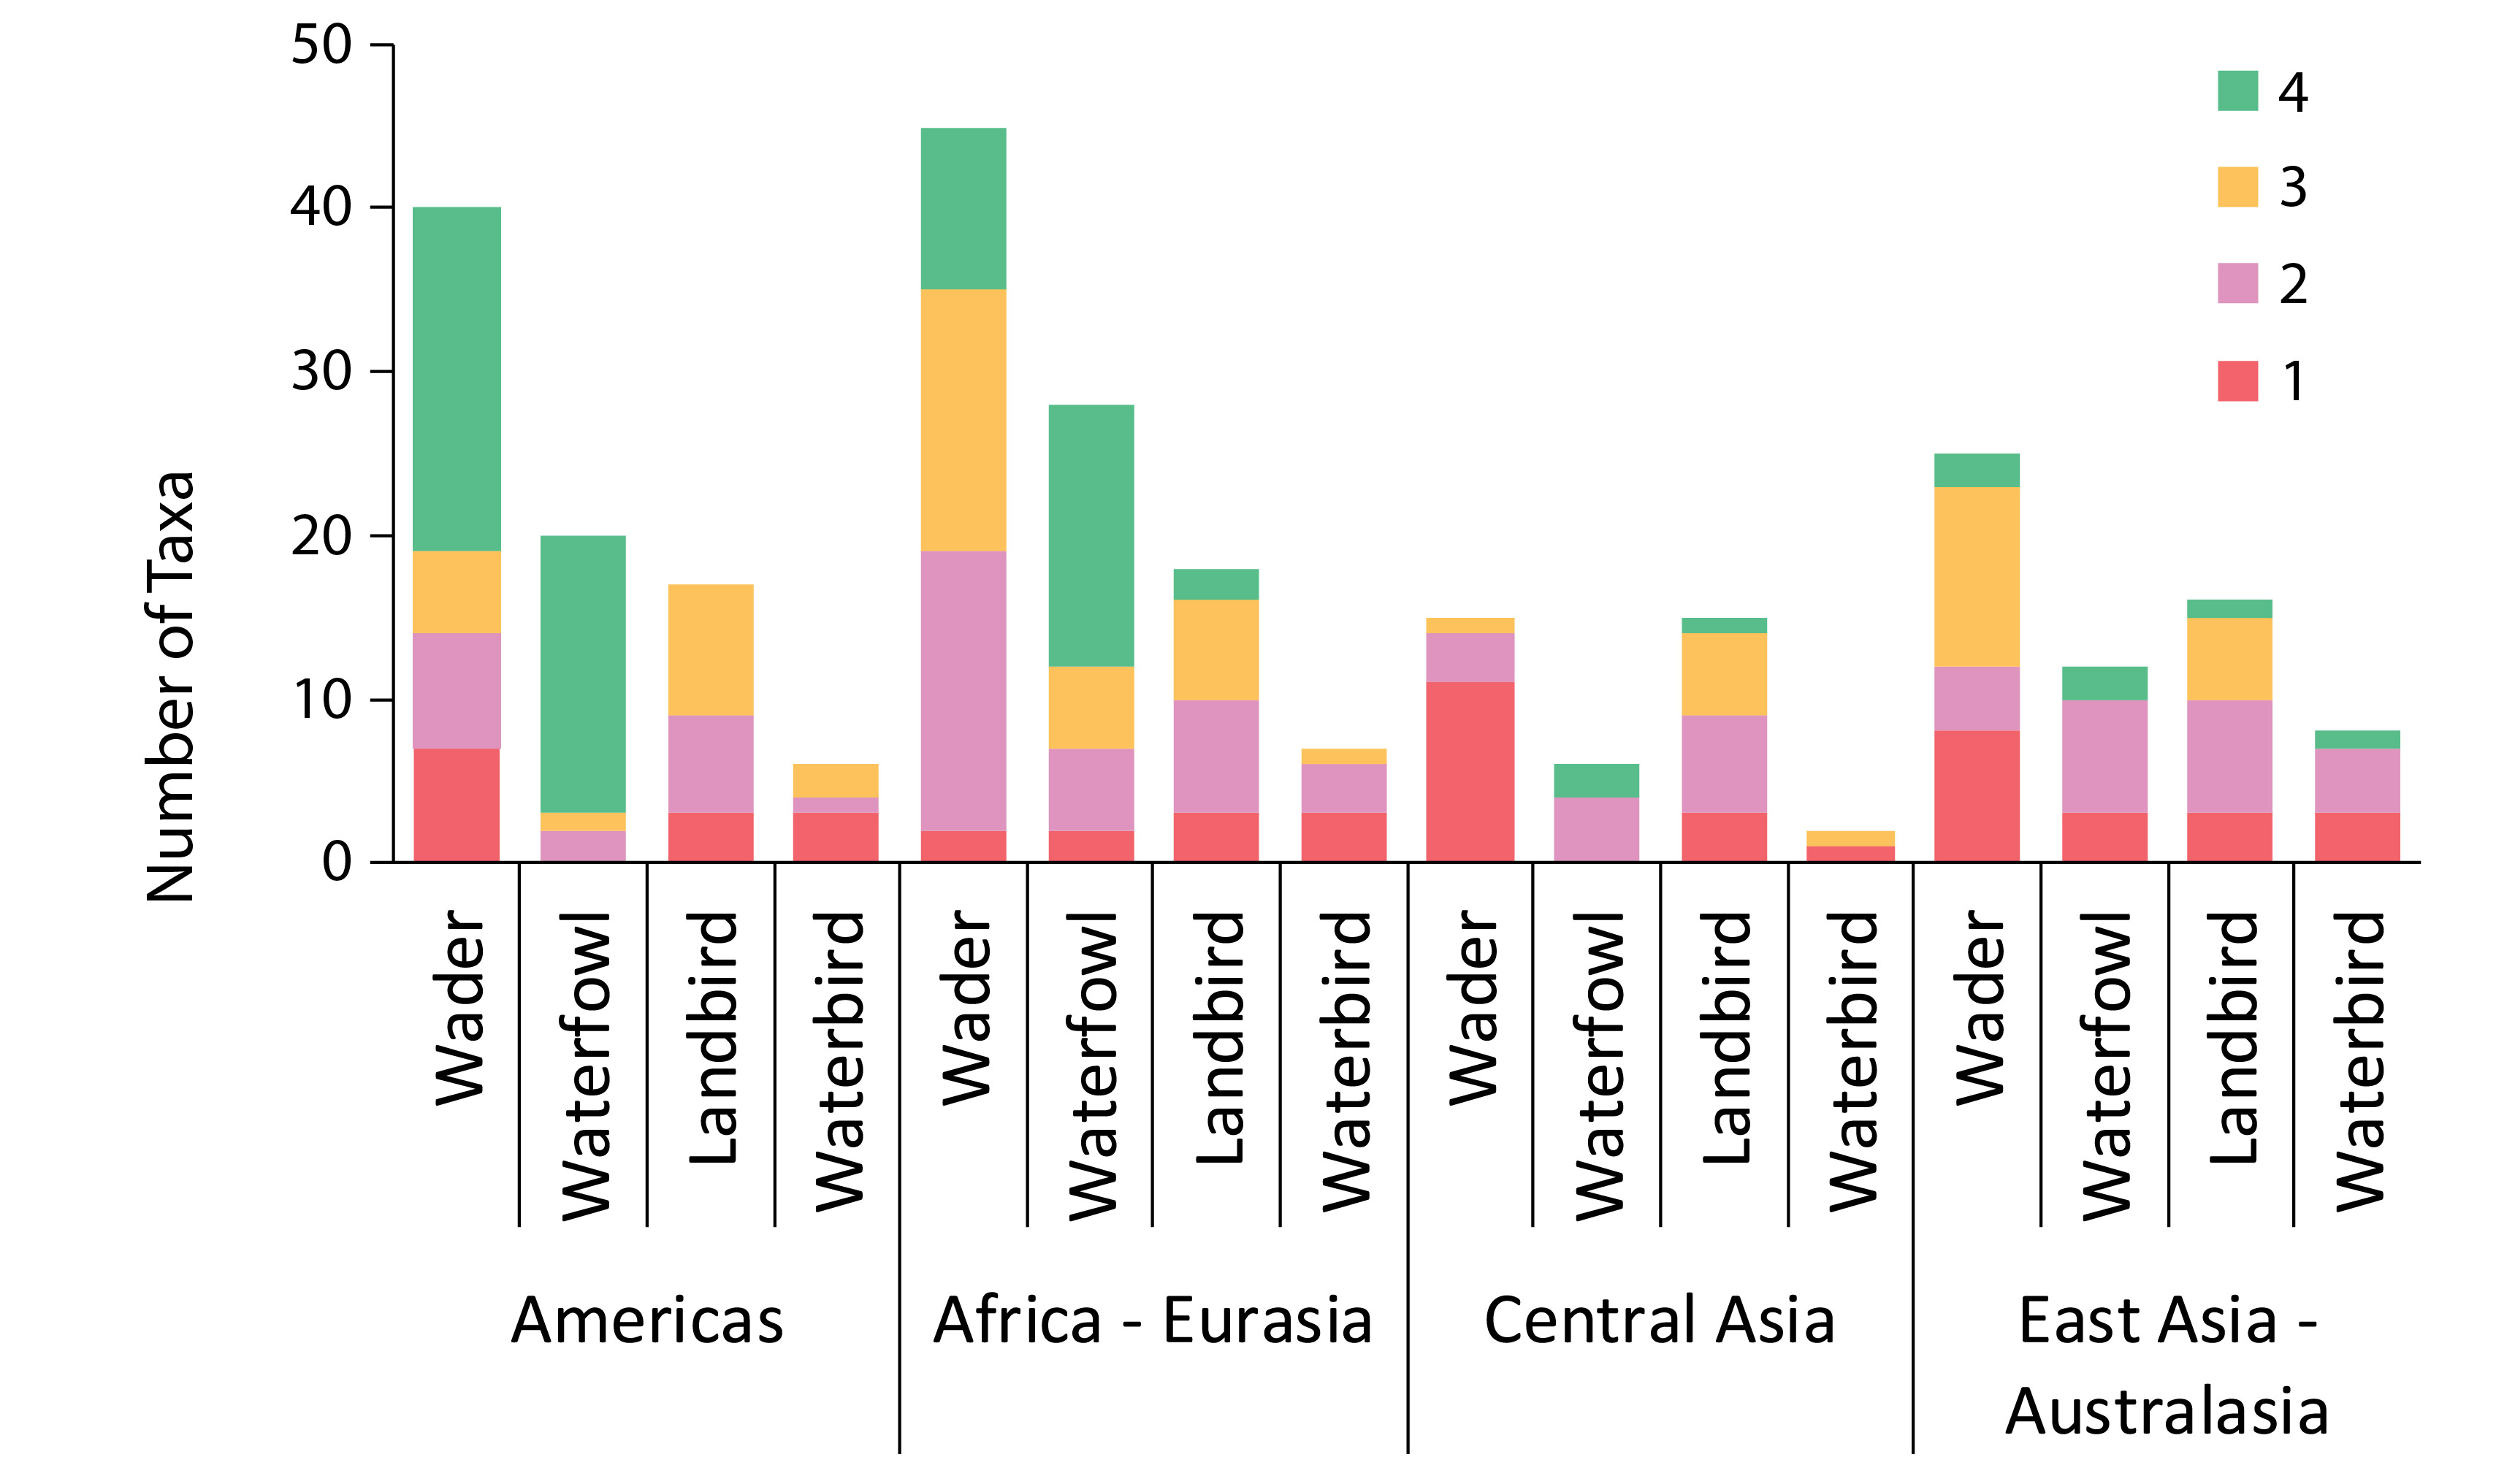
Trend quality categories are: (1) data are lacking such that trends are unknown, (2) regional and site-specific monitoring allow for assumptions of trend, (3) international monitoring allows estimation of trend direction, and (4) rigorously designed international monitoring programmes yield estimates of precision. Modified from Smith et al. 2020. STATE OF THE ARCTIC TERRESTRIAL BIODIVERSITY REPORT - Chapte31 - Page 59 - Figure 3.26