 Arctic SDI catalogue
Vegetation
Type of resources
Available actions
Topics
Keywords
Contact for the resource
Provided by
Years
Formats
Representation types
Update frequencies
status
Service types
Scale
-
Vegetation characterization for Congaree National Park, SC
-
Vegetation characterization for Agate Fossil Beds National Monument, NE
-
Vegetation characterization for Badlands National Park, SD
-
Vegetation characterization for Allegheny Portage Railroad, PA
-
The dataset includes two data products derived from the Visible Infrared Imaging Radiometer Suite (VIIRS) imager operated by the US National Oceanic and Atmospheric Administration (NOAA) onboard Suomi National Polar-Orbiting Partnership (SNPP) satellite: 1) Normalized Difference Vegetation Index (NDVI) 2) Snow Mask (Snow) with supplementary information about data quality and scene identification Each product, NDVI and Snow, has been derived at two spatial resolutions: 1) I-band resolution for 250-m spatial grid (VIIRS image bands I1 and I2) 2) M-band resolution for 500-m spatial grid (VIIRS moderate resolution bands M5 and M7) Datasets are produced with a daily temporal frequency, i.e. one file per day. The study area with the size of 5,700 km × 4,800 km covers Canada and neighboring regions (Trishchenko, 2019). The VIIRS time series are produced from VIIRS /SNPP imagery at CCRS from January 1, 2017.
-
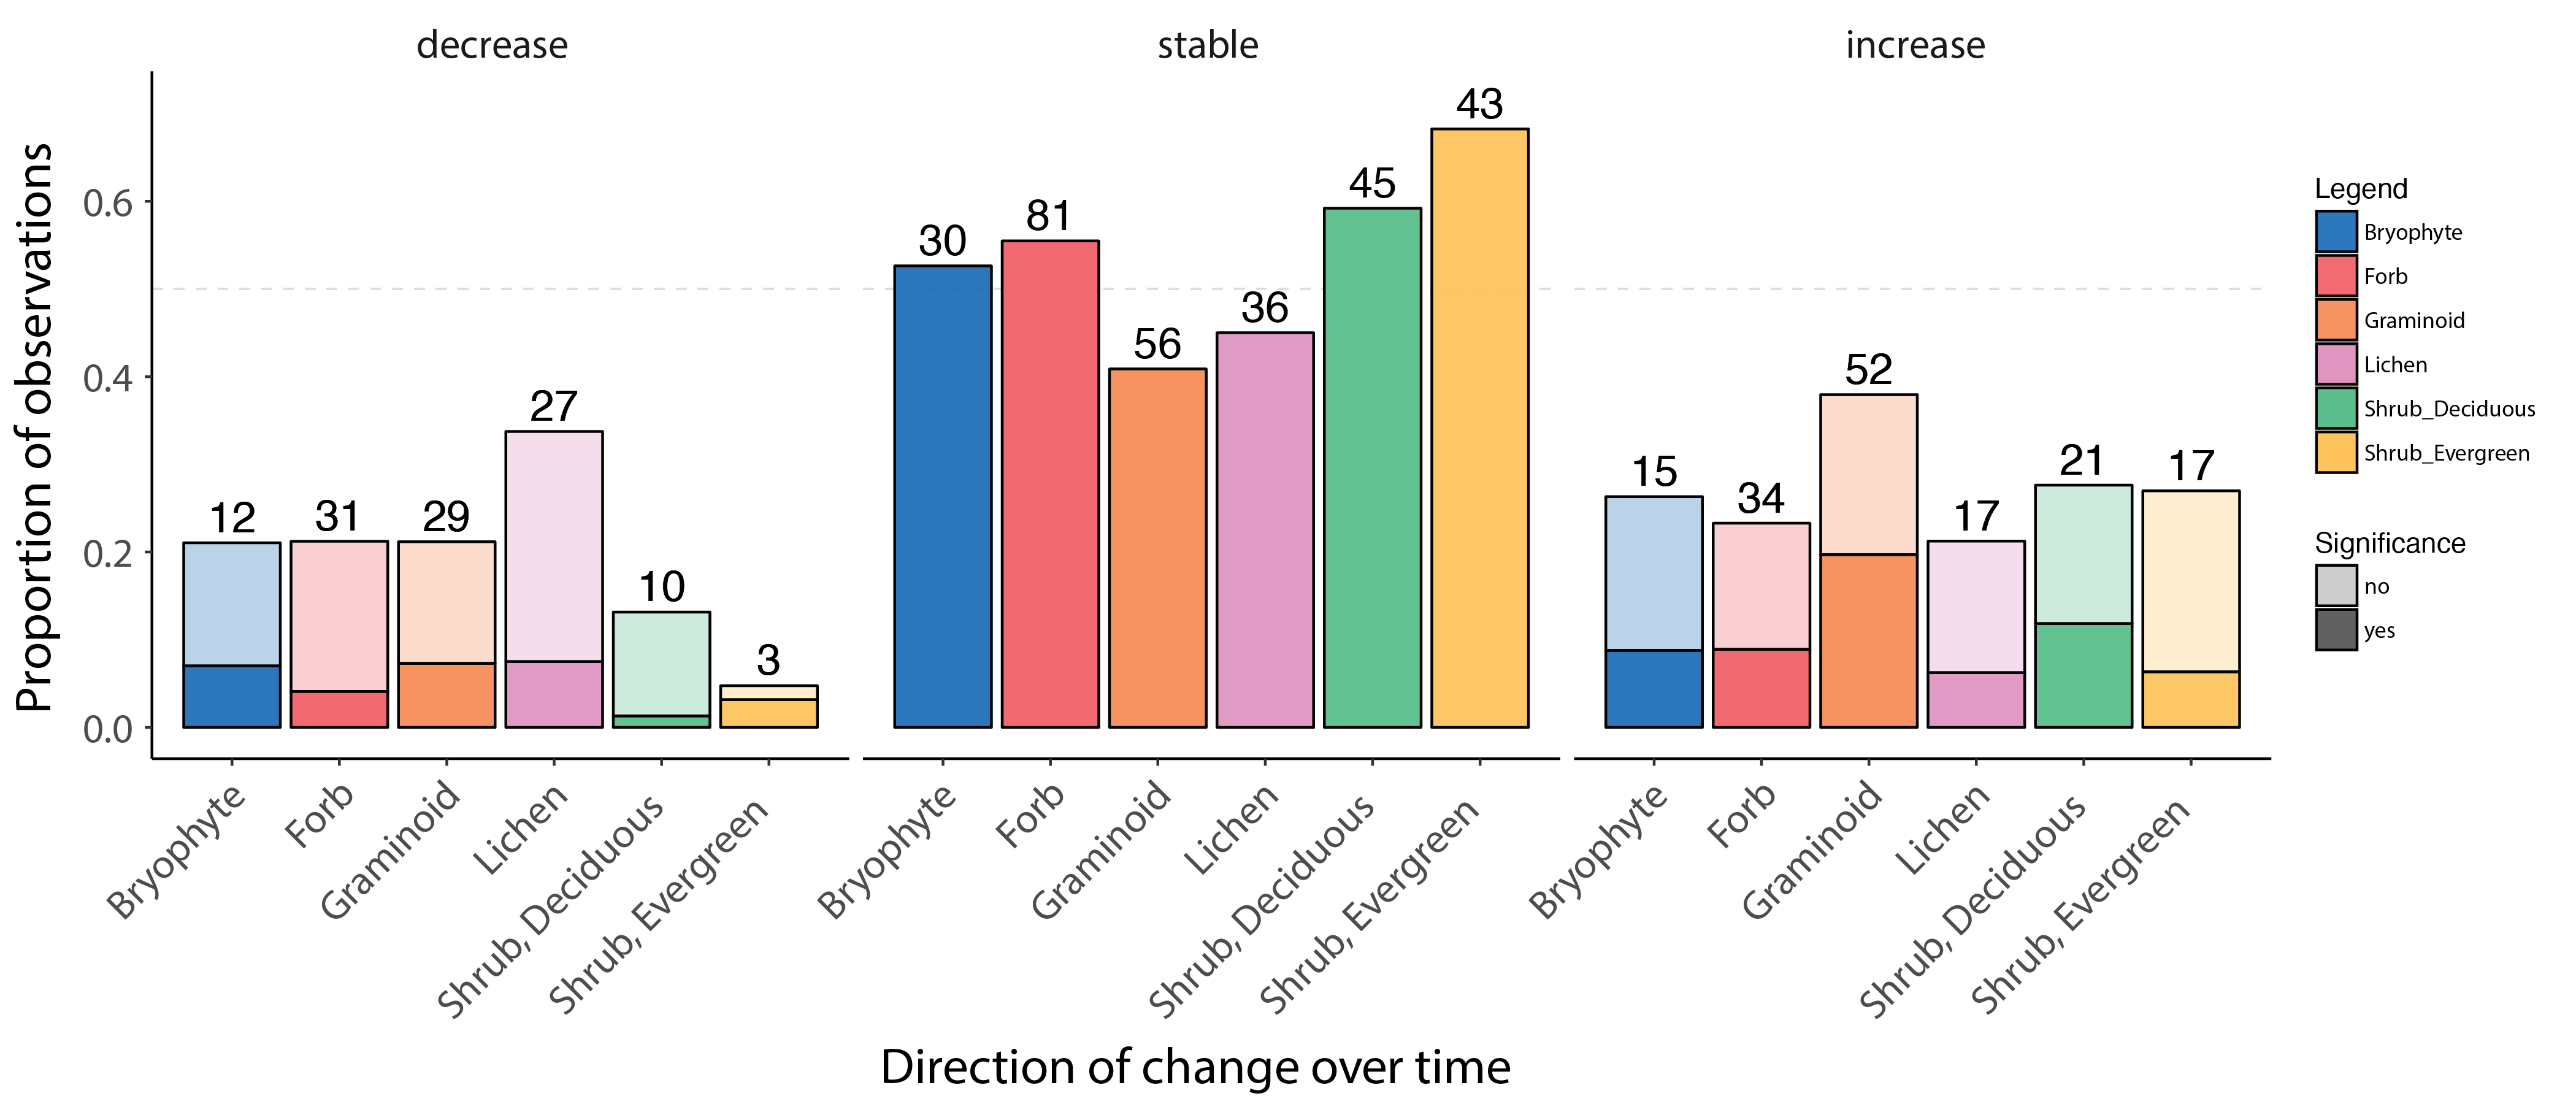
Change in forb, graminoid and shrub abundance by species or functional group over time based on local field studies across the Arctic, ranging from 5 to 43 years of duration. The bars show the proportion of observed decreasing, stable and increasing change in abundance, based on published studies. The darker portions of each bar represent a significant decrease, stable state, or increase, and lighter shading represents marginally significant change. The numbers above each bar indicate the number of observations in that group. Modified from Bjorkman et al. 2020. STATE OF THE ARCTIC TERRESTRIAL BIODIVERSITY REPORT - Chapter 3 - Page 31- Figure 3.2
-
Primary Productivity is calculated from NASA Aqua MODIS Chl a SST data. THIS IS AN EXPERIMENTAL PRODUCT: intended strictly for scientific evaluation by professional marine scientists.
-

**Note that topographic maps at a scale of 1/100,000 are no longer updated. For the latest update date, see the [metadata] (ftp://transfert.mern.gouv.qc.ca/public/diffusion/RGQ/Documentation/BDAT/Metadonnees_BDAT100k_NordSud.xls). The reference map data is now constituted using a continuous information layer approach: ** * [AQNetwork+] (https://www.donneesquebec.ca/recherche/fr/dataset/adresses-quebec) * [Quebec Hydrographic Network Geobase (GRHQ)] (https://www.donneesquebec.ca/recherche/dataset/grhq) * [Administrative divisions on a scale of 1/20,000 (SDA)] (https://www.donneesquebec.ca/recherche/fr/dataset/decoupages-administratifs) * [Regional Coherent Hydro Digital Terrain Models (RTM)] (https://www.donneesquebec.ca/recherche/fr/dataset/modeles-numerique-de-terrain-hydro-coherents-a-l-echelle-regionale) ___ Topographic maps at a scale of 1/100,000 offer an overview of the occupation of Quebec territory at a scale of 1/100,000. A series in the south (266 sheets) and a series in the north (151 sheets) of the 53rd parallel cover the majority of Quebec. The data is less than 10 meters accurate and each file covers an area of approximately 4,000 km2, equivalent to 16 sheets at [a scale of 1/20,000] (https://www.donneesquebec.ca/recherche/fr/dataset/cartes-topographiques-a-l-echelle-de-1-20-000 “Topographic maps at a scale of 1/20,000”). Main components: * Hydrography (lakes of more than three hectares, permanent watercourses, swamps, etc.). * Vegetation (wooded areas and peatlands of more than 13 hectares). * The constructions of man: * transport infrastructures (passable roads, bridges, airports, etc.); * buildings larger than 12,500 m2; * equipment and designated areas. * The relief (level curves at an equidistance of 20 meters and elevation points). ##### Special features of the series south of the 53rd parallel * The data is obtained by generalizing map data at a scale of 1/20,000. Between the 51st and 53rd parallel, they are extracted from SPOT satellite imagery at 10 meters of resolution. * The data formats available for this series are: * ArcInfo cover (vector); * GeoTIFF, CCL projection (matrix); * GeoTIFF, MTM projection (matrix); * PDF (matrix). ##### Special features of the series north of the 53rd parallel * The data is obtained by generalizing cartographic data from Natural Resources Canada (CanVec product) at a scale of 1:50,000. Multi-source data, namely data from Adresses Québec, data on airports and hydrobases from the Ministère des Transports du Québec, and data on reservoirs from Hydro-Québec, increase the quality of this cartographic product on a scale of 1/100,000. * The data format available for this series is: * FGDB (vector).**This third party metadata element was translated using an automated translation tool (Amazon Translate).**
-
Primary Productivity is calculated from NASA Aqua MODIS Chl a SST data. THIS IS AN EXPERIMENTAL PRODUCT: intended strictly for scientific evaluation by professional marine scientists.
-
**Note that topographic maps at a scale of 1/20,000 are no longer updated. For the latest update date, see the [metadata] (ftp://transfert.mern.gouv.qc.ca/public/diffusion/RGQ/Documentation/BDTQ/Metadonnees_Topo-20K.xls). The reference cartographic data is now constituted according to a continuous information layer approach: ** * [AQNetwork+] (https://www.donneesquebec.ca/recherche/fr/dataset/adresses-quebec) * [Quebec Hydrographic Network Geobase (GRHQ)] (https://www.donneesquebec.ca/recherche/dataset/grhq) * [Administrative divisions on a scale of 1/20,000 (SDA)] (https://www.donneesquebec.ca/recherche/fr/dataset/decoupages-administratifs) * [Regional Coherent Hydro Digital Terrain Models (RTM)] (https://www.donneesquebec.ca/recherche/fr/dataset/modeles-numerique-de-terrain-hydro-coherents-a-l-echelle-regionale) * [Quebec framework for buildings] (https://www.donneesquebec.ca/recherche/dataset/referentiel_bati) *** Topographic maps at a scale of 1/20,000 are the official cartographic base of the Government of Quebec. They cover almost all of the territory south of the 52nd parallel. The data is extracted from aerial photographs at a scale of 1:40,000 taken at an altitude of 6,300 meters. They offer an accuracy of approximately four meters in planimetry. In hypsometry, it is about two meters for dimensional points and about five meters for level curves. Each file covers an area of approximately 250 km2. The main components are: * Hydrography (lakes, rivers, streams, swamps, etc.). * Vegetation (forests, peatlands, nurseries, orchards, etc.). * The constructions of man: * transport infrastructure (roads, bridges, airports, etc.); * buildings (mobile homes, silos, greenhouses, etc.); * equipment (docks, electrical power transmission lines, surface tanks, etc.); * designated areas (golf courses, loan benches, etc.) * The relief (the level curves are generally at an equidistance of ten meters and, in some cases, they can vary between eight and twenty meters).**This third party metadata element was translated using an automated translation tool (Amazon Translate).**