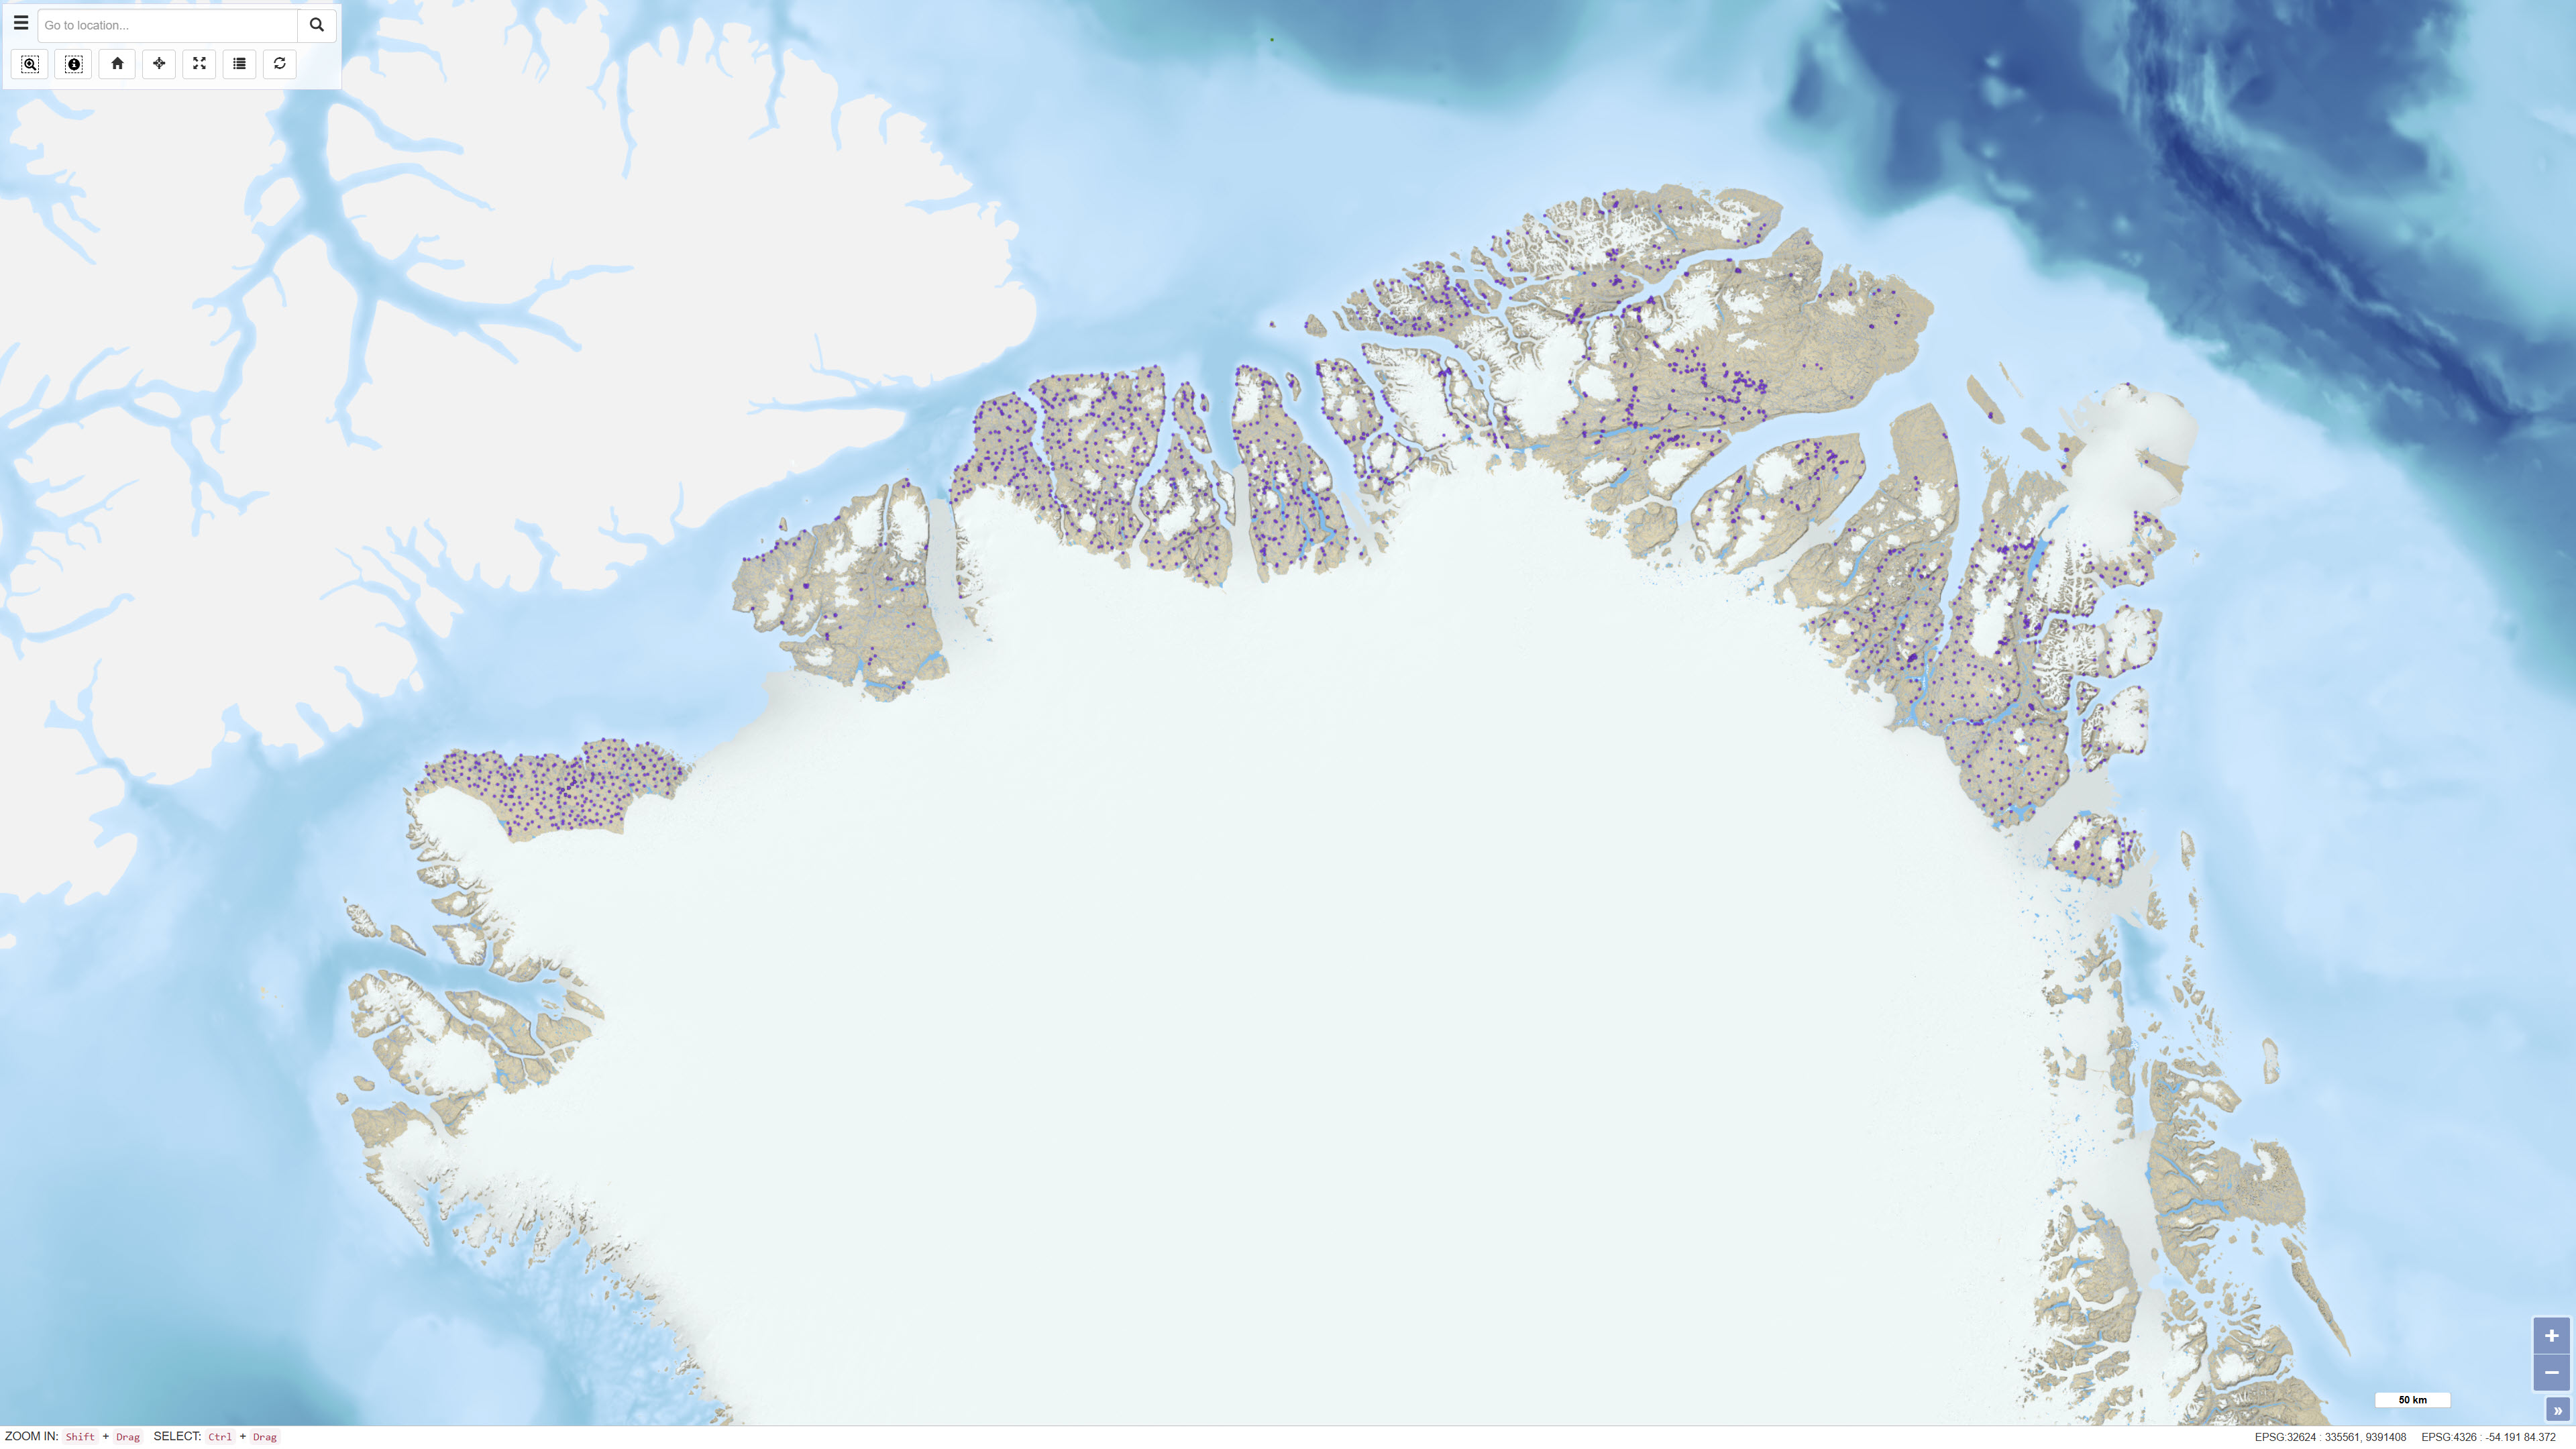
 Arctic SDI catalogue
asNeeded
Type of resources
Available actions
Topics
Keywords
Contact for the resource
Provided by
Formats
Representation types
Update frequencies
status
Service types
Scale
-
The seabed sediment map shows the distribution of seabed sediments in Danish waters and represents an integrated interpretation of sediment types within the upper approximately 0.5 metres of the seabed. Sediment classes are defined based on grain-size composition and reflect an average of the surface sediments. Glacial till is classified as a mixed sediment, while sedimentary bedrock indicates areas where deposits several million years old are exposed on the seabed. The map was updated in 2020 and builds upon the previous version from 2014, with newly mapped areas added at full level of detail. The dataset provides a nationwide overview of seabed sedimentary conditions and is used, among other purposes, for raw material mapping, marine spatial planning, and environmental assessments.
-

-
Ujarassiorit is Greenland’s national mineral hunt, a public competition open to residents of Greenland. The initiative encourages participants to collect and submit rock samples from anywhere in Greenland to the Ministry of Mineral Resources for geological evaluation. Submitted samples are assessed by geologists, and selected participants may be awarded prizes. The purpose of Ujarassiorit is to increase public awareness of Greenland’s mineral resources and to support mineral exploration by identifying areas of geological interest through public participation. The initiative contributes to the collection of geological information and promotes engagement with geoscience among the population.
-
%20-%20datas%C3%A6t.jpg)
The dataset represents a hillshade derived from the Danish Digital Terrain Model 2007 (DHM/Terrain 2007). The hillshade is produced as a cartographic overlay layer designed to enhance terrain forms and topographic structures in the Danish landscape. The dataset is suitable for visual analysis and map presentation and can be used as a background layer together with other thematic datasets. The hillshade is based on the DHM/Terrain model, which represents terrain elevation relative to mean sea level (DVR90), with buildings, vegetation and other surface objects removed. The original terrain model is based on nationwide airborne LiDAR surveys collected during 2005–2007 and subsequently processed and quality assured.
-
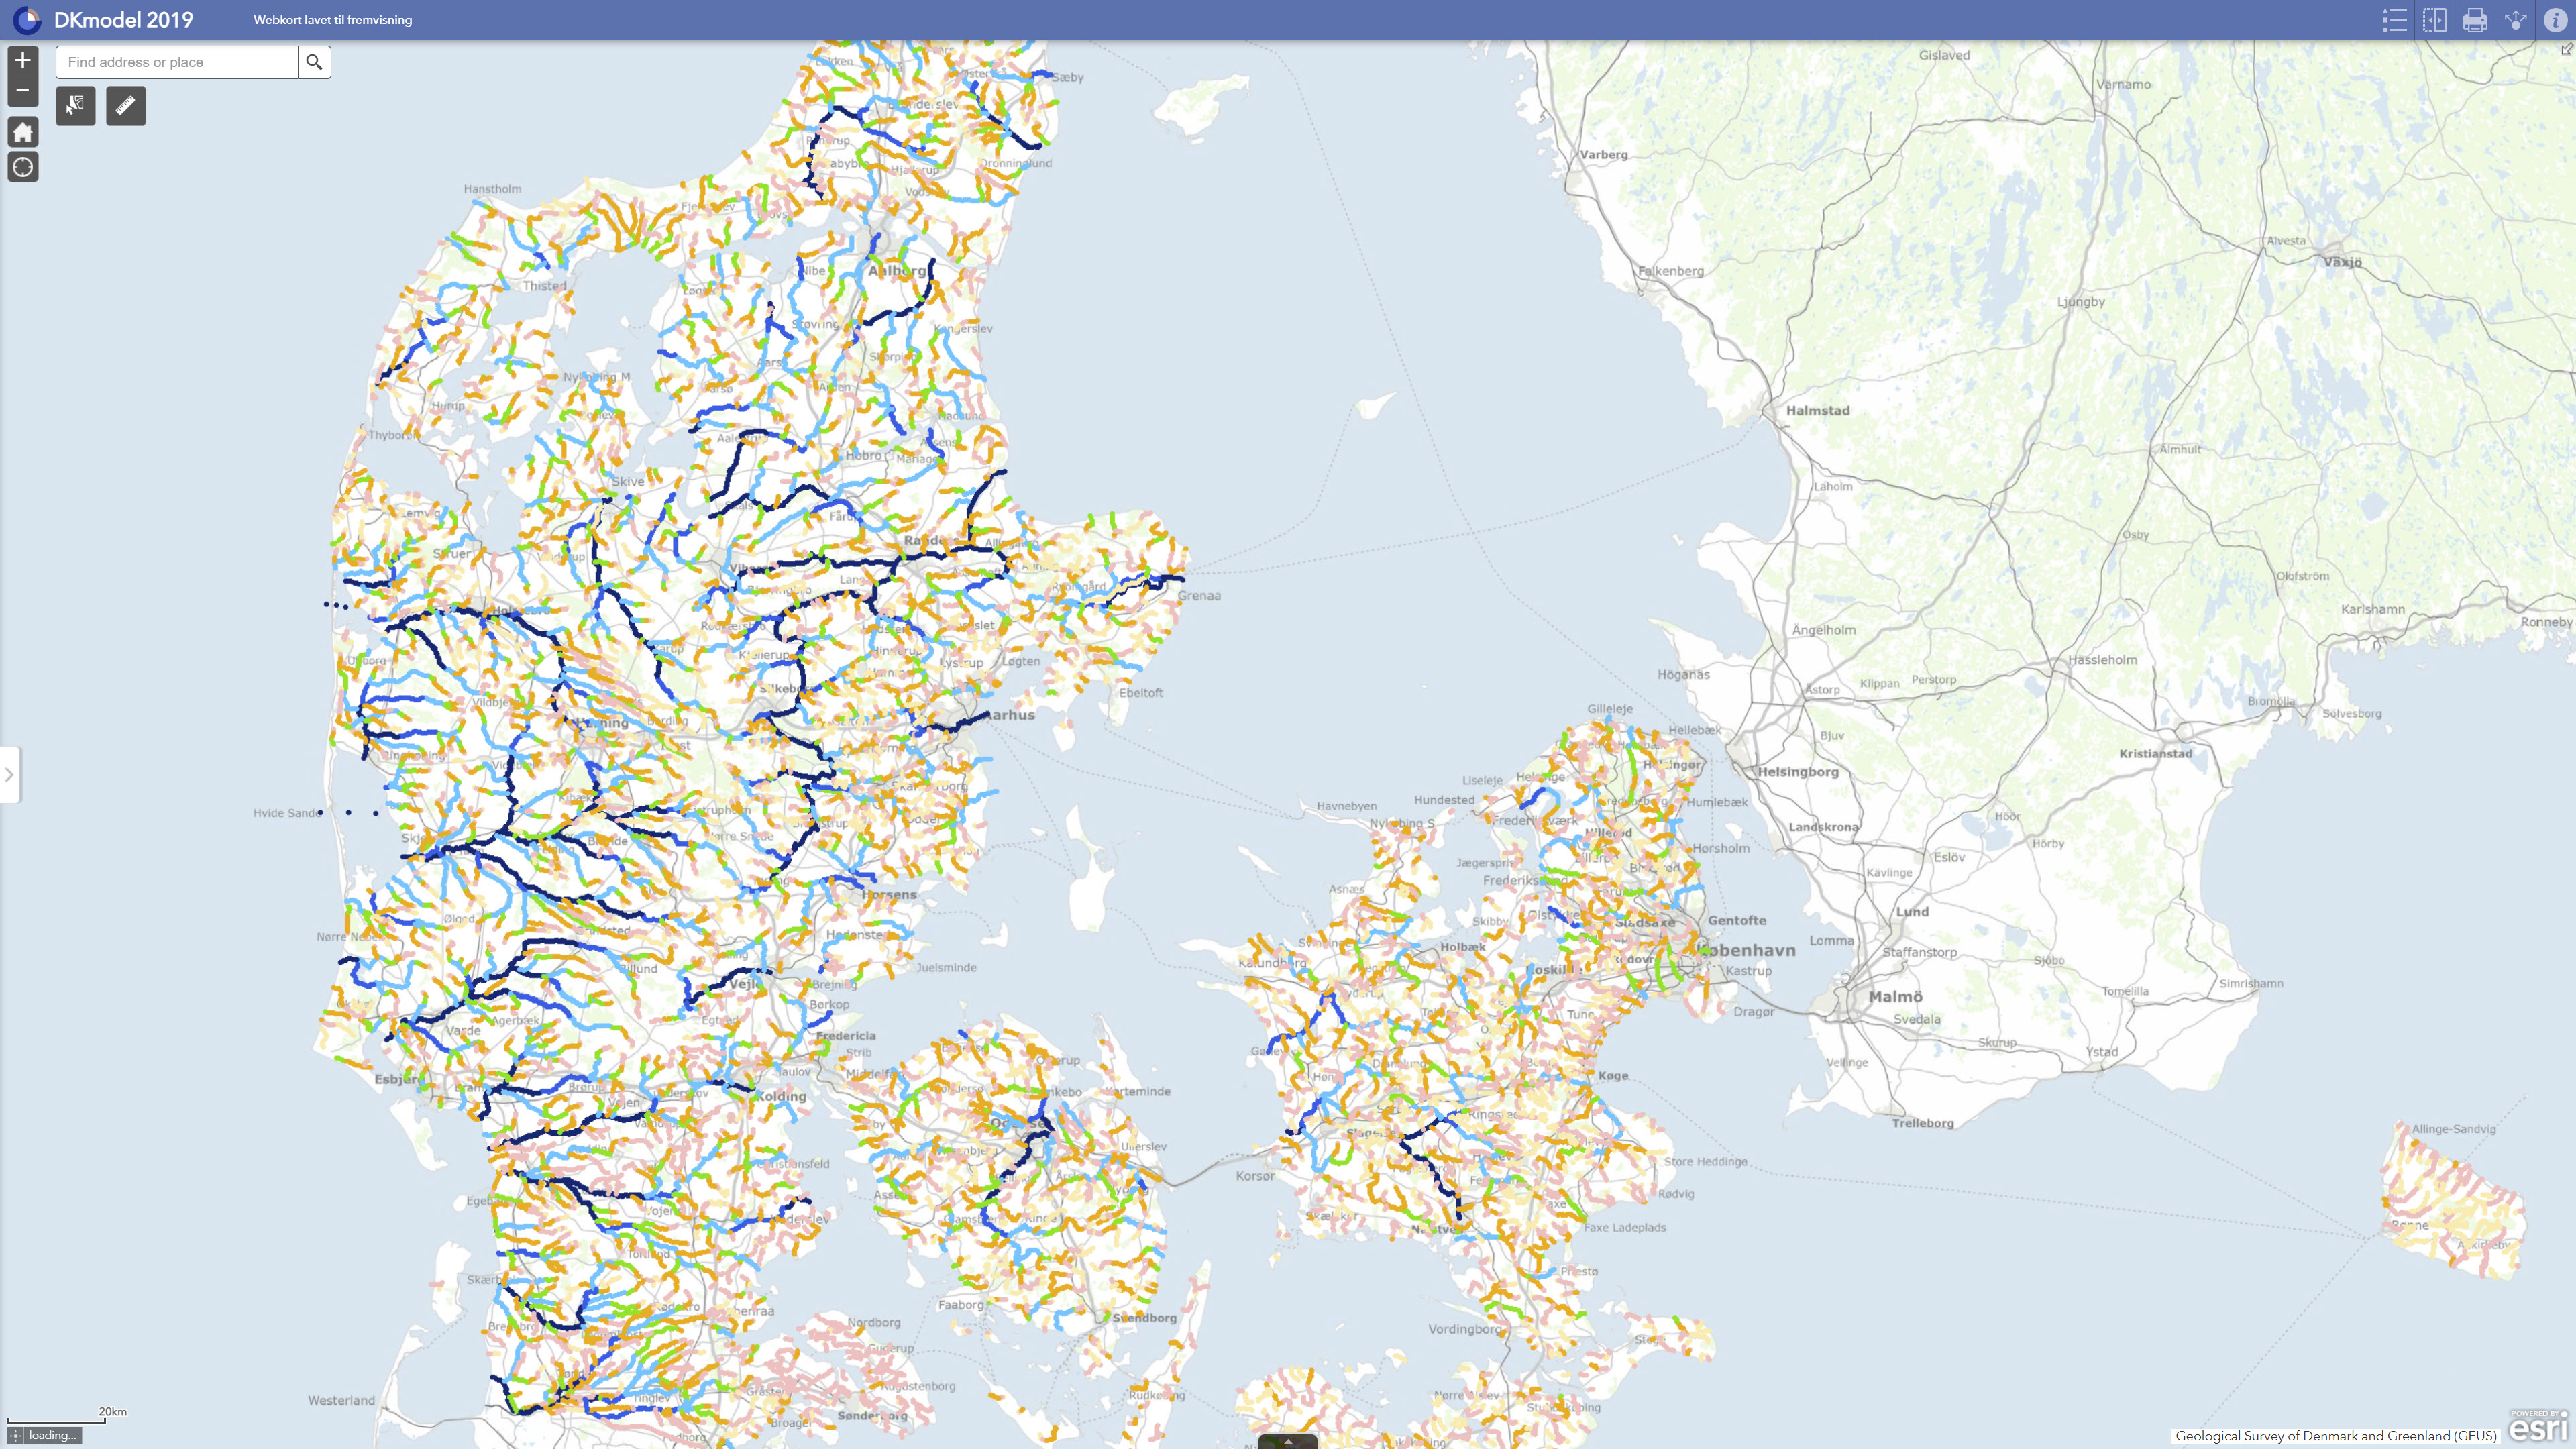
DK model 2019 – Simulation results comprises calculated hydrological results from GEUS’ national hydrological model for Denmark. The dataset contains derived results from model runs with DK model 2019, including calculations of water balance, groundwater recharge, impacts of water abstraction, groundwater drawdown, streamflow impacts and changes in flow-related indicators. The results include, among other outputs, comparisons between scenarios with current abstraction and reference scenarios without abstraction. The dataset is used for regional assessment of hydrological conditions, screening of water resource and impact conditions, and documentation of model-calculated results. The results are model-based and should be used with due consideration of the regional purpose, model uncertainties and limitations of DK model in relation to local-scale applications.
-
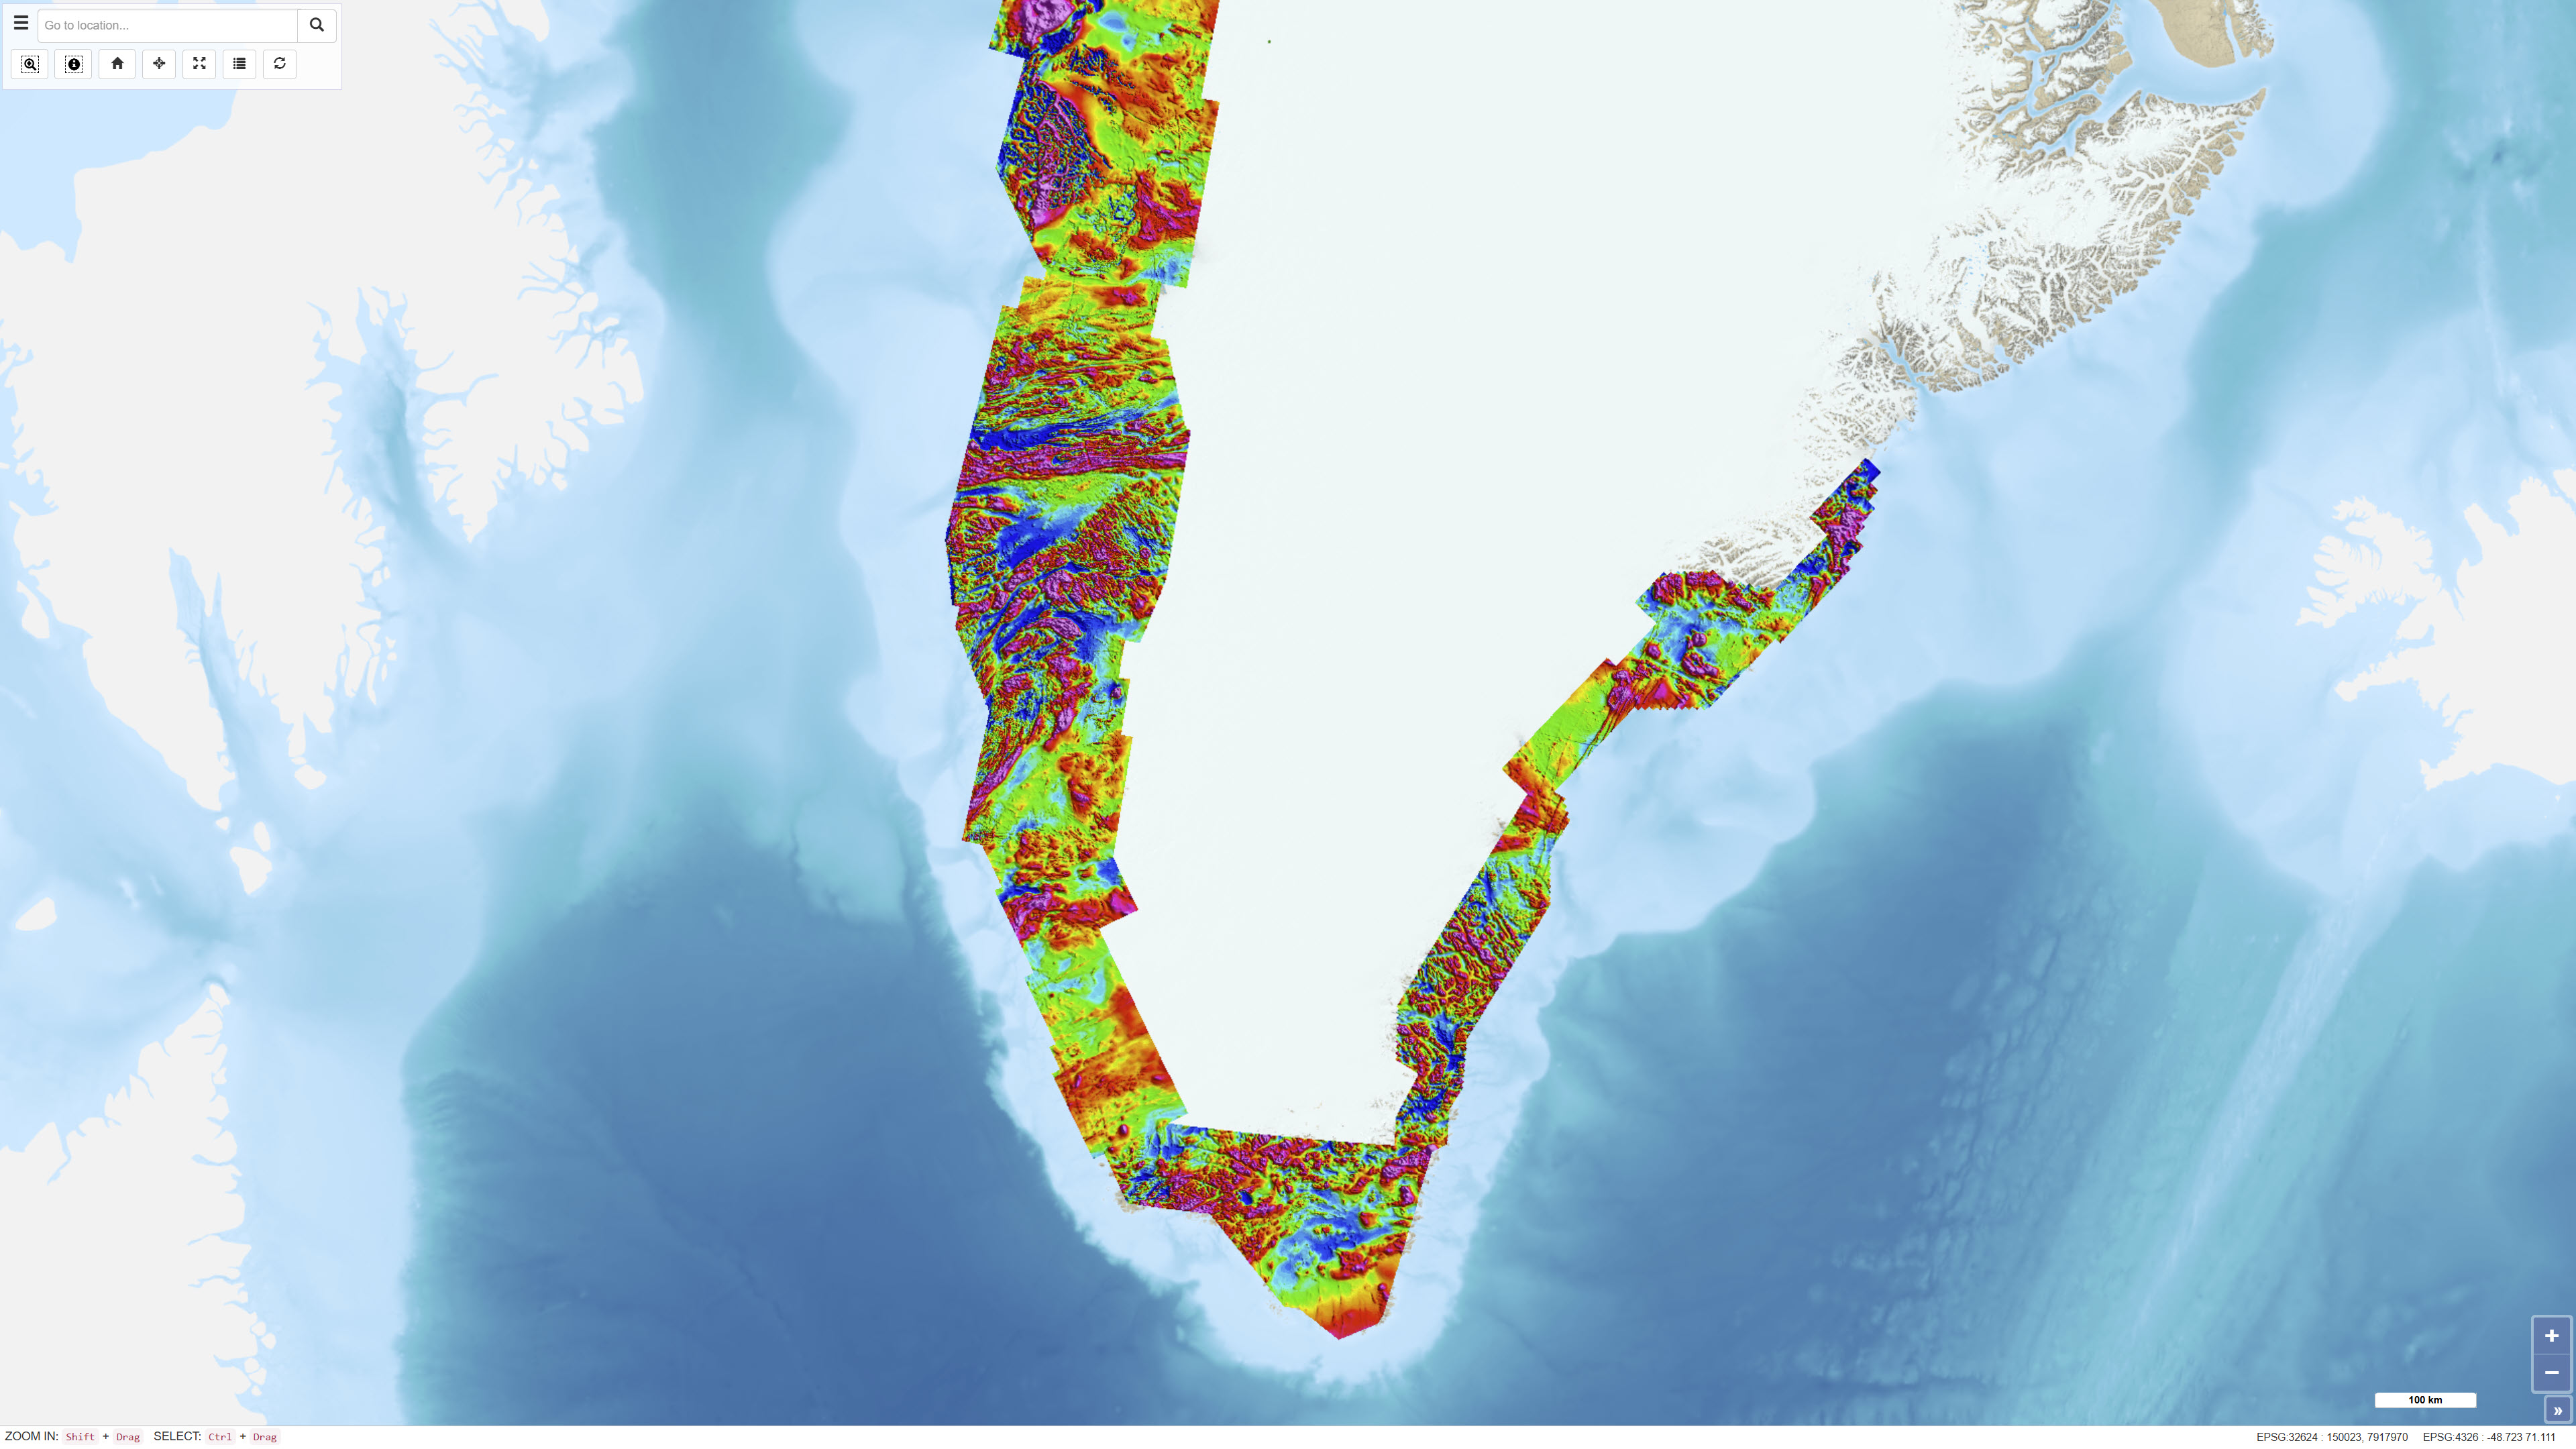
The Regional AEROMAG 1992–2013 Surveys comprise a compilation of high-resolution airborne magnetic surveys acquired by GGU/GEUS between 1993 and 2013 and financed by the Government of Greenland. The overlapping surveys cover approximately 300,000 km² and include the total ice-free onshore areas and near-coastal offshore regions of West Greenland, South Greenland and southern East Greenland. All surveys were acquired using aircraft with similar flight parameters, including line spacings of 500–1,000 m and cross-line spacing of approximately 5,000 m, and with flight altitudes of about 300 m above ground level or seafloor along gently draped surfaces. These consistent acquisition parameters allow the individual surveys to be integrated into a coherent, high-quality regional magnetic data compilation. The total magnetic anomaly map was generated by merging grids from separately processed datasets using the grid-knitting module in Oasis Montaj. The data are IGRF-corrected but not reduced to the pole, and the crustal magnetic field model MF7 was used as a regional reference grid during compilation.
-
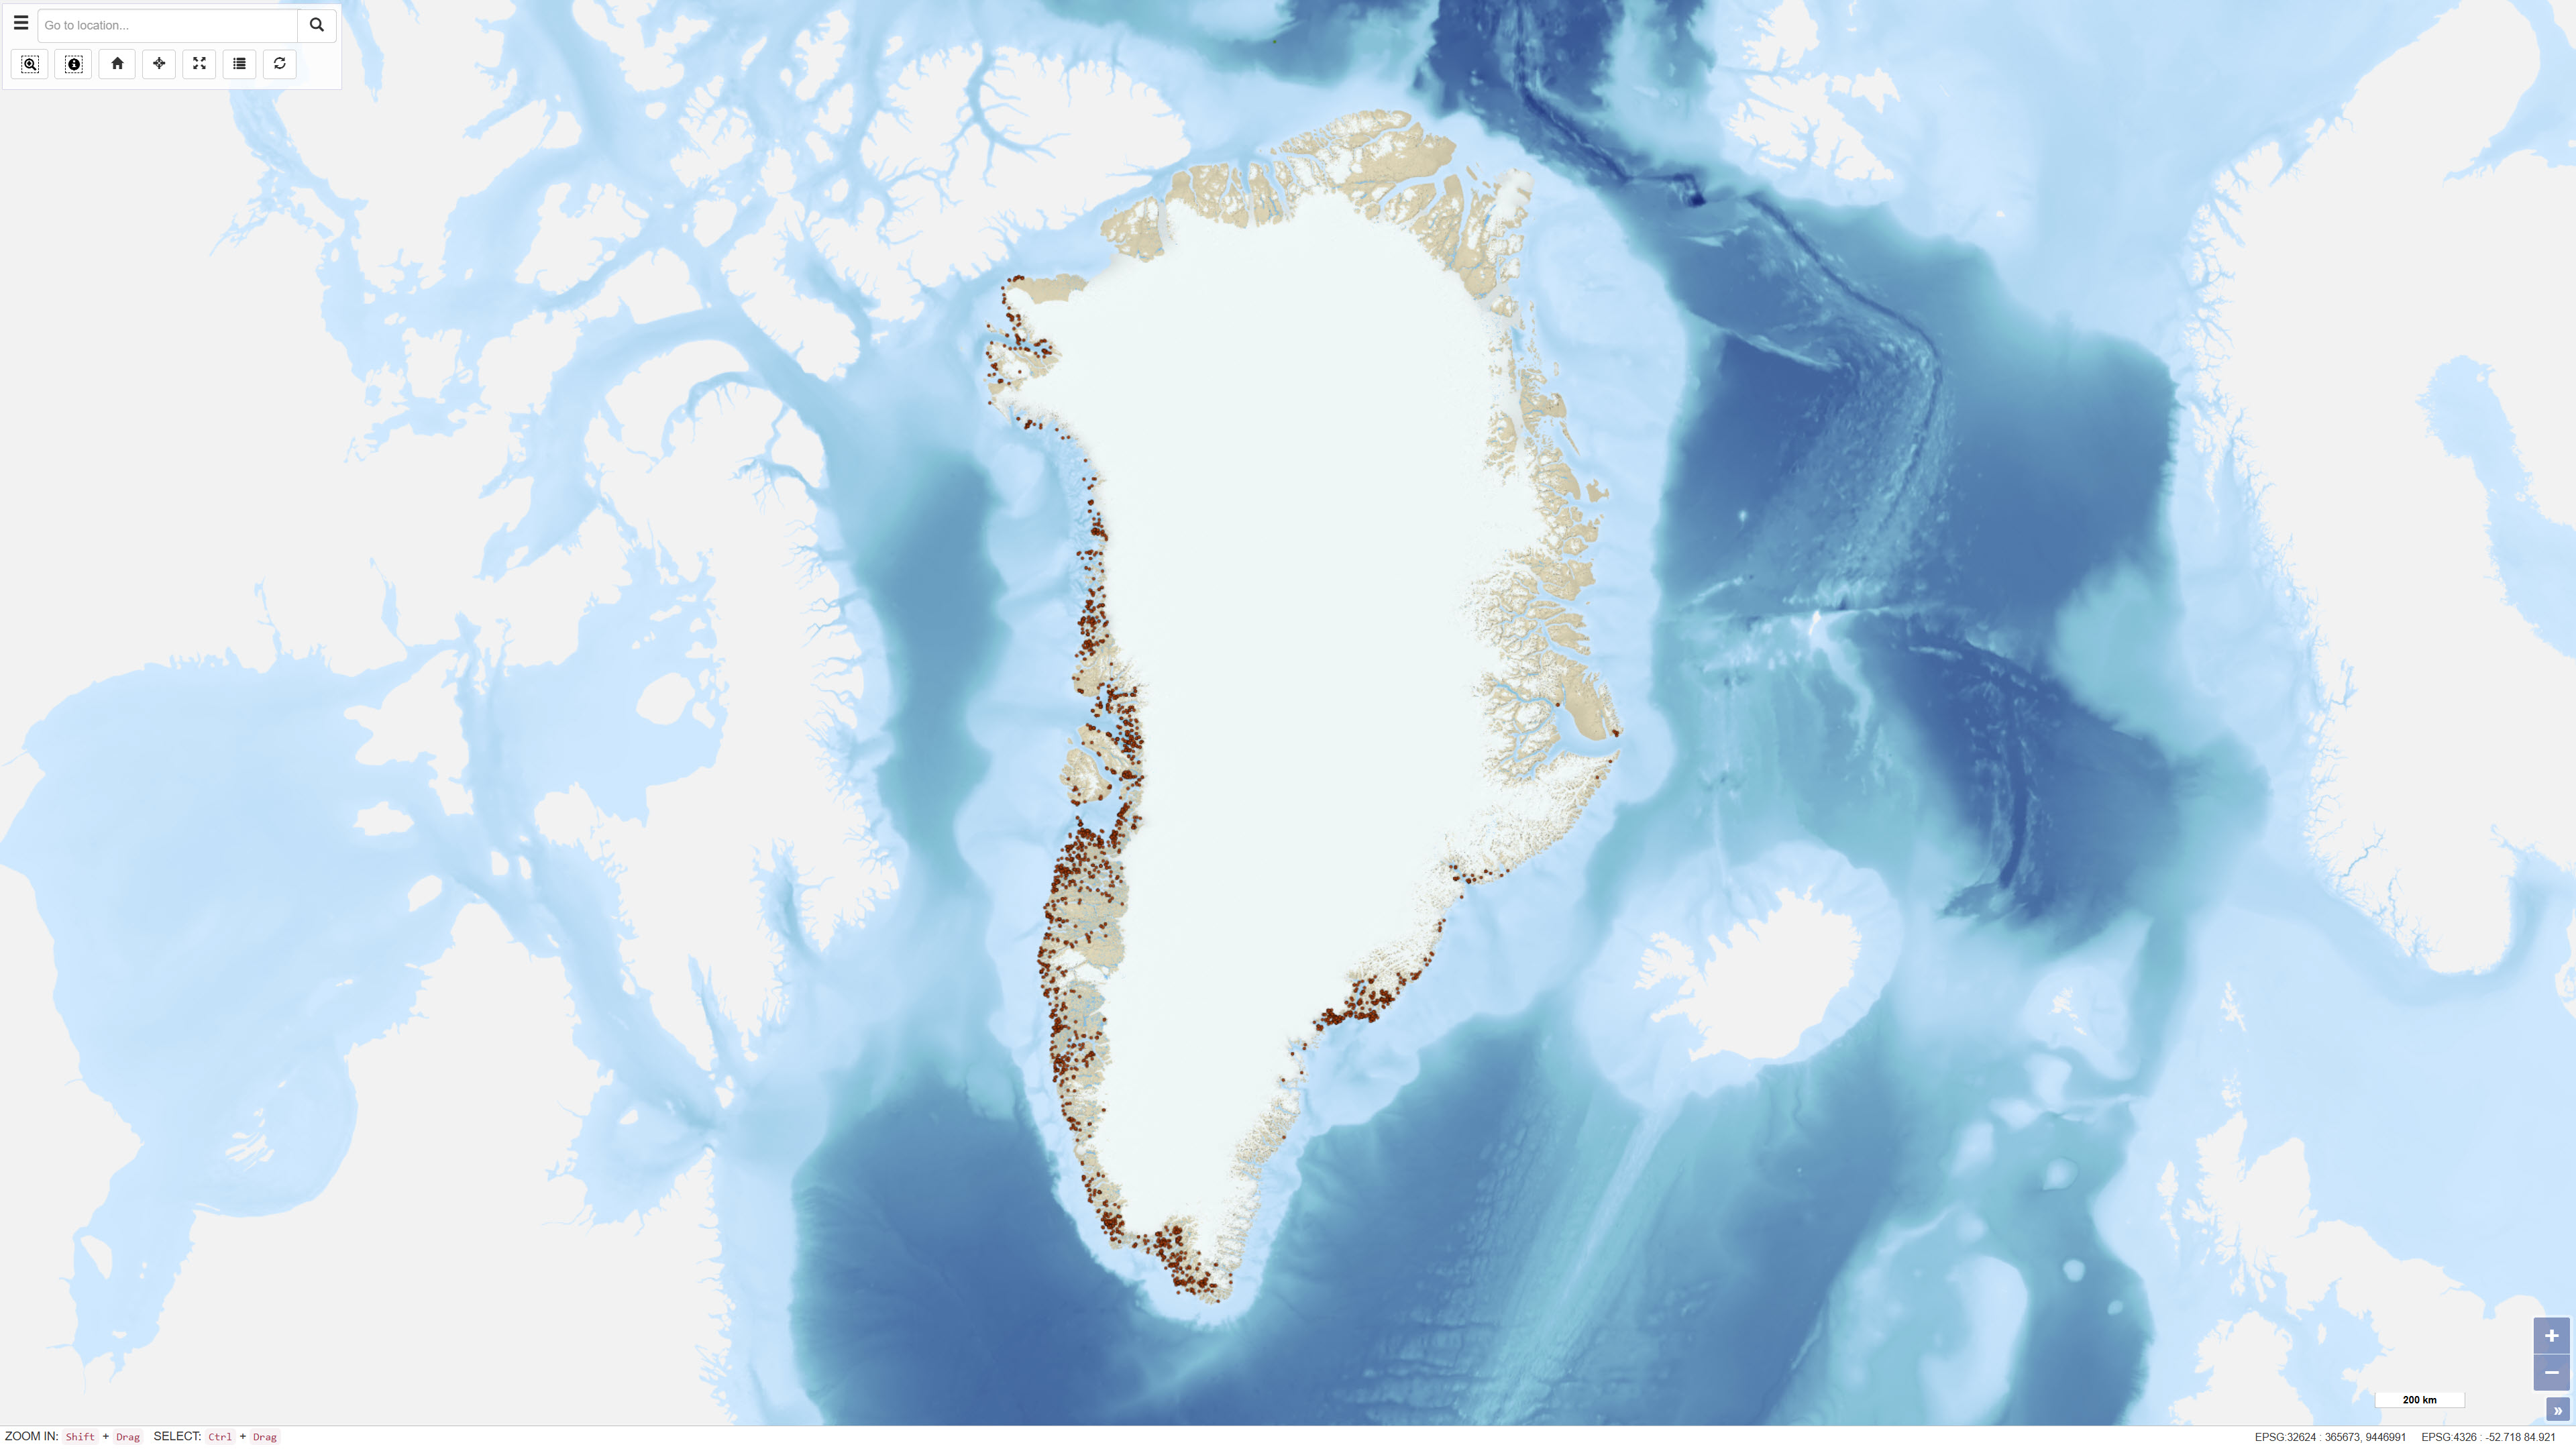
This dataset comprises calibrated geochemical data from stream sediment and soil samples collected in North Greenland between 1978 and 1999, supplemented by extensive reanalyses in 2011. The dataset includes selected elements relevant for the evaluation of zinc mineralisation: CaO, K₂O, Ba, Cu, Sr and Zn. A total of 2,469 stream sediment samples and 204 soil samples were included. The analytical values represent the most reliable results following systematic quality control and calibration procedures designed to eliminate bias between analytical methods and analytical periods, as described in Thrane et al. (2011). All values below detection limit are coded as 0 in the dataset. The dataset supports regional assessment of geochemical patterns and mineral potential in North Greenland.
-
%20-%20datas%C3%A6t.jpg)
The dataset contains aeromagnetic measurements acquired during 1993–1996 in East and North-East Greenland as part of the AWI-AEROMAG project conducted by the Alfred Wegener Institute (AWI). The measurements represent regional airborne magnetometry and include total magnetic field intensity corrected for diurnal variations and the main geomagnetic field. The survey was carried out to support geological mapping and tectonic analysis of eastern Greenland. The dataset constitutes an important geophysical reference for studies of crystalline basement rocks, sedimentary basins and structural features in the region.
-
The dataset provides supporting groundwater depth values as a supplement to the mapping of potential groundwater flooding hazard areas in Denmark. The dataset shows the depth to the projected typical winter groundwater table in metres below terrain for the period 2071-2100 under the RCP8.5 emissions scenario. The depth values can be used to interpret and add detail to the potential hazard areas, including how close the groundwater table is expected to be to the terrain surface. The dataset is provided as raster data with a spatial resolution of 10 × 10 m.
-
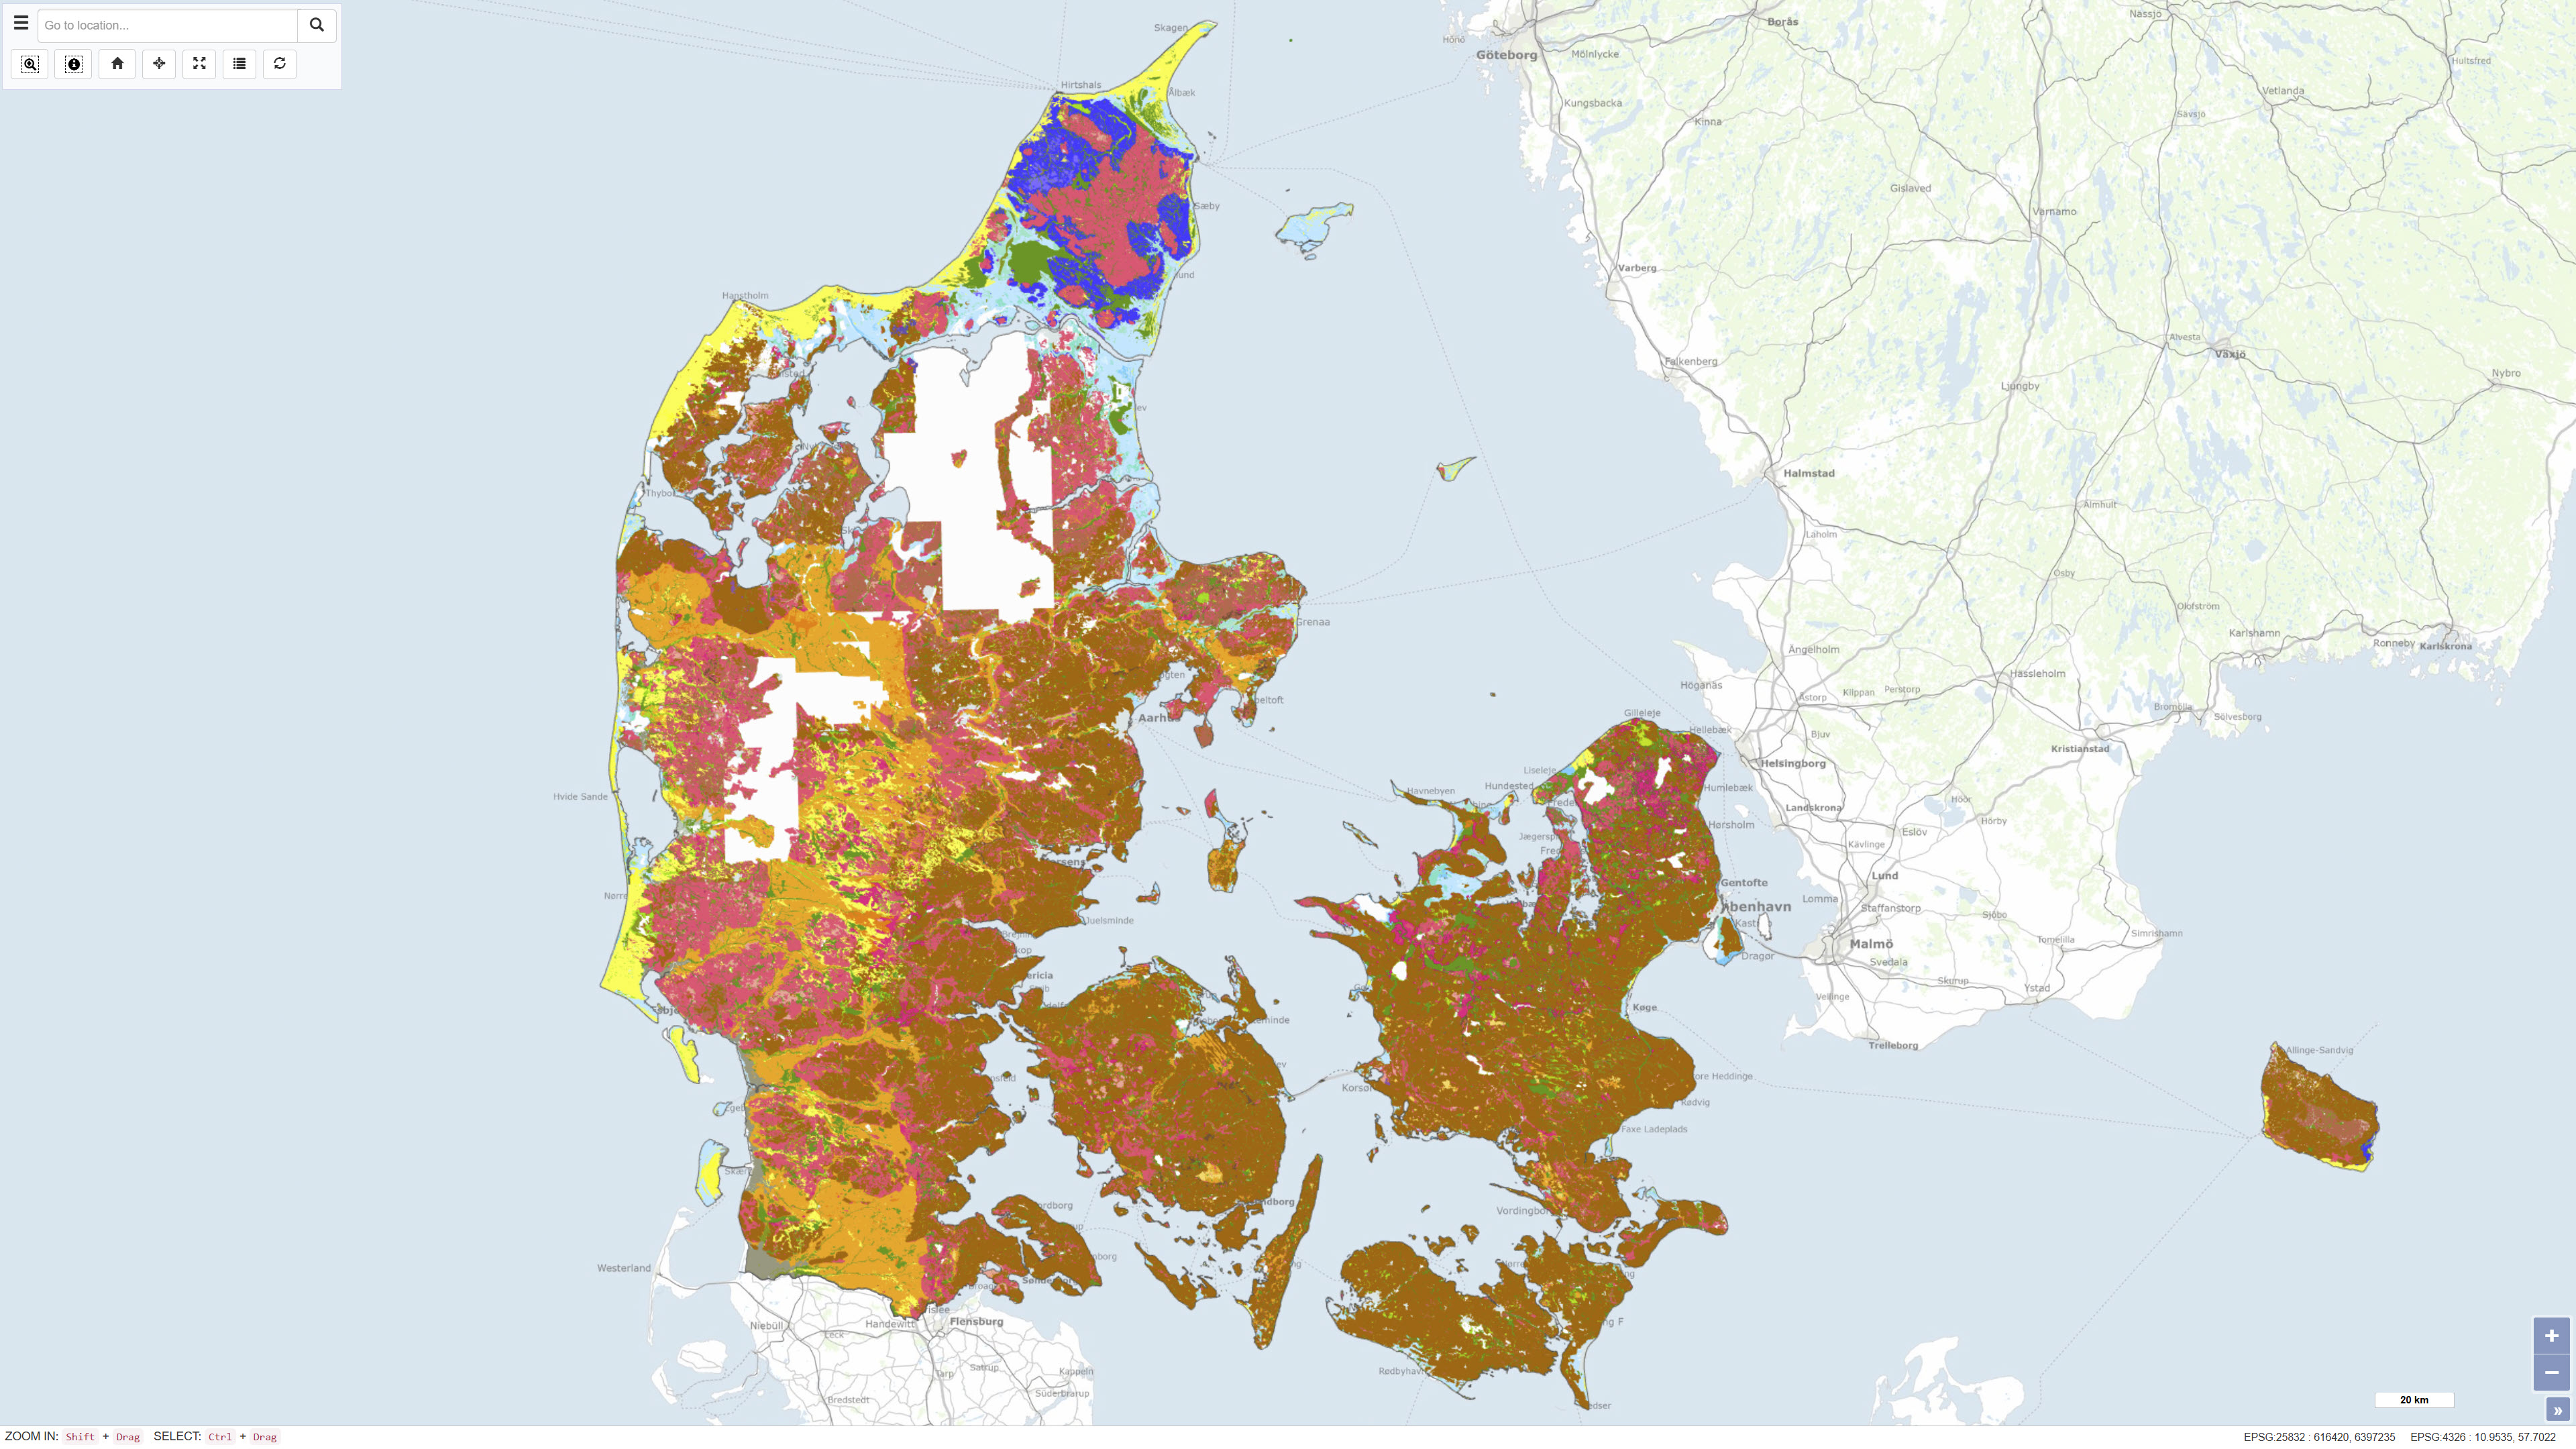
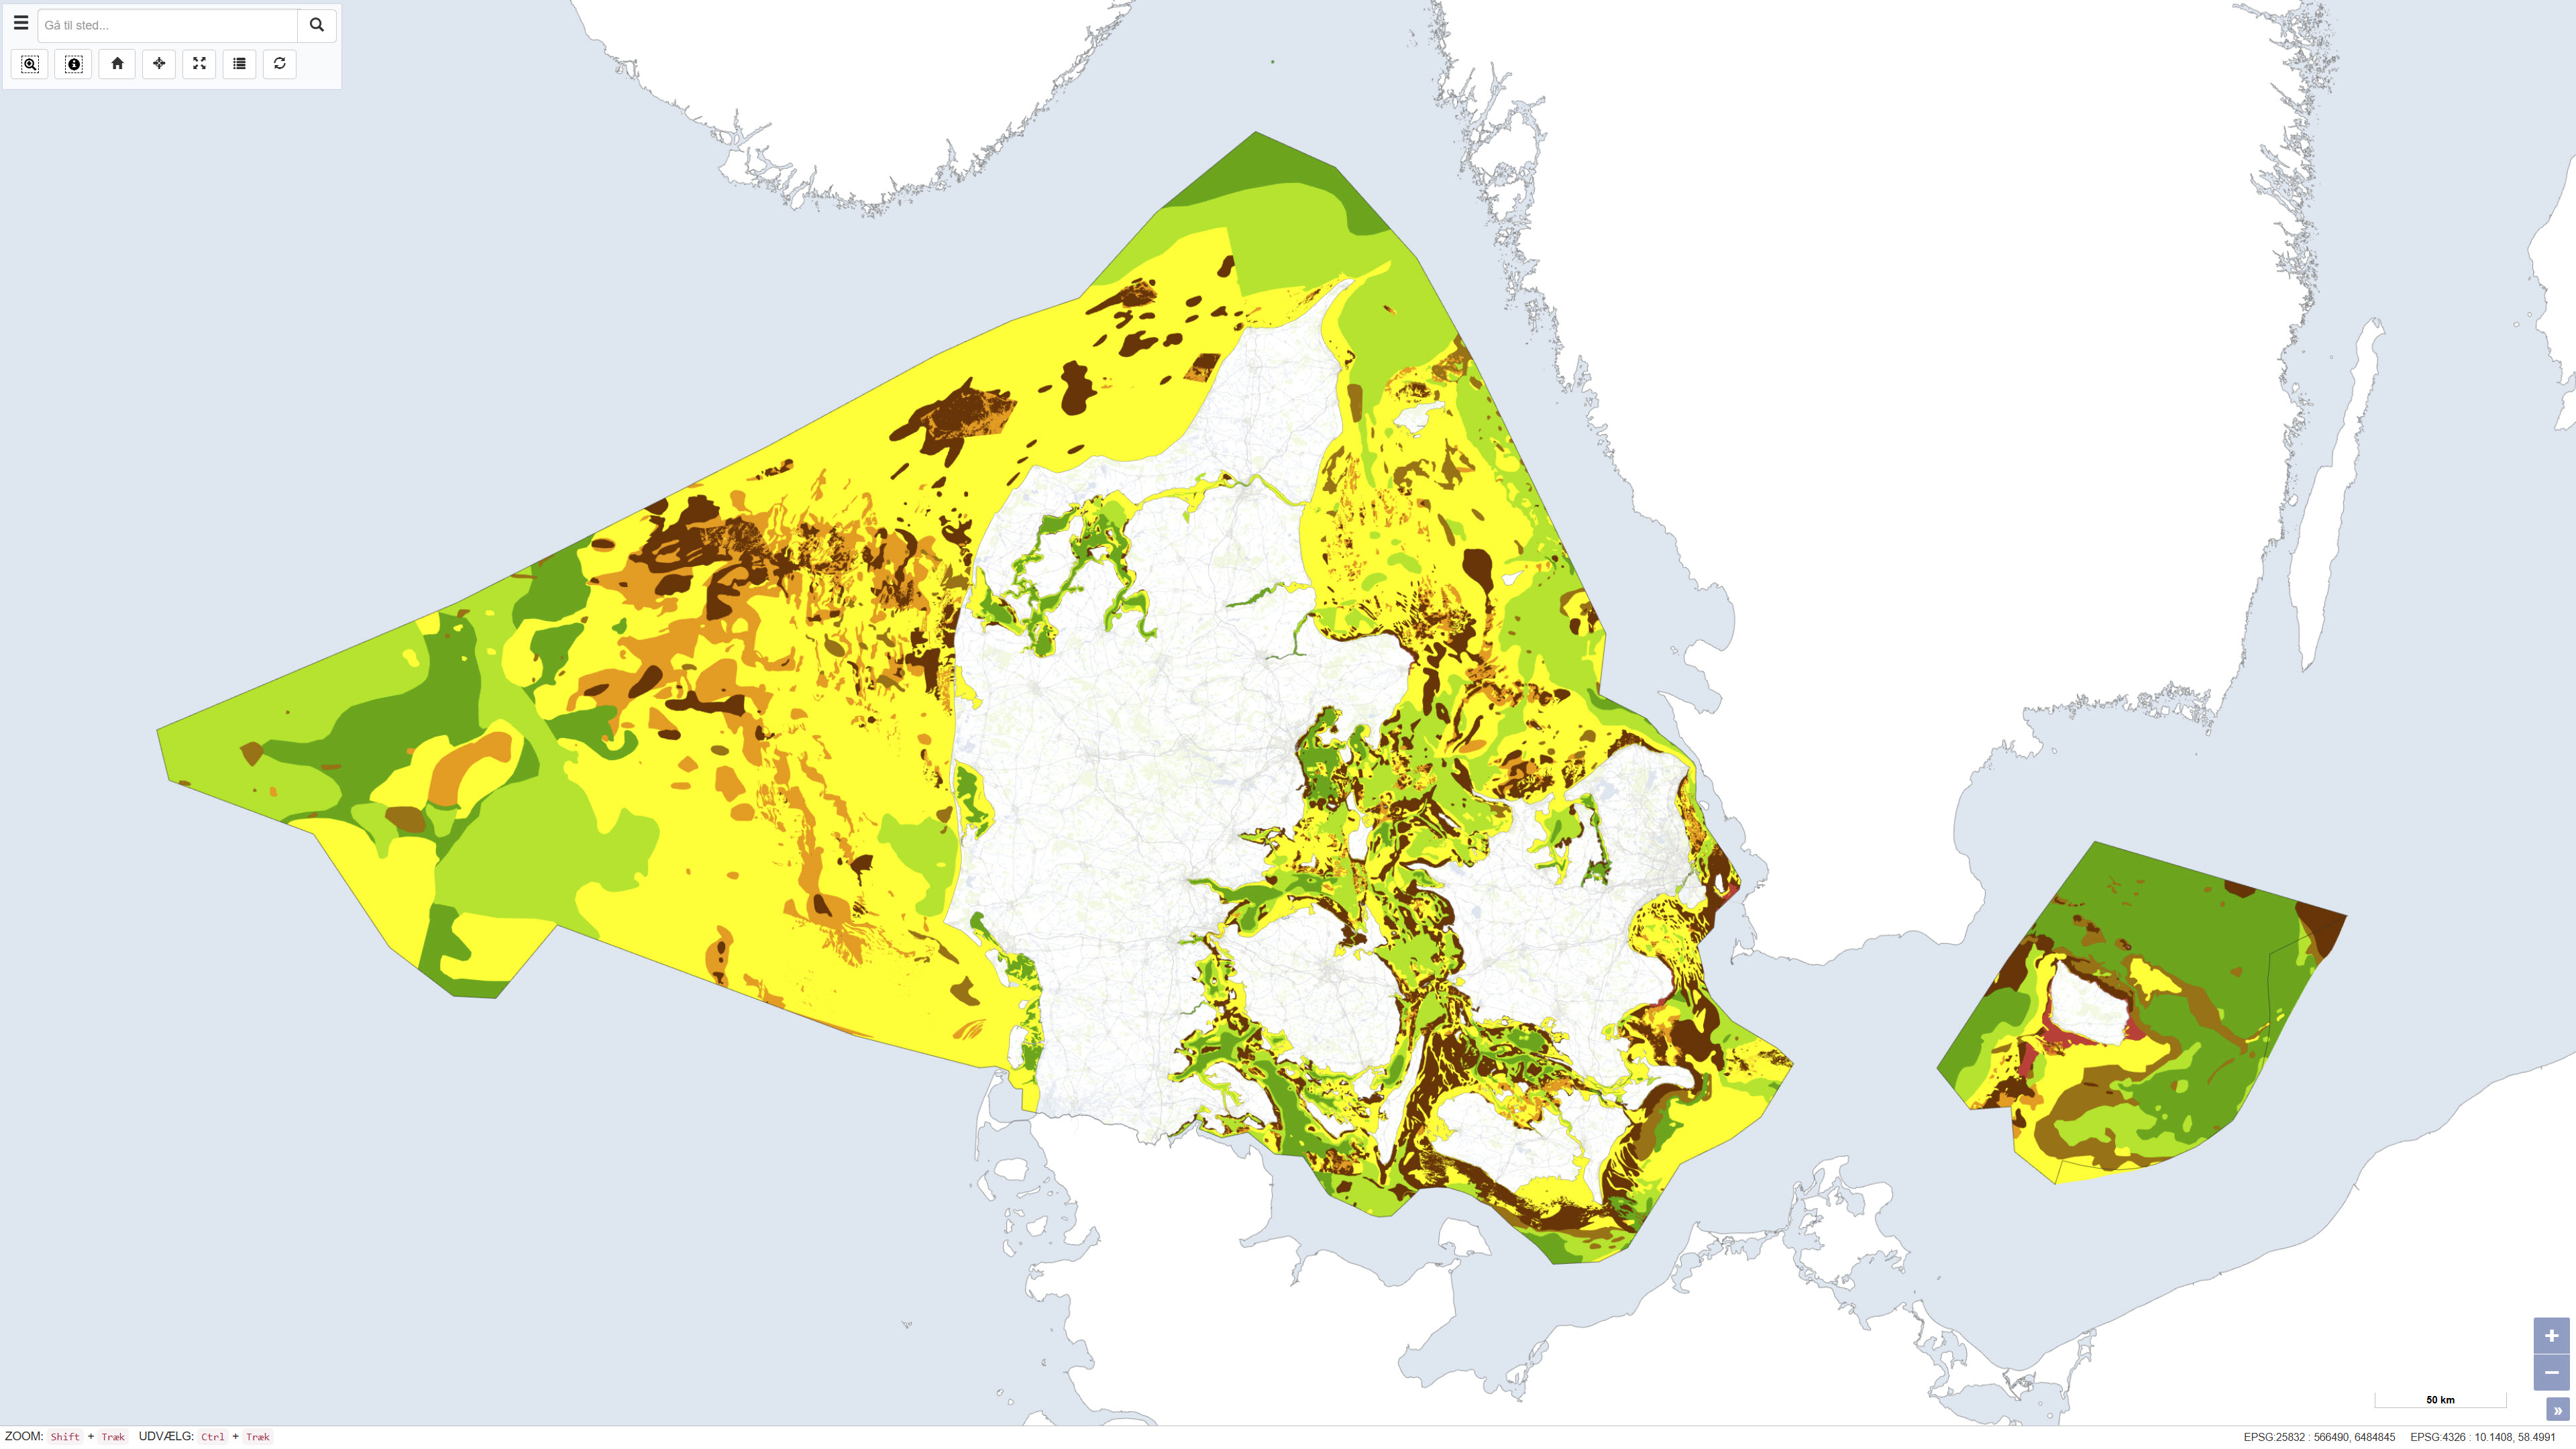
The Digital Geological Map of Denmark 1:25,000, version 7.0, is a nationwide geological dataset describing the distribution of near-surface soil and sediment types across Denmark. The dataset is produced and maintained by the Geological Survey of Denmark and Greenland (GEUS) and represents the latest version of the digital soil and sediment map at a scale of 1:25,000. The map is based on an integrated interpretation of geological field observations, borehole data, historical analogue maps, and more recent digital datasets. Soil and sediment units are classified according to their lithological and genetic characteristics and represent the dominant materials in the uppermost geological layers. The dataset is continuously updated, and version 7.0 includes both revisions of previously mapped areas and newly mapped regions. The dataset is widely used as a foundation for geological analysis, land-use planning, environmental assessment, groundwater protection, raw material management, research, and education. In version 7 from 2023, 93% of Denmark's land area is classified, and the map is continuously supplemented. The map and sediment type description are published in GEUS report 2023/29, where further information is available.