 Arctic SDI catalogue
GPKG
Type of resources
Available actions
Topics
Keywords
Contact for the resource
Provided by
Years
Formats
Representation types
Update frequencies
status
Scale
Resolution
-

Prospectivity model highlights areas of Canada with the greatest potential for magmatic nickel deposits. The preferred prospectivity model is based on public geological, geochemical, and geophysical datasets that were spatially indexed using the H3 discrete global grid system. Each H3 cell is associated with a prospectivity value, or class probability, calculated from the best-performing gradient boosting machines model. Model results are filtered to include the top 20% of prospectivity values for visualization purposes.
-

Prospectivity model highlights areas of Canada with the greatest potential for Mississippi Valley-type zinc deposits. The preferred prospectivity model is based on public geological, geochemical, and geophysical datasets that were spatially indexed using the H3 discrete global grid system. Each H3 cell is associated with a prospectivity value, or class probability, calculated from the best-performing gradient boosting machines model. Model results are filtered to include the top 20% of prospectivity values for visualization purposes.
-

In 1949 a magnitude 8.1 earthquake occurred on the Queen Charlotte Fault, off the west coast of the Haida Gwaii archipelago. This magnitude 8.0 scenario along the Queen Charlotte Fault is slightly different and closer to population centres than the magnitude 7.8 earthquake that occurred in 2012.
-

A magnitude 5.6 rupture scenario near Ottawa along the Gloucester Fault in the south of the city. This fault is not known to be active, but this scenario is representative of seismicity in the Ottawa Valley.
-
In 2015, a magnitude 4.7 earthquake occurred 60 km beneath Sidney, BC. This scenario visualizes the effects of that event if it had a magnitude of 7.1.
-

A predictive model for Canadian carbonatite-hosted REE ± Nb deposits is presented herein. This model was developed by integrating diverse data layers derived from geophysical, geochronological, and geological sources. These layers represent the key components of carbonatite-hosted REE ± Nb mineral systems, including the source, transport mechanisms, geological traps, and preservation processes. Deep learning algorithms were employed to integrate these layers into a comprehensive predictive framework. Here is a link to the publication that describes this product: https://link.springer.com/article/10.1007/s11053-024-10369-7
-
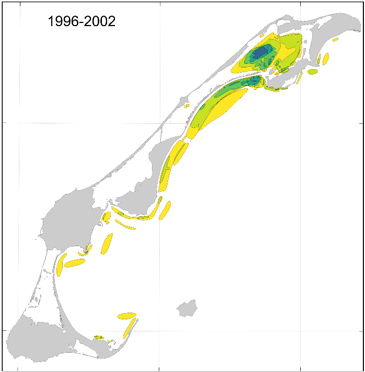
This cartographic dataset of areas of importance for spring herring in the Magdalen Islands was produced by Fisheries and Oceans Canada (DFO) and the Magdalen Islands ZIP Committee, as part of the work to characterize the Magdalen Islands Lagoons Marine Refuge. The initiative aimed to document fishermen's ecological knowledge of spring herring, including good fishing areas and spawning grounds around the archipelago. The data comes from interviews conducted between January and April 2024 with the most experienced fishermen in the archipelago. During the interviews, participants identified directly on digital maps the locations associated with four types of observations made throughout their careers: • Question 8 — Good fishing sites; • Question 9 — Other observations of high concentrations of the resource; • Question 13a — Spawning areas and; • Question 13b — Other observations of signs of spawning. To facilitate temporal contextualization, a four-period timeline (before 1996, 1996-2002, 2003-2006, and 2007-2021) was used. The final product is a GeoPackage (.gpkg) containing 16 vector layers composed of four layers per observation type, each corresponding to one of the defined time periods. The polygons were classified according to the number of fishermen who reported each location, making it possible to assess the degree of overlap and the relative importance of the areas over time. The data are projected in NAD83 / MTM zone 4. For more information on the methodology and data, see Burbank et al. (2025). Additional information specific to the Magdalen Islands lagoons is presented in Grégoire et al. (2026).
-

Prospectivity model highlights areas of Canada with the greatest potential for clastic-dominated zinc deposits. The preferred prospectivity model is based on public geological, geochemical, and geophysical datasets that were spatially indexed using the H3 discrete global grid system. Each H3 cell is associated with a prospectivity value, or class probability, calculated from the best-performing gradient boosting machines model. Model results are filtered to include the top 20% of prospectivity values for visualization purposes.
-

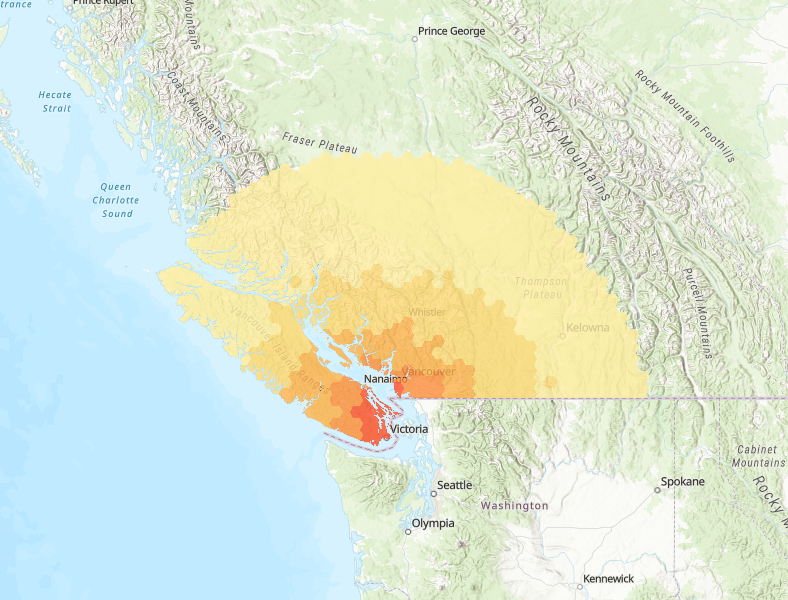
Full rupture of the Leech River Fault, a fault that cuts southern Vancouver Island and extends beneath Greater Victoria. Based on current science, this magnitude 7.3 earthquake scenario represents the strongest ground shaking event that could strike the region, and is one of Greater Victoria’s most severe events.
-

A magnitude 5.9 earthquake near Montreal, along the Milles-Îles Fault. This fault is not known to be active, but this scenario represents a small but damaging event near the City of Montreal.