 Arctic SDI catalogue
Competitive Science Research Fund (CSRF)
Type of resources
Topics
Keywords
Contact for the resource
Provided by
Formats
Representation types
Update frequencies
status
-

Coastal vegetated ecosystems are recognized for their role in cycling and storing carbon in the world’s oceans (i.e., blue carbon); however, high uncertainty in carbon sequestration rates is partly due to an absence of studies estimating carbon export to the deep sea. We modeled export from nearshore kelp forests and seagrass beds, showing variability by orders of magnitude across spatial scales (3 to hundreds of kilometers), kelp and seagrass species, seasons, and carbon forms, raising caution in using generalized export rates in blue carbon accounting. Our results also show rapid (20 to 30 days) and extensive export of neutrally buoyant dissolved organic carbon particles to the shelf break (up to 44% within 90 days), contrasting sinking particulate organic carbon particles that largely remained within 100-meter water depth in the nearshore. These results improve estimates of carbon sequestration by blue carbon ecosystems and reveal contrasting patterns of export relative to other regions of the globe. Cite this data as: Kira A. Krumhansl et al., Pathways of blue carbon export from kelp and seagrass beds along the Atlantic coast of Nova Scotia.Sci. Adv.11,eadw1952(2025).DOI: 10.1126/sciadv.adw1952
-

This dataset includes metrics of eelgrass traits related to bed structure, morphology, and physiology from field sites along the Atlantic coast of Nova Scotia, Canada. Field sites were located across a gradient of temperature and light conditions. Sampling was conducted in July to August, in 2017, 2021, and 2022. Seagrass density and plants were sampled at 10 haphazardly distributed sampling stations within each seagrass bed at approximately the same depth. Stations were ~10m apart and at least 2m from any seagrass-bare interface. Quadrats were used to determine vegetative and reproductive shoot density. Three plants from each sampling station were collected and processed in the laboratory for length and width leaf 3, number leaves per shoot, rhizome width, rhizome water soluble carbohydrates, and total leaf chlorophyll. Also included in this data temperature and light metric that summarize temperature and light conditions during the summer period. Cite this data as: Wong, M.C., Dowd, M. Data of eelgrass (Zostera marina) traits from the Atlantic Coast of Nova Scotia. Published: February 2025. Coastal Ecosystems Science Division, Maritimes Region, Fisheries and Oceans Canada, Dartmouth NS. For additional information please see: Wong, M.C., Dowd, M. Eelgrass (Zostera marina) Trait Variation Across Varying Temperature-Light Regimes. Estuaries and Coasts 48, 13 (2025). https://doi.org/10.1007/s12237-024-01439-3
-

This dataset includes metrics of eelgrass size, cover, and biomass from field sites along the Atlantic coast of Nova Scotia, Canada. Field sites were located across a gradient of environmental conditions, and field sampling was conducted in July to August 2022. Eelgrass percent cover, shoot density, and plants were sampled at 10 haphazardly distributed sampling stations within each eelgrass bed at approximately the same depth. Stations were ~10m apart and at least 2m from any eelgrass-bare interface. At each sampling station eelgrass leaves in a 0.5 x 0.5m quadrat were photographed for later computer image analysis to determine percent cover. The number of shoots were then counted in a 0.25 x 0.25m quadrat, and 3 vegetative shoots were collected. Shoots were measured for leaf length, width, and weight in the laboratory. These data were used to determine allometric and cover-biomass relationships for use in non-destructive estimation of bed biomass. Cite this data as: Wong, M.C., & Thomson, J. A. Data of eelgrass (Zostera marina) plant size (length, width), cover, and biomass from the Atlantic Coast of Nova Scotia. Published: February 2025. Coastal Ecosystems Science Division, Maritimes Region, Fisheries and Oceans Canada, Dartmouth NS. For additional information please see: Thomson, J. A., Vercaemer, B., & Wong, M. C. (2025). Non-destructive biomass estimation for eelgrass (Zostera marina): Allometric and percent cover-biomass relationships vary with environmental conditions. Aquatic Botany, 198, 103853. https://doi.org/10.1016/j.aquabot.2024.103853
-
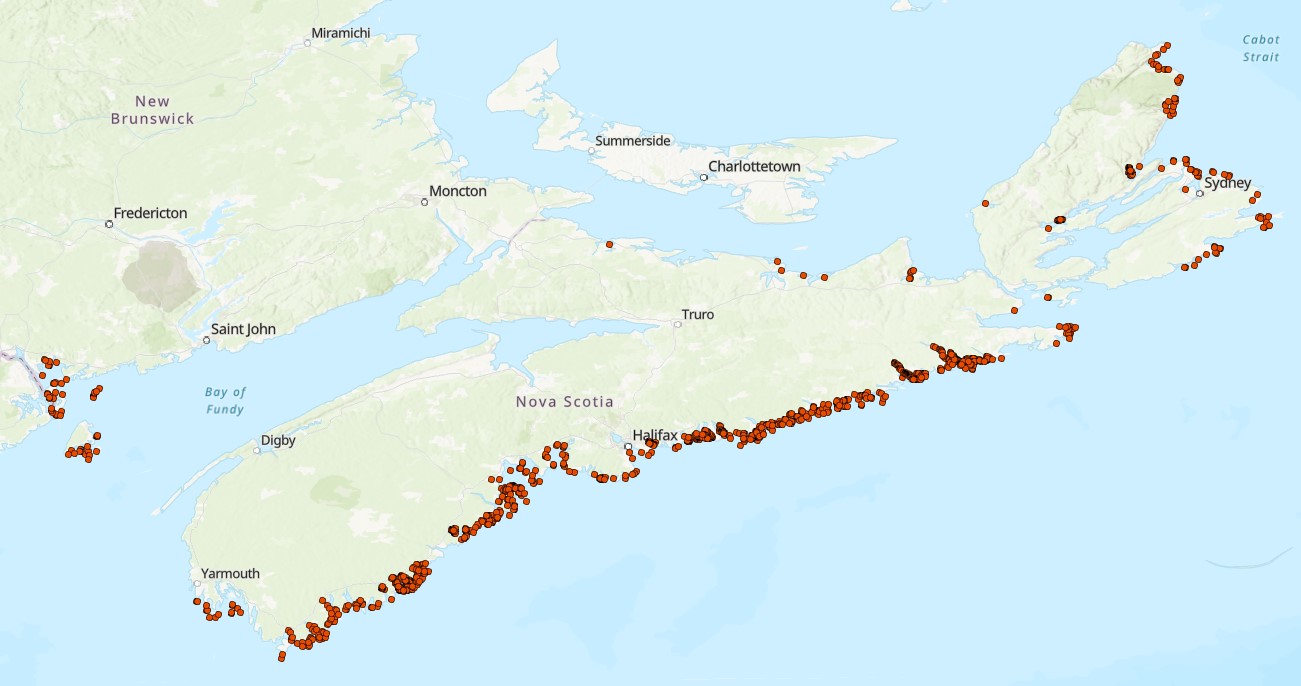
This is a collection of eelgrass (Zostera marina) presence and absence records collected between 2009-2025 in coastal waters in Nova Scotia, Canada. The data collection has been collated by the Coastal Benthic Ecology Lab (CBEL) at the Bedford Institute of Oceanography, Fisheries and Oceans Canada (DFO) under the supervision of Dr. Melisa Wong. Records include those from various research groups at DFO, Nova Scotia provincial departments, academia, and non-profit organizations. Data were collected using various methods including field measurements of eelgrass presence or absence via boat, snorkel and drop camera video transects, surface observations, and various sample collections (including plants, core, sediment, trawl, pop net, seine, etc.). Please see specific record references for associated metadata and detailed descriptions of the methods for eelgrass occurrence data collection. Where available, water depth (m) and substrate type (rock, soft, or mixed) are provided. The substrate type (hard substrate, mixed, mud, rocky, sand, or various combinations) used for the species distribution model published by O’Brien et al. 2022 is also provided where available. The data owner, data source (i.e., reference(s)), and use of the data in the species distribution model of O’Brien et al. 2022 are provided. All records from sources external to DFO are included under data sharing agreements or permission from the data owner. Cite this data as: Wong, M.C., Fraser, M., Thomson, J. A., O’Brien, J. Data of eelgrass (Zostera marina) occurrences in Nova Scotia. Published: April 2026. Coastal Ecosystems Science Division, Maritimes Region, Fisheries and Oceans Canada, Dartmouth NS.
-

This dataset was collected in support of a Competitive Science and Research Fund project (21-CC-05-06 Impacts of coastal acidification and climate change stressors on the Atlantic sea scallop: larval supply, recruitment and adaptive capacity to multiple global change drivers) lead by Fisheries and Oceans Canada (DFO). The objective of this research is to characterize coastal environmental conditions associated with scallop spawning and larval drift in Passamaquoddy Bay, New Brunswick. This dataset includes temperature, conductivity, salinity, sigma-theta, sea pressure, and depth information taken at weekly intervals at the sampling stations. In total, this dataset represents a total of 62 CTD profiles collected across 3 sampling stations over 22 sampling days from June to October 2022. Sampling stations were selected to compare scallop recruitment signals from Chamcook Harbour, a decommissioned scallop aquaculture site in Big Bay (MS-1077) and in the middle of Passamaquoddy Bay. Data were processed in accordance with instrumentation manufacturer guidelines and DFO Ocean Data and Information Section QAQC procedures. Cite this data as: Miller, E., Quinn, B., Azetsu-Scott, K., Childs, D., Gabriel, C-E., Newhook, M. 2025. Impacts of coastal acidification and climate change stressors on the Atlantic sea scallop. Published October 2025. Coastal Ecosystems Science Division, Fisheries and Oceans Canada, St. Andrews, N.B
-

The project (Quoddy Region Pelagics Telemetry) will support the assessment of the effects of aquaculture on the distribution and abundance of pelagic fishes (salmon, mackerel, herring) and large predators (shark, marine mammals) in Passamaquoddy Bay and the Bay of Fundy, an area of intense finfish culture. An acoustic receivers network is placed yearly (from April to December) across various passageways, locations of project-specific interest, and at aquaculture sites in the region. Tagged pelagic species will be tracked through the network to provide information on migration routes, movement speed, survival rates and suspected predators, and determine interaction and residence at aquaculture sites. The network was utilized for monitoring the passage of: hatchery-reared wild salmon (n=340) released in the Magaguadavic River in 2018, 2019 and 2021, wild alewives (n=30) from the St. Croix River in 2021, and farmed Atlantic salmon released in the wild (n=99) in 2021. The receiver network has more recently supported adjacent projects on the use of the region by white shark and porbeagle as well as the residence of mackerel, herring, and sculpin at farm sites. The receivers additionally support other researchers with detection of striped bass, Inner Bay of Fundy Atlantic salmon, sturgeon, and many other species. Placement of the network will continue into 2025 inclusive with the longer-term goal to eventually deploy an array covering the entrance to the Bay of Fundy. Cite this data as: Trudel, M., Wilson, B., Black, M. 2023. Assessing bay-scale impacts of aquaculture operations on the distribution and abundance of pelagic fishes and large predators. Accessed via the Ocean Tracking Network OBIS IPT in January 2025 (version 3.1). https://doi.org/10.14286/xfa6sr
-

A global decline in seagrass populations has led to renewed calls for their conservation as important providers of biogenic and foraging habitat, shoreline stabilization, and carbon storage. Eelgrass (Zostera marina) occupies the largest geographic range among seagrass species spanning a commensurately broad spectrum of environmental conditions. In Canada, eelgrass is managed as a single phylogroup despite occurring across three oceans and a range of ocean temperatures and salinity gradients. Previous research has focused on applying relatively few markers to reveal population structure of eelgrass, whereas a whole genome approach is warranted to investigate cryptic structure among populations inhabiting different ocean basins and localized environmental conditions. We used a pooled whole-genome re-sequencing approach to characterize population structure, gene flow, and environmental associations of 23 eelgrass populations ranging from the Northeast United States, to Atlantic, subarctic, and Pacific Canada. We identified over 500,000 SNPs, which when mapped to a chromosome-level genome assembly revealed six broad clades of eelgrass across the study area, with pairwise FST ranging from 0 among neighbouring populations to 0.54 between Pacific and Atlantic coasts. Genetic diversity was highest in the Pacific and lowest in the subarctic, consistent with colonization of the Arctic and Atlantic oceans from the Pacific less than 300 kya. Using redundancy analyses and two climate change projection scenarios, we found that subarctic populations are predicted to be more vulnerable to climate change through genomic offset predictions. Conservation planning in Canada should thus ensure that representative populations from each identified clade are included within a national network so that latent genetic diversity is protected, and gene flow is maintained. Northern populations, in particular, may require additional mitigation measures given their potential susceptibility to a rapidly changing climate. Cite this data as: Jeffery, Nicholas et al. (2024). Data from: Variation in genomic vulnerability to climate change across temperate populations of eelgrass (Zostera marina) [Dataset]. https://doi.org/10.5061/dryad.xpnvx0kp2