Fennoscandia
Type of resources
Available actions
Topics
Keywords
Contact for the resource
Provided by
Years
Service types
-

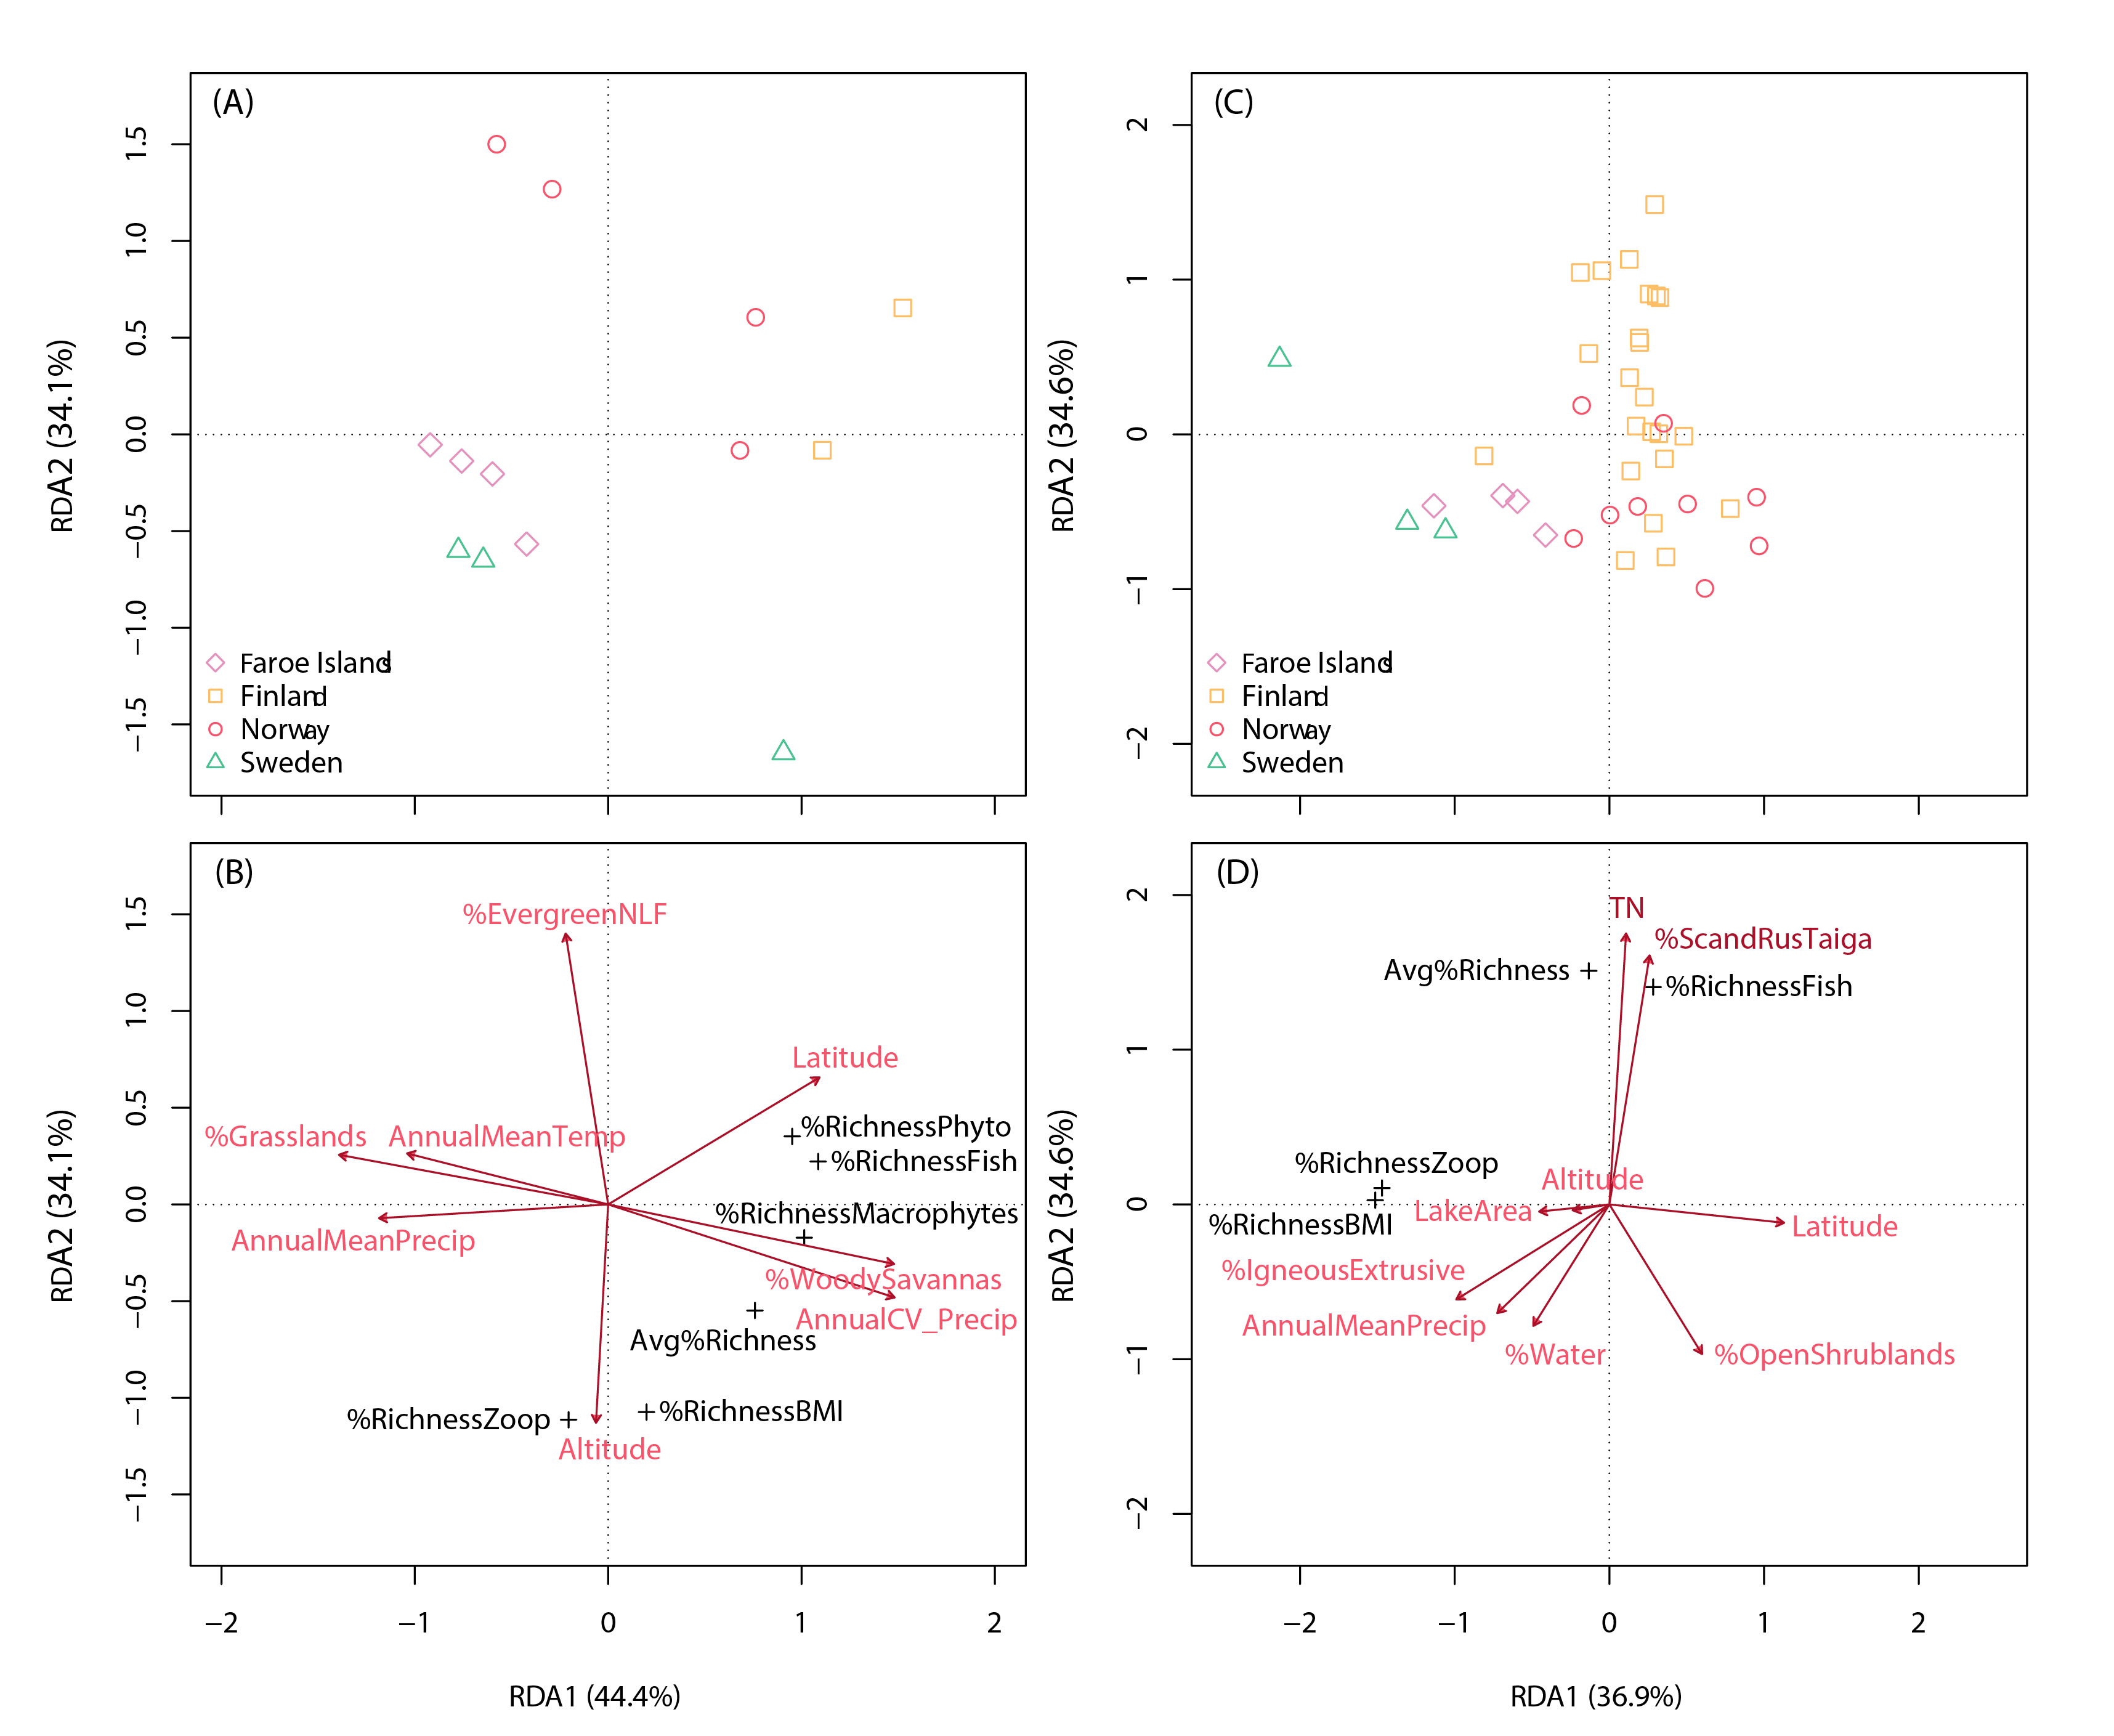
Redundancy analysis of percentage species taxa share (taxa richness relative to richness of all taxa) among 5 FECs (phytoplankton, macrophytes, zooplankton, benthic macroinvertebrates and fish) in 13 Fennoscandian lakes (panels A and B) and among 3 FECs in 39 Fennoscandian lakes (panels C and D).The upper panels show lake ordinations, while the bottom panels show explanatory environmental variables (red arrows), as indicated by permutation tests (p < 0.05). Avg%Richness: average species taxa richness as a percentage of richness of all FECs (i.e., including benthic algae if present); %Richness BMI: relative taxa share in benthic macroinvertebrates; %EvergreenNLF: percentage cover of evergreen needle-leaf forests. State of the Arctic Freshwater Biodiversity Report - Chapter 5 - Page 87 - Figure 5-4
-
This service is a joint contribution by the geological surveys in Finland, Norway and Sweden to the OneGeology initiative. The Geological Map of Fennoscandian Shield outlines the main features of Finland's, Norway's and Sweden's bedrock geology. The map is composed of data resulting from several mapping campaigns, performed over decades and compiled and archived in digital format. Due to the variation of quality and scales of different mapping campaigns the level of accuracy in the underlying national database is variable. This service includes layers showing bedrock areas defined by lithology, dyke swarms and tectonic structures.
 Arctic SDI catalogue